Study on Measurement Method of Anaerobic Sludge Activity: Hydrogen Production
Received: 14-Dec-2016 / Accepted Date: 29-Dec-2016 / Published Date: 05-Jan-2017 DOI: 10.4172/2576-1463.1000150
Abstract
In this research finding, a new method is derived by adopting Maximum Specific Hydrogen Production Rate (Umax•H2) to measure the activities of anaerobic sludge for hydrogen production. With batch fermentation instrument under mesophilic (35°C ± 1°C) condition the research has been implemented and concluded. In this study, during the demonstration of experiments, for hydrogen fermentation as for the inoculum there three different active sludges are used and as for the feeding materials there kitchen wastes are tested. After resulting analysis it’s been showed that using the Maximum Specific Hydrogen Production Rate (Umax•H2) as a means to be an index or a method of sludge activity measurement-is reported as satisfactorily feasible and applicable. The Umax•H2 values of experimental groups for this research methodology are recorded as the following: Umax•H2(A)=30.24mL/gVSS•h, Umax•H2(B)=10.80mL/gVSS•h, Umax•H2(C)=18.05mL/gVSS•h. The Correlations between Umax•H2 and other parameters, such as cumulative hydrogen yield, fermentation period and degradation rate of TS are all remain Significant throughout the research. During experimental implementation, Pearson Correlation between Umax•H2 and fermentation period is reported as 0.997 achieving statistical Significance 0.047 (<0.05). Pearson Correlation between Umax•H2 and cumulative hydrogen yield is reported as 0.999 achieving a considerable trend toward Significance 0.022 (<0.05). Pearson Correlation between Umax•H2 and degradation rate of TS is reported as 0.999 Signifying a marginal trend toward Significance 0.027 (<0.05).
Keywords: Maximum specific hydrogen production rate; Kitchen waste; Anaerobic sludge activity; Hydrogen production; Anaerobic inoculums; Degradation rate
22551Introduction
With increasing number of population and associated people's living standard-have been causing the rapid growth and production of kitchen wastes in current ages. It is well estimated that 36.5 million tons of kitchen wastes are being produced each year in India [1]. Even in China, 1.61 million tons of family food wastes had been being produced until 2013 [2]. Kitchen wastes are unquestionably harmful and can be active factors of environmental pollution being infectious to human health if its’ not been treated promptly and properlybecause of the remaining or left over wastes contain high contents of water and organic materials [3], which are certainly putrefactive [4] by causing groundwater resources polluted. Emission of Volatile Organic Sulfur Compounds (VOCs) during aerobic decomposition of food wastes can cause air pollution [5]. All sorts of pollutions can be promoted and produced during transforming food residue to feed [6]. As known kitchen waste contains a lot of Salmonella, Staphylococcus aureus and other pathogenic microorganisms [7], which can be inimitably dangerous to peoples’ health. Therefore, it has become a worldwide catchy matter of concern that how to make the food waste harmless, recycled and reproduced economically and sustainably. The common processing methods for kitchen wastes can be as reported from previous works are-direct emissions after mechanical pulverization [8], incineration and landfill [8], usage for feeding [9], composting [10], anaerobic digestion technology [11], etc. To treat the kitchen waste using anaerobic digestion technology can be beneficiary of both the elimination process of environment pollution and the resource utilization of wastes. Hydrogen production is one of the effective and efficient applications of anaerobic digestion technologies, which is preceded by physiological and metabolic activity of microbial. By dehydrogenation of organic compounds in the fermentation process, the surplus electrons of the redox process are balanced to ensure the smooth metabolic processes for the hydrogen production and inspection [12,13].
The choice of activated sludge in anaerobic digestion for hydrogen production plays an important role. At present, the indexes of activated sludge usually include Dehydrogenase Activity, ATP content, Oxygen Up taking Rate, Mixed Liquor Suspended Solid (MLSS) and Mixed Liquor Volatile Suspended Solids (MLVSS), Sludge Volume Index (SVI), Headspace Gas Chromatography Technology, Maximum Specific Methane Production Rate, etc. [14-18]. However, most of the above mentioned methods are mainly designed by concentrating on the activity measurement of the aerobic sludge; which clearly states that the study on fermentative activity measurement of anaerobic sludge is insufficient and not even on consideration table in recent research works. In this research article, Umax•H2 is defined as a measurement method of anaerobic sludge activity, and three different inoculums are cultivated and are adopted to test the measurement method to initiate the hydrogen production process of kitchen wastes. The study is to provide certain scientific basis for screening and preventing the demonstration of highly activated sludge, hydrogen production by anaerobic fermentation and energy-oriented use of kitchen wastes.
Materials and Methods
Feeding material
The feeding materials for this study are the kitchen wastes, which are taken from the canteen of Yunnan Normal University. After picking and separating out the plastic bags, chopsticks and other undigested sundries, the residues are dried out using thermostat oven at 105°C and pulverized into powder (30-200 mesh) using the pulverizer (Shanghai Guning Instrument Co., Ltd., DFY-400C, 30-200 mesh). The powder materials are directly used as feeding materials of digestion measurement. The Total Solids (TS) and Volatile Solids (VS) of feeding materials are measured before and after the fermentation process.
Inoculums
The inoculums A and C are obtained from the Biomass Energy Laboratory of Solar Energy Institute, Yunnan Normal University. Inoculums B is the sludge that has been obtained from a wastewater treatment plant in Kunming, China. The methods of the inoculums cultivation are captivated from Enrichment Culture [19]. To carry out the cultivation process-the substrate and fermentation residue are to be mixed at the ratio of 3:2 [20,21] then the mixture is to be placed in a sealed container to cultivate for 1-2 months until it turns in color of black or gray-black and gas production comes to the stop [22,23]. Inoculums A is to be cultivated at 35°C, and inoculums C is to be cultivated at ambient temperature.
Experimental design
In this finding, Batch fermentation technique [24] is adopted as the designing process of experiment, and all the experiments are carried out under mesophilic (35°C ± 1°C) condition. Three experimental groups and three parallels for each group are set to run the experiment all through.
The quantity of waste and inoculums are calculated by the following formula [25].
W0×CTS=W1×TS1+ W2×TS2 (1)
In which, CTS is the TS (%) of the fermentation mixture; W0 is the total amount (g) of the fermentation mixture; W1 is the feeding amount (g) of wastes; W2 is the feeding amount (g) of the inoculums; TS1 is the TS (%) of wastes; TS2 is the TS (%) of inoculums.
Experimental equipment
The experiment equipment (Figure 1) consists of a digestion bottle, a gas collecting bottle, a volume measurement bottle and a set of temperature control device.

Figure 1: Experimental equipment for anaerobic fermentation.
The capacity of fermentation system is 500 ml, and the air tightness of system is checked before the fermentation process in order to avoid possible gas leakage. The produced gas does get into the gas collecting bottle from fermentation bottle; and which then form the saturated NaHCO3 solution into volume measurement bottle from the gas collecting bottle. The volume of the production gas can be obtained by reading the scale of measurement bottle.
Measurement method
During the experimental installation and implementation, the TS and VS have been measured by the standard analysis methods [26].
pH value: Precision acidity meter of pHS-3C (Shanghai Hongyi Instrumentation Co., Ltd., 04C-482) is to measure the value. The VSS is measured by the gravimetric method [27].
Gas yield [28] using NaHCO3-draining (saturated solution of NaHCO3) method is to record the daily gas yield of each group in regular basis right after the experiment starts. In each group, during the field study as the characteristic gas yield, the average gas yield of 3 parallels is assumed.
Hydrogen concentration: Using Gas Chromatograph (Lunan Analytical Instrument Co., Ltd, GC-6890A) hydrogen concentration is to be measured.
Statistical method: Statistical analysis of Data using software named of SPSS and Origin 8.6.
Analysis method
The maximum specific hydrogen production rate (Umax•H2) is defined as the maximum yield of hydrogen gas per h per gram of VSS (indirectly represents biomass living weight of anaerobic sludge), the unit is mL/g•VSS•h.
The following expression can be drawn from the Monod equation U=Umax•S/Ks+S:
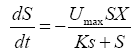 (2)
(2)
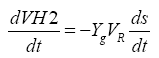
In the formula, S: Substrate concentration (gVS/L); t: time (h); Umax: Substrate maximum degradation rate (h-1); SX: Saturated microorganism concentration (gVSS/L); Ks: Saturation constant (g/L). The net sludge yield coefficient is declared as in small number under anaerobic condition. Concentration of microbes (recording it as X) is high in the reactor, while microbiological increment (recording it as ΔX) is much smaller than X. Therefore, X is considered to be approximately constant. In the measurement area, dissolved gas in the mixture is saturated; the gas dissolved in the mixture can be neglected. The kitchen waste is hydrolyzed fast in anaerobic systems, hydrogen production rate of kitchen waste is proportional to the rate of matrix degradation, and the following equation can be deduced as follow:
 (3)
(3)
In which, VH: Cumulative production of hydrogen (mL); Yg: Conversion coefficient from the substrate to the gas (mLgas/ gVSsubstrate); VR: Reaction zone volume (L).
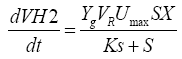
From the above equation, it can be deduced as follow:
 (4)
(4)
At the beginning of the reaction, substrate concentration is high, S>>KS, Ks is negligible. Equation (4) can be as follow:
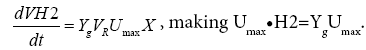
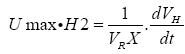
Thus the maximum specific hydrogen production rate can be obtained as follow:
 (5)
(5)
According to the linear regression equation which is obtained in measurement area [29-31] from which the slope of the linear regression equation  can be calculated (Table 1).
| Item | TS (%) | VS (%) | VSS(g/L) | pH Value |
|---|---|---|---|---|
| Powder Wastes | 97.62 | 88.85 | - | - |
| Inoculum A | 4.62 | 69.27 | 4.84 | 5.09 |
| Inoculum B | 9.57 | 66.44 | 6.21 | 5.03 |
| Inoculum C | 7.56 | 69.70 | 4.52 | 4.91 |
Table 1: TS, VS and pH values of original materials and inoculums.
Based on the statistical principle, multiple comparisons have been used to analyze the mean difference of fermentation indexes between the experimental groups. And the correlation between Umax•H2 and other indexes have been analyzed in order to discuss and represent that whether the use of Umax•H2 as a measurement method of sludge activity is feasibly demonstrative or not. Fermentation indexes are selected as follows in order to show the hydrogen production activity of sludge [32-34] the maximum hydrogen production per h is used to mirror the peak of hydrogen production; the fermentation period is used to show the total time consumption in fermentation process, the cumulative hydrogen yield is used to realize the potential of the hydrogen production, the degradation rate of TS is used to reflect the material consumption.
Results and Discussion
Analysis results of relevant indexes of fermentation
As shown in Table 2, the TS and VS value of fermentation liquid in experimental groups get reduced after the fermentation process, and the pH value gets increased considerably. It can be considered and explained as that the raw materials are consumed to produce hydrogen and organic acids. And the depletion of organic acids makes the pH value increased. The TS and VS consumption ratios of experimental group A are obtained in amount of 27.43% and 30.40% respectively. The TS and VS consumption ratios of experimental group B are found in rate of 11.20% and 14.61% respectively. TS and VS consumption ratios of experimental group C are recorded in rate of 16.64% and 19.56% respectively. It represents the little change about the indicators of the control groups.
| Before Fermentation | After Fermentation | |||||
|---|---|---|---|---|---|---|
| Item | TS (%) | VS (%) | pH Value | TS (%) | VS (%) | pH Value |
| Control Group A | 2.55 | 68.6 | 5.12 | 2.33 | 66.47 | 5.19 |
| Control Group B | 3.05 | 66.24 | 5.07 | 2.96 | 65.78 | 5.11 |
| Control Group C | 3.69 | 67.69 | 4.96 | 3.44 | 66.78 | 5.02 |
| Experimental Group A | 6.78 | 88.82 | 4.62 | 4.92 | 85.19 | 5.41 |
| Experimental Group B | 6.43 | 77.44 | 4.56 | 5.71 | 74.46 | 5.49 |
| Experimental Group C | 6.97 | 82.3 | 4.58 | 5.81 | 79.42 | 5.37 |
Table 2: TS, VS and pH value of feed liquid.
Analysis of hydrogen net production curve
Figures 2 and 3 shows that the hydrogen net production (the experimental group production value minus the control group production value) per h is not similar, hydrogen net production that do differ at every experimental group are as follows: In group A, hydrogen production gets increased rapidly after 9th h, and its’ peak-hour is found in 10th-19th h. The hydrogen yield is reduced after 20th h. In-group B; hydrogen production begins to increase after 10th h. Its’ peak-h is found in 13th-19th h. The hydrogen yield gets reduced after 20th h. In-group C, hydrogen production gets increased rapidly after 8th h, whose peak-h is listed at 10th-24th h. The hydrogen yield is reduced after 25th h.

Figure 2: Hydrogen net yield curve of the experimental groups.

Figure 3: Hydrogen net cumulative yield curve of the experimental groups.
Calculation and analysis on the activity of hydrogen production
As shown in Figures 4-6 the slope of the regression equation which are obtained from the measurement area [29-31] of cumulative gas production curve of experimental group A, B, C are: KA=58.56; KB=26.82; KC=32.63. And thus the Umax•H2 could be obtained by the calculation.

Figure 4: Cumulative hydrogen yield curve in measuring area of experimental group A and the regression equation.

Figure 5: Cumulative hydrogen yield curve in measuring area of experimental group B and the regression equation.

Figure 6: Cumulative hydrogen yield curve in measuring area of experimental group C and the regression equation.
As shown in Table 3, Umax•H2(A)>Umax•H2(C)> Umax•H2(B), which means that the activities of the inoculums (A, B and C) in the fermentation process of the kitchen wastes to produce hydrogen are different. Statistical result shows that the difference of activities (inoculums A, B and C) is considerably Significant (Sig.<0.01).
| Experimental Group | Maximum Hydrogen Production Per Hour (MHPPH)/ml | Fermentation Period (FP)/h | Cumulative Hydrogen Yield (CHY)/ml | Degradation Rate of TS (DR)/% | Umax•H2 mL/gVSS•h |
|---|---|---|---|---|---|
| A | 66.00a | 51.00a | 1016.00a | 27.43a | 30.24a |
| B | 35.00b | 35.00b | 387.00b | 11.20b | 10.80b |
| C | 38.00b | 42.00c | 641.00c | 16.64c | 18.05c |
Table 3: Indexes of anaerobic fermentation.
In startup phase of reaction, the substrate is enough to run the experiment, and Michaelis-Menten equation shows that the reaction is in zero order in a period of time, the Specific Hydrogen Production Rate is constant, and its’ numerical value is equal to the Maximum Specific Hydrogen Production Rate. Umax•H2 shows as constant, it represents that the maximum capacity of anaerobic microbial degradation of the organic matrix. For the same substrate, having the higher Umax•H2 value can results in the activity of the anaerobic sludge even as stronger. Umax•H2 can be used to compare the activity of different anaerobic sludge’s in the same environmental conditions, or compare the activity of anaerobic sludge in different environmental (such as in different temperatures) conditions. It can also be used to evaluate the ability of anaerobic sludge to the degradation process of different substrates.
Analysis on the indexes of anaerobic fermentation
Table 3 indicates that indexes of experimental group A are better than the other experimental groups. Statistical result shows that the Mean Difference of fermentation period, cumulative hydrogen yield, degradation rate of TS and Umax•H2 is considerably significant (Sig.<0.01) in different experimental groups. It illustrates that the activities of three inoculums in the fermentation process of the kitchen wastes to produce hydrogen are remarkably different. Umax•H2 can be used as an activity index of sludge for the hydrogen production, and the obtained results from it are consistent with other fermentation indexes.
As shown in Table 4, the Correlations between Umax•H2 and other parameters-such as cumulative hydrogen yield, fermentation period and degradation rate of TS are all significantly identical up to 95% level. It indicates that using Umax•H2 as an index of fermentation for hydrogen is feasible. In addition, highly active sludge can be screened through this method.
| Item | Umax•H2 | Maximum Hydrogen Production Per Hour | Fermentation Period | Cumulative Hydrogen Yield | Degradation Rate of TS | |
|---|---|---|---|---|---|---|
| Pearson Correlation | 1 | 0.958 | 0.997* | 0.999* | 0.999* | |
| Umax•H2 | Significant | 0.185 | 0.047 | 0.022 | 0.027 | |
| Maximum Hydrogen Production Per Hour | Pearson Correlation | 0.958 | 1 | 0.935 | 0.948 | 0.969 |
| Significant | 0.185 | - | 0.232 | 0.207 | 0.158 | |
Table 4: Correlation between different indexes.
The Mean Difference of maximum hydrogen production per h is not significant between experimental group B and group C (Sig.>0.01). And the Pearson Correlations between maximum hydrogen production per h and other indexes are not significant (Sig.>0.05). It indicates that using maximum hydrogen production per h as a sole index of fermentation process is not recommendable and feasible.
Conclusion
1. From the statistical results of the experimental data it is showed that Umax•H2 of three experimental groups are found different from each other. The mathematical representation of the results of researched activities can be stated as following: Umax•H2(A)> Umax•H2(C)>Umax•H2(B).
2. The indexes of three different inoculums for hydrogen production using anaerobic fermentation are found different from each other and the Mean Difference is reported as Significant (Sig.<0.01) where there it’s been found that the group experimental A gets the highest production rate than the followed experimental group B and the experimental group C, also listed that experimental group B has the lowest production rate.
3. By the Correlation analysis between Umax•H2 and other fermented indexes its’ been showed that using Umax•H2 as an index or method of the activity of inoculums for hydrogen production is practically feasible and implementable, and the prominent and satisfactory value of which can be obtained by running the experiment as discussed.
Acknowledgement
We are thankful to Solar Energy Research Institute Laboratory and staffs of Yunnan Normal University. This research was funded by National Natural Science Foundation (41561108). Thanks to the entire team for their outstanding supports in the project completion.
References
- Riar N, Khitoliya RK, Kumar S (2013) A study of treatability of kitchen wet waste and biogas production. J Int J Comp Eng Res 3: 62-65.
- Zhang Q, Ye JI, Wei JI (2013) Research progress of energy production from kitchen garbage. Chem Indus EngProg 32: 558-562.
- Wang P, Ren LH, Gan X (2013) Investigation and output factors analysis of restaurant garbage for cities in China. J Environ Sci Tech 36: 181-185.
- Guomei C (2007) Study on management of producing fertilizer by food waste. Tianjin University.
- Wu T, Wang X, Li D, Yi Z (2010) Emission of volatile organic sulfur compounds (VOSCs) during aerobic decomposition of food wastes. AtmEnviron 44: 5065-5071.
- Changyong X, Wei S, Shuqing Z, Jinghao L, Zhihong P (2011) Homologous pollution for transforming food residue to feed. J Environ SanitEng 1: 9-11.
- Sheng H (2010) Hazard of improperly utilizing and disposing food residue. J Environ SanitEng 18: 3-15.
- Chen E, Xiangyang G (2012) Technology Evolve of Food Waste Treatment and Resource Recovery. J Environ Stud Monit 25: 57-61.
- Fu K, Ren XY, Fu FH (2013) The characteristics of food waste in coastal tourism city and the Disposals. J China Biogas 31: 11-14.
- Abdullah N, Chin NL (2010) Simplex-centroid mixture formulation for optimised composting of kitchen waste. BioresourTechnol101: 8205-8210.
- Zhu H, Parker W, Conidi D, Basnar R, Seto P (2011) Eliminating methanogenic activity in hydrogen reactor to improve biogas production in a two-stage anaerobic digestion process co-digesting municipal food waste and sewage sludge. BioresourTechnol102: 7086-7092.
- Mingxing Z (2010) Optimization of control factors during hydrogen production process from kitchen wastes by anaerobic digestion.
- Jin-ling C, Wang G (2013) Bioreactor for fermentative hydrogen production: a review. J Environ Sci Tech36:78-84.
- Xiaolu X, Xiuying S (1993) Evaluation of active indicator of activated sludge. J Environ Sci 14: 58-62.
- Dian H, Wang F (2010) The description of activated sludge activity detection method. J SciTechn Information 01: 381-382.
- Zhang LH, Li X (2011) Comparative study on detection methods of property of activated sludge. Ind Water Wastewater 42: 89-93.
- Sun L, Chai X, Wan S (2007) A rapid measurement method of the activity of anaerobic sludge by using headspace technology. Chinese J Chromatogr 25: 443-444.
- Gu WWHJ, Xiasheng (1985) Maximum Specific Methane Production Rate of Anaerobic Slugde and Its Measurement by Batch Test. J China Water Wastewater 1: 31-35.
- Ronghou L (2009) Biomass Energy Engineering. B Chemical Industry Press, Beijing, p: 28.
- Hongchuan S, Wudi Z, Fang Y (2004) Knowledge of rural household biogas digesters. B Yunnan Science and Technology Press, Kunming, pp: 49-50.
- Rui S (2010) The effect and production of the biogas inoculums. J Fujian Agr 12: 30-31.
- Xingjun Y, Yishui T (2005) Clean conversion and utilization technology of biomass resources. B Chemical Industry Press, Beijing, pp: 41-42.
- Li JC, Yuan YG, He J, Xu R (2013) Relationship between lipase activity and biogas rate in anaerobic digestion of organic fraction of municipal solid waste. IntApplMech Mat 295: 1834-1839.
- Li JC, He J, Yuan YG, Sun KW, Liu SQ, et al. (2013) Relationship between α-amylase activity and biogas rate during anaerobic digestion of organic fraction of municipal solid waste. EnvSci Tech 36: 22-25.
- Chinese Academy of Sciences (1984)Theconventional analysis of biogas fermentation. B Sci Tech Press. Beijing, p: 19.
- He YL (1998) Anaerobic biological treatment of wastewater. B. China Light Industry Press, Beijing, pp: 558-560.
- Liu RH, Hao YY, Wu LJ (2006) Effect of temperature on biogas yield and property during anaerobic fermentation process of pig dung. Renewable Energy 5: 32-35.
- Yang Q, Shang HT (2006) The study on anaerobic baffled reactor treating municipal wastewater. J China Biogas 24: 9-14.
- Zhao Y, Deng Y, Yin X, Zhang H, Tang Y, et al. (1994) Study on stability substrate-metabolism and interspecies H2 transfer of granular sludge with high activity. ActaMicrobiolSinica 34: 372-378.
- Yaqian Z (1993) A new method for measuring maximum specific methane production rate of anaerobic sludge. J China Biogas 11: 19-22.
- Zhang W, Fang Y, Yi L, JianChang L, Rui X, et al. (2008) Study on fermentation for hydrogen production with rural biomass and manure. RenEnergResour 26: 69-72.
- Li C, Champagne P, Anderson BC (2011) Evaluating and modeling biogas production from municipal fat, oil, and grease and synthetic kitchen waste in anaerobic co-digestions. BioresourTechnol102: 9471-9480.
- Abdullah N, Chin NL, Mokhtar MN, Taip FS (2013) Effects of bulking agents, load size or starter cultures in kitchen-waste composting. IntJRecyclingOrg WasteAgr 2: 1-10.
Citation: Yage Y, Rui X, Jianchang L, Huanyun D, Qiuxia W, et al. (2017) Study on Measurement Method of Anaerobic Sludge Activity: Hydrogen Production. Innov Ener Res 6: 150. DOI: 10.4172/2576-1463.1000150
Copyright: © 2017 Yage Y, et al. This is an open-access article distributed under the terms of the Creative Commons Attribution License, which permits unrestricted use, distribution, and reproduction in any medium, provided the original author and source are credited.
Share This Article
Recommended Journals
Open Access Journals
Article Tools
Article Usage
- Total views: 4083
- [From(publication date): 0-2017 - Dec 19, 2024]
- Breakdown by view type
- HTML page views: 3349
- PDF downloads: 734