Research Article Open Access
Study of the Microbial Health in and Around the Lower Stretch of Hooghly Estuary
Rahul Bose1*, Hare Krishna Jana2, Sufia Zaman1 and Abhijit Mitra11 Department of Marine Science, University of Calcutta, Kolkata 700019 and Department of Oceanography, Techno India University, Salt Lake Campus, Kolkata, India
2 Department of Microbiology, Vidyasagar University, Midnapore (West), India
- *Corresponding Author:
- Rahul Bose
Department of Marine Science
University of Calcutta, Kolkata 700019 and Department of Oceanography
Techno India University
Salt Lake Campus, Kolkata, India
Tel: 9831269550
E-mail: Boserahul.89@gmail.com
Received date November 03, 2013; Accepted date January 28, 2014; Published date February 02, 2014
Citation: Bose R (2014) Study of the Microbial Health in and Around the Lower Stretch of Hooghly Estuary. J Marine Sci Res Development S11:004. doi:10.4172/2155-9910.S11-004
Copyright: © 2014 Bose R. This is an open-access article distributed under the terms of the Creative Commons Attribution License, which permits unrestricted use, distribution, and reproduction in any medium, provided the original author and source are credited.
Visit for more related articles at Journal of Marine Science: Research & Development
Abstract
We investigated microbial load and few common hydrological parameters in the Hooghly Estuarine stretch of the Maritime State of West Bengal (India). The study site is located in the Lower Gangetic Delta and is the western part of the famous mangroves ecosystems of Indian Sundarbans. We observed significant spatial variations of all hydrological parameters (except surface water temperature) which are mainly due to the proximity of the stations to the Bay of Bengal. Significant spatial variations were also observed in the Total Bacterial Count (TBC), Fecal Coliform (FC) count, Total Coliform (TC) count, E. coli count, Streptococcus sp. count, which can be related to the type and magnitude of anthropogenic activities operating in and around the selected stations. A long term monitoring is required to understand the spatio-temporal variations of hydrological parameters and microbial load in the Lower Gangetic Delta as it sustains a unique genetic diversity in the Indian subcontinent
Introduction
Microorganisms such as bacteria, fungi, actinomycetes etc. are widely distributed in the water and sediment of marine and brackish water environments. They have far reaching effects on the biological as well as the geochemical systems. They also play an important role in the decompositions of organic matter, dissolution of inorganic insoluble salts and in the regeneration of nutrients. The activities of the total heterotrophic bacteria and the relative abundance reflect the hydrographic structure or the nature and nutrient concentrations in the aquatic environment [1].
The overloading of nutrients and organic load also provides a favorable environment for the growth and survival of a wide spectrum of microbial strains. The high population densities and activities often common in the coastal areas result in pollution and release of contaminated wastewater. Pathogenic microorganisms such as bacteria and viruses, abundant in human wastes are often discharged into natural waters with little or no treatment. Survival of microbes in waters depends on many parameters such as biological (interaction with other bacteria) and physical factors (temperature). Numerous studies have been carried out in coastal areas over long periods of time, demonstrating the various abiotic environmental conditions (fluxes, currents, presence of mud and silt etc.) due to which the distribution of microbes is affected. The under-treated effluents from the coastal population and discharges from Industrial belt regions often pose an adverse impact on marine and estuarine species. The members like Salmonella sp., E. coli, fecal coliform etc. can multiply and survive in the estuarine environment for weeks. The enterobacteriaceae (Salmonella, E. coli etc.) occur in the water as a result of contamination from the animal or human origin. This contamination has been normally associated with fecal contamination orpollution of natural waters or water environments, where these organisms survive for a long time (months) or through direct Contamination of products during processing. In the entire Gangetic Plain, it is the river Hugli that is subjected to heavy pollution load from the industrialized and highly urbanized cities of the Kolkata and Howrah. The discharges from the port-cum-industrial complex of Haldia have aggravated the magnitude of pollution. The marine ecosystem nearest to the city of Kolkata is the Indian Sundarbans, which is the most biologically productive, taxonomically diverse and aesthetically celebrated ecotone in the Indian subcontinent. The untreated and the under-treated sewage of the city of Kolkata and Howrah is responsible for the microbial load. Among microbial flora, the presence of pathogens such as Salmonella, Steptococcus sp., Vibrio sp., E. coli have been determined. It is thus clear that the present zone of investigation is under severe stress due to municipal discharge containing appreciable amount of sewage generated from municipal and several categories of anthropogenic microbial activities.
Aims and Objectives
The present study aims to evaluate the microbial load (total coliform and fecal coliform) in water sample in and around lower stretch of Hooghly river estuary. The area is stressed due to industrial and anthropogenic activities. Now-a-days bacterial indicators are measured instead of pathogenic organisms because the indicators are safer, and can be measured with faster, less expensive methods than the pathogen of concern.
The main objectives of the present study are highlighted at:
• To monitor monthly variation of physico-chemical variables during the study periods.
• To observe the spatial variation of the selected physico-chemical variables in the the study area.
• To scan the Microbiological parameters during three months of the study period.
• To monitor the spatial variation of the microbiological parameter in the study area.
Physiography
The ecological profile: The Indian Sundarbans Delta (ISD) is part of the delta of the Ganga-Brahmaputra-Meghna (GBM) basin in Asia. The Sundarbans shared between Indian and Bangladesh is home to one of the largest mangrove forest in the World. The ISD spread over about 9630 km2between 21°40’04” N and 22°09’21”N latitude, and 88°01’56” E and 89°06’01” E longitude, is the smaller and western part of the complete Sundarbans delta.
The Indian Sundarbans Delta is bounded by the Ichamati-Raimangal River in the east, by the Hooghli River in the west, by the Bay of Bengal in the South, and the Dampier-Hodges line drawn in 1829-1830 in the north. A little over half of this area has human settlements on 54 deltaic islands the remaining portion is under mangrove vegetation. Soils of ISD are principally Alfisols (older and alluvial soil) and Ardisols (coastal saline soil).
The landscape is characterized by a web of tidal water systems. The average tidal amplitude is between 3.5m to 5m, with the highest amplitudes in July-August and the lowest in December-January. Of the 8 rivers that dominate the landscape only the Hugli and Ichamati- Raimangal carry freshwater flow of some significance. Being the moribund part of the lower delta plain of the GBM system, the ISD is experiencing both declining freshwater supplies and net erosion, as has been recorded since 1969.
The Indian Sundarbans at the apex of the Bay of Bengal (between 21°13’N to 22°40’N latitude and 88°03’E to 89°07’E longitude) is located on the southern fringe of the state of West Bengal (a maritime state in the north-east coast of India). The area of the Indian Sundarbans is 9630 sq. Km. of which the forest area is about 4200 sq. Km.. The region is bordered by Bangladesh in the East, the Hooghly River (a continuation of the Ganges River) in the west, Dampier and Hodges Line in the North, and The Bay of Bengal in the south. With a considerable degree of maritime characteristics in major portion of the ecosystem, the important morphotypes of deltaic Sundarbans are beaches, mud flats, coastal dunes, sand flats, estuaries, creeks, inlets and mangrove swamps..
The rivers are the live matrix of deltaic complex, on which the unique spectrum of biological diversity is embedded. In Indian Sundarbans, approximately 2069 sq. Km. area is occupied by tidal river system or estuaries which finally end up in the Bay of Bengal. The deltaic complex of Indian Sundarbans is also noted for its seasonality in terms of climatic condition and wind action as highlighted here in brief. Frequent Nor-westersis also common in the premonsoon season.
Climate of Indian sundarbans
The deltaic lobe of Indian Sundarbans experiences a moderate type of climate because of its location adjacent to the Bay of Bengal as well as due to regular tidal flushing in the estuaries. Wave actions, micro and macro tidal cycles, long shore currents are recorded in most of the islands of the ecosystems. Coastal processes are very dynamic and are accelerated by tropical cyclones, which is locally called “Kal Baisakhi” (Nor-wester). The seasonal climate in study area may be conveniently categorized into pre-monsoon (March-June), monsoon (July- October) and post-monsoon (November-February). Each season has a characteristics feature of its own, which is very distinct and unique. The oscillations of various physico-chemical variables in different seasons of the year are discussed here in brief.
Wind: The direction and velocity of wind system in the coastal West Bengal are mainly controlled by the north-east and south-west monsoons. The wind from the north and north-east commences at the beginning of October and continues till the end of March. The month of January and February are relatively calm with an average wind speed around 3.5 km/hours. Violent wind speed recommences from the south-west around the middle of March and continues till September. During this period, several low pressure systems occur in this region, a number of which takes the form of depressions and cyclonic storms of varying intensity. The air temperature of Sundarbans area varies from 19.0°C to 34.0°C and velocity of wind from 0.85 to 4.54 m/sec.
Waves and tides: The wind is the basic driving force for generating surface waves in the coastal zone of West Bengal. Sea waves in this region rarely become destructive except during cyclonic storms. During Nor-westers the wind speed rises above 100 km/hr. and is usually accompanied by huge tidal waves. When the cyclonic incidences coincide with the spring tides, wave height can rise over 5m above the mean Sea level. Ripple waves appear in the month of October, November and December when wind generated wave height varies approximately between 0.20 to 0.35m. In the month of April to August, large wavelets are formed in the Shelf region and they start breaking when they approach towards the coastal margin. Wave height rises up to 2m during this period, which causes maximum scoring of land masses. The average tidal amplitude in the estuaries of the Sundarbans ranges from 3.5m to 4.0m. Wave actions, micro and macro tidal cycles and long shore currents are recorded in most of the Islands in this ecosystem.
Surface water temperature: In coastal West Bengal, the seasonal variation of surface water temperature is not so drastic between premonsoon and monsoon seasons. The pre-monsoon period (March to June) is characterized by a mean surface water temperature around 34°C. The monsoon period (July to October) show a surface water temperature around 32°C (mean) and the post-monsoon period (November to February) is characterized by cold weather with a mean surface water temperature around 23°C.
Rainfall: The average annual rainfall in deltaic Sundarbans region is 1920mm. Rainfall is usually maximum during the month of August/ September and the monsoon period lasts from July to October. The South-West wind triggers the precipitation in the monsoon period with an average rainfall of about 165mm. The post-monsoon (November to February) is characterized by negligible rainfall and the pre-monsoon period (March to June) is basically dry, but occasionally accompanied by rains and thunderstorms.
Materials and Methods
The present programmer encompasses the evaluation of microbial load (water) and some related physico-chemical variables such as
a) Surface water temperature
b) Surface water salinity
c) Surface water pH
d) Surface water Dissolved Oxygen (D.O.)
e) Surface water Nitrate (NO3-)
f) Surface water Phosphate (PO4 2-)
g) Surface water Silicate (SiO2)
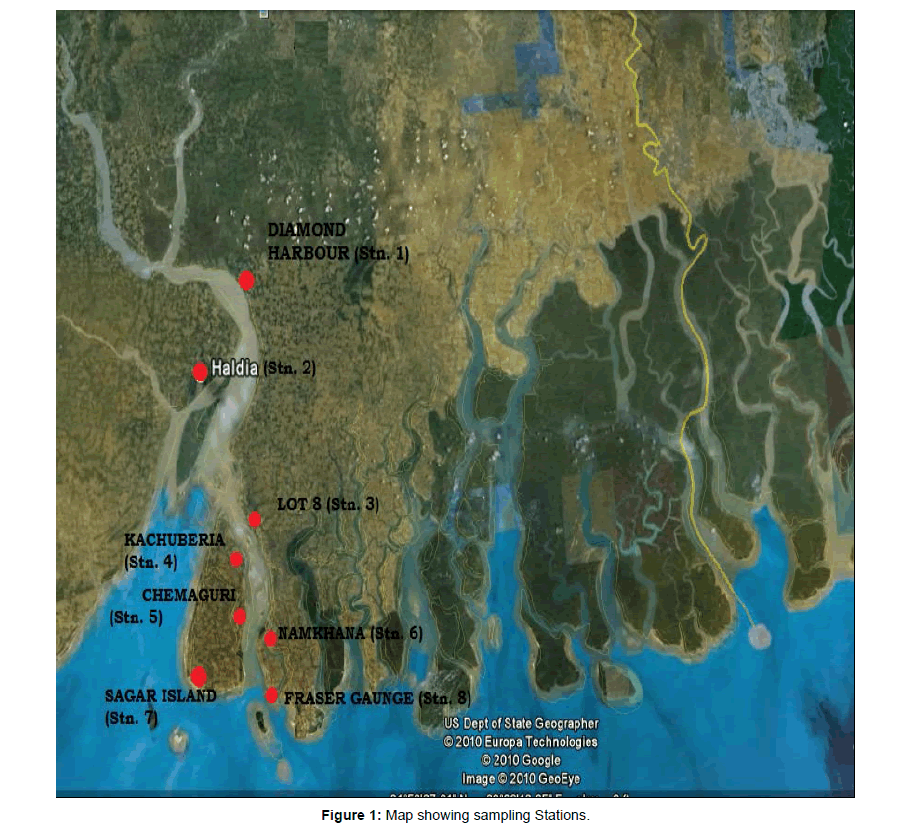
The work was carried out on a monthly basis from February, 2013 to April, 2013. Samplings have been carried out at eight different stations in Indian Sundarbans name:
1. Diamond Harbor
2. Haldia
3. Lot 8
4. Kachuberia
5. Chemaguri
6. Namkhana
7. Sagar Island
8. Frazergaunge
The entire work procedure has been divided into four procedural phase as mentioned below:
PHASE A: Site selection
PHASE B: Analysis of phsico-chemical variables of water
PHASE C: Analysis of microbial load (Total Bacterial Count, Total coliform, Fecal coliform, E. coli, Vibrio sp., Streptococcus sp., and Salmonella sp.) in ambient water media.
PHASE D: Statistical analysis.
PHASE A: Site selection
The first phase of the work involves selection of 8 sampling stations in the deltaic region of Sundarbans (Figure 1).
PHASE B: Analysis of physico-chemical variables of water
a) Surface water Temperature: The surface water temperature was measured using 0°C to 100°C mercury thermometer.
b) Surface water Salinity: The surfacewater salinity was recorded by means of an optical refractometer (Atago, Japan), and cross-checked in the laboratory by employing more Kundson method [2]. The correction factor was found out by titration of the Silver Nitrate (AgNO3) solution against standard sea water (IAPO Standard Sea water Service Charlottenlund, Slot Denmark, Chlorinity 19.376 ppt).
c) Surface water pH: The surface water pH was measured by using a portable pH-meter sensitivity=± 0.02
d) Surface water dissolved oxygen (D.O.): The surface water D.O. was measured by D.O. meter in the field and subsequently cross-checked in the laboratory by Winkler’s method.
e) Surface water nutrient analysis: Surface water was collected for Nutrient analysis in cleaned TARSON bottles and transported to the laboratory in iced freeze condition. Triplicate samples were collected from same collection sites to maintain the quality of the data. The standard spectrophotometric method of Strickland and Parsons [2], was adopted to determine the nutrient concentration in surface water.
f) Nitrate analysis: Nitrate was analyzed by oxidizing it to Nitrite by means of passing the sample with Ammonium Chloride buffer through a glass column packed with amalgamated cadnium- filings and finally treating the samples with sulphynyl amide. The resultant diazonium ion was coupled with N-(1 napthyl)-ethylene diamine to give an intensely pink azo dye.
g) Phosphate analysis: Determination of the Phosphate was carried out by treatment of an aliquot of the sample with an acidic Molybdate reagent containing Ascorbic acid and a small proportion of potassium antimony tartarate.
h) Silicate analysis: Dissolved silicate was determined by treating the sample with acidic molybdate reagent. The resultant Siliconmolybdic acid was reduced to molybdenum blue complex by ascorbic acid and incorporating the Oxalic acid to prevent the formation of similar blue complex phosphate.
PHASE C: Analysis of microbial load in ambient water
Sampling:
a sampling of the water: Water samples were collected fortnightly aseptically in sterilized glass container (sterilized in autoclave) with utmost care from the February, 2013 to April, 2013. The collected samples were immediately transferred in ice-box and brought to the laboratory for further analysis.
Preparation of culture media for the microbial analysis:
Preparation of the Lauryl Tryptose Broth(LTB) for presumptive test: In order to prepare the LTB, at first a dehydrated amount of ingredients for Single Strength (SS) and Double strength (DS) were required to dissolve separately in each 1 liter of sterilized distilled water and it was thoroughly mixed and slightly heated by proper swirling. The pH was adjusted up to 6.8 ± 0.2 by either 0.1(N) Sodium hydroxide (NaOH) or 0.1(N) Hydrochloric acid (HCl). After that it was distributed as required (10 ml SS and 10 ml DS). In test tube containing inverted Durham’s tube and then placed in the autoclave for sterilization at 121°C and 15 lbs. for 15 minutes. The general ingredients of the LTB are as following:
| Tryptose | 20 g |
| Lactose | 5 g |
| Dipotassium hydrogen phosphate | 2.75 g |
| Potassium dihydrogen phosphate | 2.75 g |
| Sodium chloride | 5g |
| Sodium Lauryl sulfate | 0.10 g |
| Sterilized distilled water | 1000 ml |
Preparation of Brilliant Green Lactose Bile Broth (BGLB) for confirmed test: At first required amount of the dehydrated ingredients were dissolved in 1 liter of sterilized distilled water which was thoroughly mixed and slightly heated by proper swirling and then pH was adjusted up to 7.2 ± 0.2 by either 0.1(N) Sodium hydroxide (NaOH) or 0.1(N) Hydrochloric acid (HCl). After that it was distributed in test tubes (10 ml each) containing inverted Durham’s tube and then placed in autoclave for sterilization at 121ºC and 15lbs for 15 minutes. The general ingredients of BGLB are as follows:
| Peptone | 10 g |
| Lactose | 10 g |
| Oxgall | 20 g |
| Brilliant Green | 0.133 g |
| Sterilized distilled water | 1000 ml |
Preparation of the collected water samples:
Preparation of the water samples: The collected water samples were mixed thoroughly before analysis.
Microbial analysis of the water samples: For microbial analysis in terms of Total Coliform Load, the Most Probable Number(MPN) procedure by Multiple Fermentation Techniques(MFT) stated in APHA [3]. The techniques involve inoculating the sample and/ or its several dilutions in a liquid medium of Lauryl Tryptose Broth (LTB) after completion of the incubation period, the tubes were examined for growth, acid and gas production by the Coliform organisms. This test is known as the presumptive test. Since the organisms other than Coliforms may also produce the reaction, the positive tubes from the presumptive test were subjected to a confirmatory test. The density of bacteria was calculated on the basis of positive and negative combination of the tubes. For water samples the results were expressed in MPN/100 ml [3].
Presumptive test for Total Coliform
Presumptive test for Total Coliform, Lauryl Tryptose Broth was used as culture media. For analysis of water 5 test tubes each of 10ml, 1ml, and 0.1ml. Sample portion was used as the presumptive test.
First set of containing 5 numbers of 10 ml (DS) broth tubes. Second and third sets containing 10 numbers of 10 ml (SS) broth tubes for analysis of water. Each tube in a set of five 10 ml, 1 ml, 0.1 ml of water sample were inoculated in the first, second and third sets of media tube respectively and mixed thoroughly. In each case a controlled set was run parallel. The inoculated test tubes were incubated at 36 ± 1ºC. After 24 ± 2 hours and the inoculated tubes were examined for growth of gas and acidic reaction. If there was no gas and acid reaction the tubes were re-examined and re-incubated at the end of 48 ± 2 hours. Within each tube, Durham’s tubes were inverted placed to show the bacterial growth with the emission of gas. Production of gas bubbles and acids with growth in the tubes within 48 ± 2 hours contributes presumptive reaction. After the incubation period of 48 hours the number of positive tubes were counted and preceded for confirmatory test.
Confirmatory Test for Total Coliform
For the Total coliform test culture media used was Brilliant Green Lactose Broth (BGLB). The positive presumptive tubes were gently shaken with a sterile sterile loop (3.5 mm-5 mm in diameter), 1 or 2 loopful of culture was transferred to a test tube containing BGLB with an inverted placed Durham’s tube. The inoculated BGLB tubes were incubated at 36 ± 1ºC. Formation of any gas with in 48 ± 2 hours constituted the confirmed test. The results were obtained in MPN/100 ml by comparing with the MPN table.
PHASE D: Statistical analysis
In order to find the differences between months and stations ANOVA was done using excel under Windows 2007.
Results
Marine and estuarine ecosystems are being threatened by the discharge of untreated sewage wastes and industrial effluents which ultimately affects the sustainability of living resources and public health.
Some microbial pathogens in the coastal environment are indigenous to the oceans, including Vibrios. Whereas others like Escherichia coli, Salmonella sp. and Shigella sp are allochthonous which introduced through agricultural, urban surface run-off, waste water discharges and from domestic and wild animals. Most of the Vibrios and Salmonella sp. are pathogenic to humans and some have fatal infections [4-7]. Infections with Vibrios are known to be associated with either consumption of sea food or exposure to marine environment [8]. The presence of fecal coliforms forms representative for the assessment of coastal recreational water quality. The present investigation highlights the occurrence distribution pattern of enteric pathogens in marine water. It also evaluates the influence of anthropogenic inputs and raw sewage on the incidence of these bacteria in and around Indian Sundarbans.
The microbial load is also influenced by physico-chemical variables like temperature, salinity, pH etc. The level of DO also fluctuates depending on the microbial load and action. The present dissertation was therefore undertaken to focus the spatio-temporal variations of physico-chemical and microbiological parameter as highlighted here:
Physico-chemical parameters
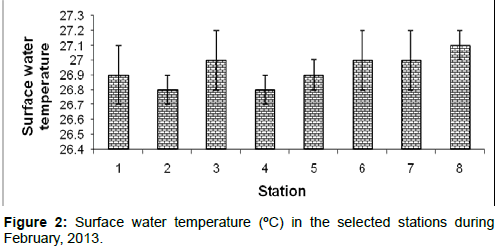
Surface water temperature: In February, 2013, the surface water temperature ranged from 26.8 ± 0.1ºC to 27.1 ± 0.1ºC during the study period. The station wise order of surface water temperature is Frasergaunge (Stn.8) > Sagar island (Stn.7)=Namkhana (Stn.6)=Lot 8 (Stn.3) > Chemaguri (Stn.5)=Diamond harbor (Stn.1) > Haldia (Stn.2)=Kachuberia (Stn.4) (Figure 2).
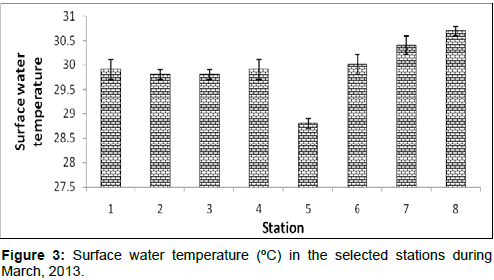
In March, 2013, the surface water temperature ranged from 28.8 ± 0.1ºC to 30.7 ± 0.1ºC during the study period. The station wise order of surface water temperature is Frasergaunge (Stn.8) > Sagar island (Stn.7) > Namkhana (Stn.6) > Kachuberia (Stn.4)=Diamond harbour (Stn.1) > Lot 8 (Stn.3) =Haldia (Stn.2) > Chemaguri (Stn.5) (Figure 3).
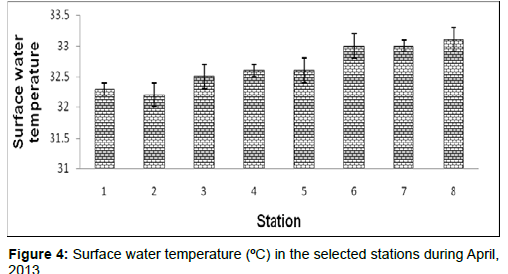
In April, 2013, the surface water temperature ranged from 32.2 ± 0.2 ºC to 33.1 ± 0.2ºC during the study period. The station wise order of surface water temperature is Frasergaunge (Stn.8) > Sagar island (Stn.7)=Namkhana (Stn.6) > Kachuberia (Stn.4)=Chemaguri (Stn.5) > Lot 8 (Stn.3) > Diamond harbour (Stn.1) > Haldia (Stn.2) (Figure 4).
Surface water salinity
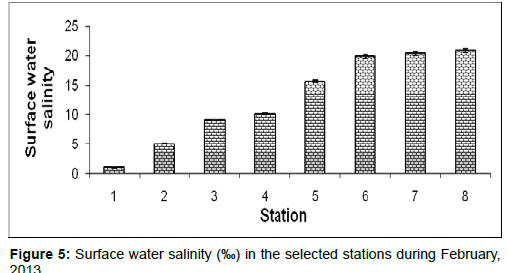
In February, 2013, the surface water salinity ranged from 1.05 ± 0.05 psu to 20.89 ± 0.34 psu during the study period. The station wise order of surface water salinity is Frasergaunge (Stn.8) > Sagar island (Stn.7) > Namkhana (Stn.6) > Chemaguri (Stn.5) > Kachuberia (Stn.4) > Lot 8 (Stn.3) > Haldia (Stn.2) > Diamond harbour (Stn.1) (Figure 5).
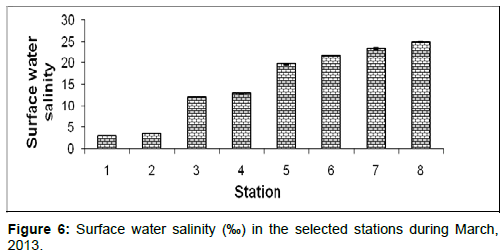
In March, 2013, the surface water salinity ranged from 2.89 ± 0.05 psu to 24.89 ± 0.20 psu during the study period. The station wise order of surface water salinity is Frasergaunge (Stn.8) > Sagar island (Stn.7) > Namkhana (Stn.6) > Chemaguri (Stn.5) > Kachuberia (Stn.4) > Lot 8 (Stn.3) > Haldia (Stn.2) > Diamond harbour (Stn.1) (Figure 6).
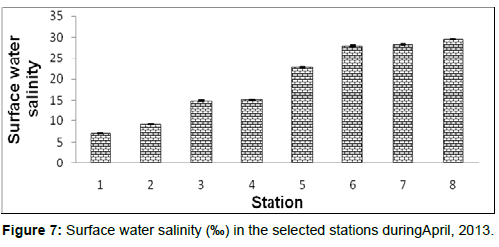
In April, 2013, the surface water salinity ranged from 7.12 ± 0.08 psu to 29.55 ± 0.05 psu during the study period. The station wise order of surface water salinity is Frasergaunge (Stn.8) > Sagar island (Stn.7) > Namkhana (Stn.6) > Chemaguri (Stn.5) > Kachuberia (Stn.4) > Lot 8 (Stn.3) > Haldia (Stn.2) > Diamond harbour (Stn.1) (Figure 7).
Surface water pH
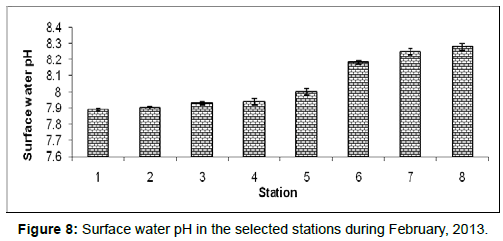
In February, 2013, the surface water pH ranged from 7.89 ± 0.01 to 8.28 ± 0.02 during the study period. The station wise order of surface water pH is Frasergaunge (Stn.8) > Sagar island (Stn.7) > Namkhana (Stn.6) > Chemaguri (Stn.5) > Kachuberia (Stn.4) > Lot 8 (Stn.3) > Haldia (Stn.2) > Diamond harbour (Stn.1) (Figure 8).
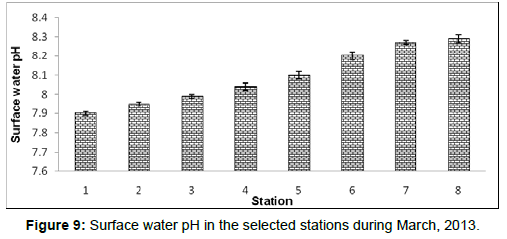
In March, 2013, the surface water pH ranged from 7.90 ± 0.01 to 8.29 ± 0.02 during the study period. The station wise order of surface water pH is Frasergaunge (Stn.8) > Sagar island (Stn.7) > Namkhana (Stn.6) > Chemaguri (Stn.5) > Kachuberia (Stn.4) > Lot 8 (Stn.3) > Haldia (Stn.2) > Diamond harbour (Stn.1) (Figure 9).
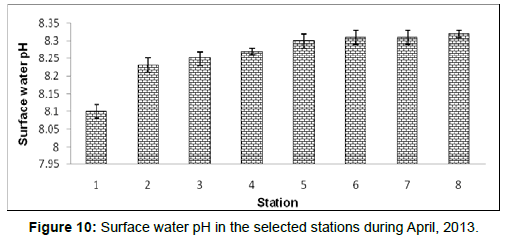
In April, 2013, the surface water pH ranged from 8.10 ± 0.02 to 8.32 ± 0.01 during the study period. The station wise order of surface water pH is Frasergaunge (Stn.8) > Sagar island (Stn.7)=Namkhana
(Stn.6) > Chemaguri (Stn.5) > Kachuberia (Stn.4) > Lot 8 (Stn.3) > Haldia (Stn.2) > Diamond harbour (Stn.1) (Figure 10).
Surface water dissolved oxygen (D.O.)
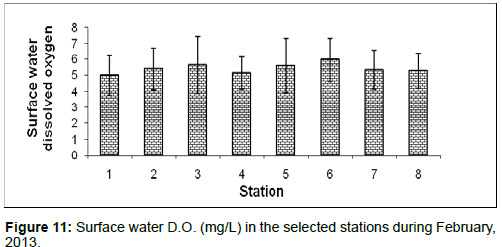
In February, 2013, the surface water dissolved oxygen ranged from 4.99 ± 1.23 (mg/L) to 5.98 ± 1.35 (mg/L) during the study period. The station wise order of surface water D.O. is Namkhana (Stn.6) > Lot 8 (Stn.3) > Chemaguri (Stn.5) > Haldia (Stn.2) > Sagar island (Stn.7) > Frasergaunge (Stn.8) > Kachuberia (Stn.4) > Diamond harbour (Stn.1) (Figure 11).
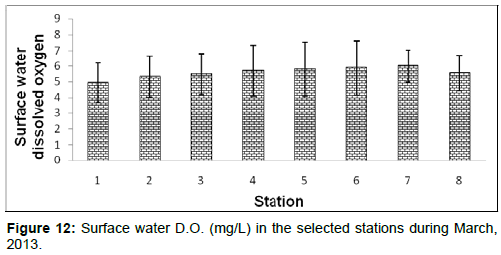
In March, 2013, the surface water dissolved oxygen ranged from 4.93 ± 1.23 (mg/L) to 6.02 ± 1.03 (mg/L) during the study period. The station wise order of surface water D.O. is Sagar island (Stn.7) > Namkhana (Stn.6) > Chemaguri (Stn.5) > Kachuberia (Stn.4) > Frasergaunge (Stn.8) > Lot 8 (Stn.3) > Haldia (Stn.2) > Diamond harbour (Stn.1) (Figure 12)
In April, 2013, the surface water dissolved oxygen ranged from 4.88 ± 1.33 (mg/L) to 5.45 ± 1.13 (mg/L) during the study period. The station wise order of surface water D.O. is Chemaguri (Stn.5) > Namkhana (Stn.6) > Kachuberia (Stn.4) > Frasergaunge (Stn.8) > Haldia (Stn.2) > Lot 8 (Stn.3) > Diamond harbour (Stn.1) > Sagar island (Stn.7) (Figure 13).
Surface water nitrate
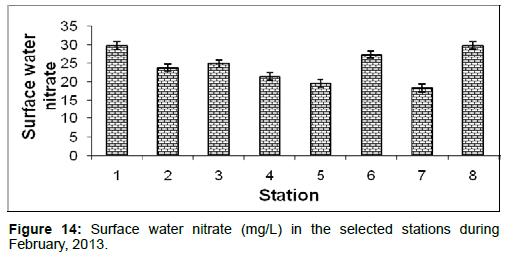
In February, 2013, the surface water nitrate ranged from 18.32 ± 1.04 (mg/L) to 29.88 ± 1.31 (mg/L) during the study period. The station wise order of surface water nitrate is Frasergaunge (Stn.8) > Diamond harbour (Stn.1) > Namkhana (Stn.6) > Lot 8 (Stn.3) > Haldia (Stn.2) > Kachuberia (Stn.4) > Chemaguri (Stn.5) > Sagar island (Stn.7) (Figure 14).
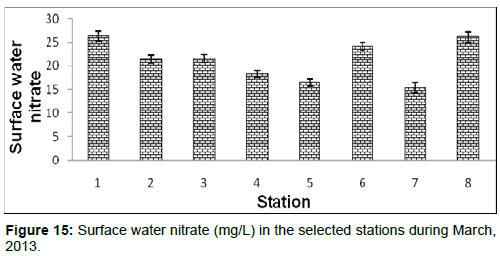
In March, 2013, the surface water nitrate ranged from 15.30 ± 0.76 (mg/L) to 26.33±1.04 (mg/L) during the study period. The station wise order of surface water nitrate is Diamond harbour (Stn.1) > Frasergaunge (Stn.8) > Namkhana (Stn.6) > Lot 8 (Stn.3) > Haldia (Stn.2) > Kachuberia (Stn.4) > Chemaguri (Stn.5) > Sagar island (Stn.7) (Figure 15).
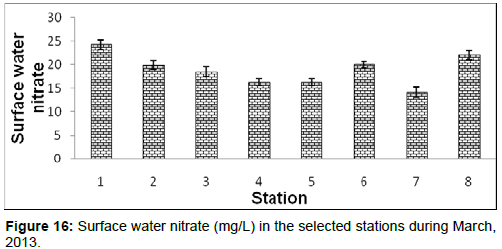
In April, 2013, the surface water nitrate ranged from 14.21 ± 0.76 (mg/L) to 24.33 ± 1.01 (mg/L) during the study period. The station wise order of surface water nitrate is Diamond harbour (Stn.1) > Frasergaunge (Stn.8) > Namkhana (Stn.6) > Haldia (Stn.2) > Lot 8 (Stn.3) > Chemaguri (Stn.5) > Kachuberia (Stn.4) > Sagar island (Stn.7) (Figure 16).
Surface water phosphate
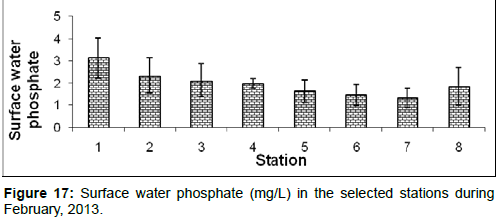
In February, 2013, the surface water phosphate ranged from 1.32 ± 0.49 (mg/L) to 3.14 ± 0.91 (mg/L) during the study period. The station wise order of surface water phosphate is Diamond harbour (Stn.1) Haldia (Stn.2) > Lot 8 (Stn.3) > Kachuberia (Stn.4) > Frasergaunge (Stn.8) > Chemaguri (Stn.5) > Namkhana (Stn.6) > Sagar island (Stn.7) (Figure 17).
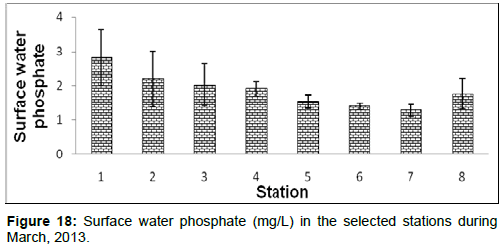
In March, 2013, the surface water phosphate ranged from 1.29 ± 0.10 (mg/L) to 2.83 ± 0.81 (mg/L) during the study period. The station wise order of surface water phosphate is Diamond harbour (Stn.1) > Haldia (Stn.2) > Lot 8 (Stn.3) > Kachuberia (Stn.4) > Frasergaunge (Stn.8) > Chemaguri (Stn.5) > Namkhana (Stn.6) > Sagar island (Stn.7) (Figure 18).
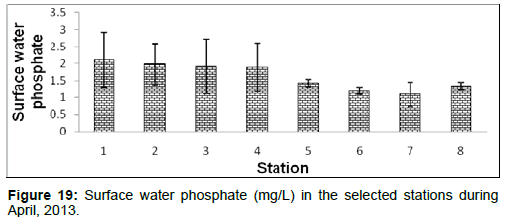
In April, 2013, the surface water phosphate ranged from 1.09 ± 0.11 (mg/L) to 2.11 ± 0.81 (mg/L) during the study period. The station wise order of surface water phosphate is Diamond harbour (Stn.1) > Haldia (Stn.2) > Lot 8 (Stn.3) > Kachuberia (Stn.4) > Chemaguri (Stn.5) > Frasergaunge (Stn.8) > Namkhana (Stn.6) > Sagar island (Stn.7) (Figure 19).
Surface water silicate
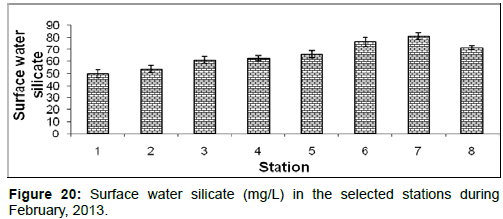
In February, 2013, the surface water silicate ranged from 49.84 ± 3.42 (mg/L) to 81.22 ± 3.93 (mg/L) during the study period. The station wise order of surface water silicate is Sagar island (Stn.7) > Namkhana (Stn.6) > Frasergaunge (Stn.8) > Chemaguri (Stn.5) > Kachuberia (Stn.4) > Lot 8 (Stn.3) > Haldia (Stn.2) > Diamond harbour (Stn.1) (Figure 20).
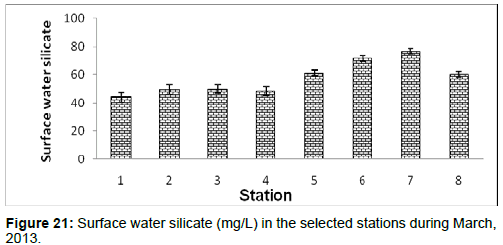
In March, 2013, the surface water silicate ranged from 44.32 ± 3.42 (mg/L) to 76.57 ± 1.99 (mg/L) during the study period. The station wise order of surface water silicate is Sagar island (Stn.7) > Namkhana (Stn.6) > Chemaguri (Stn.5) > Frasergaunge (Stn.8) > Lot 8 (Stn.3) > Haldia (Stn.2) > Kachuberia (Stn.4) > Diamond harbour (Stn.1) (Figure 21).
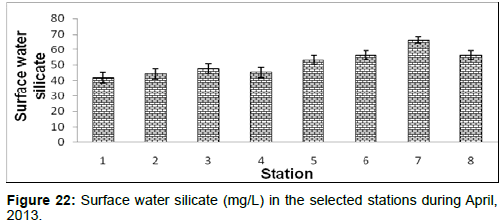
In April, 2013, the surface water silicate ranged from 41.90 ± 3.42 (mg/L) to 66.44 ± 2.05 (mg/L) during the study period. The station wise order of surface water silicate is Sagar island (Stn.7) > Frasergaunge (Stn.8) > Namkhana (Stn.6) > Chemaguri (Stn.5) > Lot 8 (Stn.3) > Kachuberia (Stn.4) > Haldia (Stn.2) >Diamond harbour (Stn.1) (Figure 22).
Microbial load
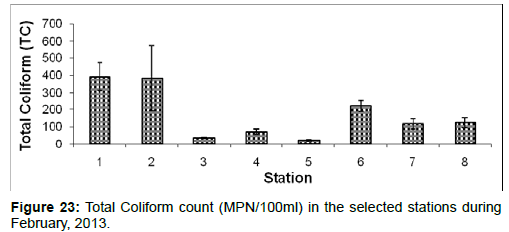
5.8.1 Total coliform: In February, 2013, the Total Coliform count ranged from 22 ± 4 (MPN/100ml) to 391 ± 80 (MPN/100ml) during the study period. The station wise order of Total Coliform count is Diamond harbour (Stn.1) > Haldia (Stn.2) > Namkhana (Stn.6) > Frasergaunge (Stn.8) > Sagar island (Stn.7) > Kachuberia (Stn.4) > Lot 8 (Stn.3) > Chemaguri (Stn.5) (Figure 23).
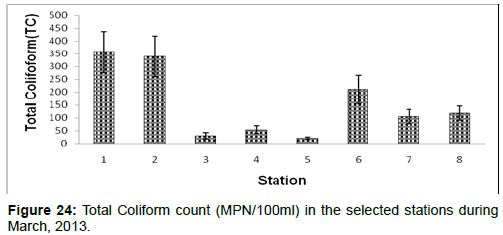
In March, 2013, the Total Coliform count ranged from 20 ± 5 (MPN/100ml) to 356 ± 80 (MPN/100ml) during the study period. The station wise order of Total Coliform count is Diamond harbour (Stn.1) > Haldia (Stn.2) > Namkhana (Stn.6) > Frasergaunge (Stn.8) > Sagar island (Stn.7) > Kachuberia (Stn.4) > Lot 8 (Stn.3) > Chemaguri (Stn.5) (Figure 24).
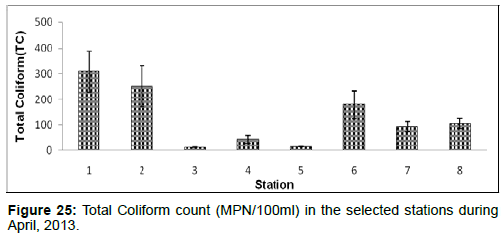
In April, 2013, the Total Coliform count ranged from 12 ± 1 (MPN/100ml) to 309 ± 80 (MPN/100ml) during the study period. The station wise order of Total Coliform count is Diamond harbour (Stn.1) > Haldia (Stn.2) > Namkhana (Stn.6) > Frasergaunge (Stn.8) > Sagar island (Stn.7) > Kachuberia (Stn.4) > Chemaguri (Stn.5) > Lot 8 (Stn.3) (Figure 25).
Faecal coliform (FC)
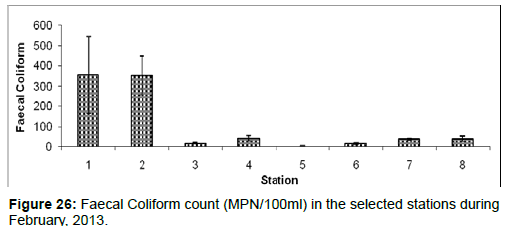
In February, 2013, the Faecal Coliform count ranged from 2 ± 1 (MPN/100ml) to 354 ± 190 (MPN/100ml) during the study period. The station wise order of Faecal Coliform count is Diamond harbour (Stn.1) > Haldia (Stn.2) > Kachuberia (Stn.4) > Frasergaunge (Stn.8) > Sagar island (Stn.7) > Lot 8 (Stn.3) > Namkhana (Stn.6) > Chemaguri (Stn.5) (Figure 26).
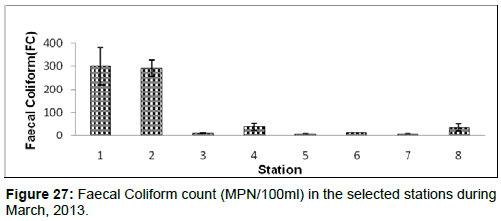
In March, 2013, the Faecal Coliform count ranged from 10 ± 1 (MPN/100ml) to 300 ± 80 (MPN/100 ml) during the study period. The station wise order of Faecal Coliform count is Diamond harbour (Stn.1) > Haldia (Stn.2) > Kachuberia (Stn.4) > Frasergaunge (Stn.8) > Namkhana (Stn.6) > Lot 8 (Stn.3) > Chemaguri (Stn.5)=Sagar Island (Stn.7) (Figure 27).
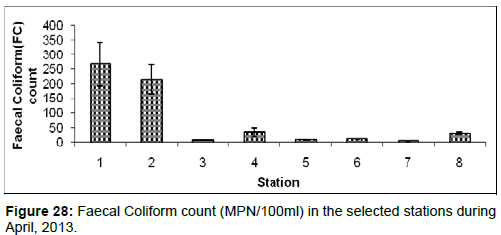
In April, 2013, the Faecal Coliform count ranged from 5 ± 1 (MPN/100ml) to 267 ± 75 (MPN/100ml) during the study period. The station wise order of Faecal Coliform count is Diamond harbour (Stn.1) > Haldia (Stn.2) > Kachuberia (Stn.4) > Frasergaunge (Stn.8) > Namkhana (Stn.6) > Lot 8 (Stn.3) > Chemaguri (Stn.5) > Sagar Island (Stn.7) (Figure 28).
Total bacterial count (TBC)
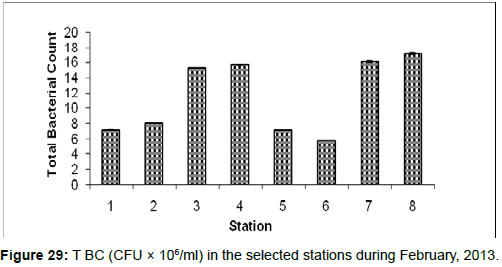
In February, 2013, the Total Bacterial count ranged from 5.76 ± 0.01 (CFU × 106/ml) to 17.11 ± 0.12 (CFU × 106/ml) during the study period. The station wise order of TBC is Frasergaunge (Stn.8) > Sagar island (Stn.7) > Kachuberia (Stn.4) > Lot 8 (Stn.3) > Haldia (Stn.2) > Diamond harbour (Stn.1) > Chemaguri (Stn.5) > Namkhana (Stn.6) (Figure 29).
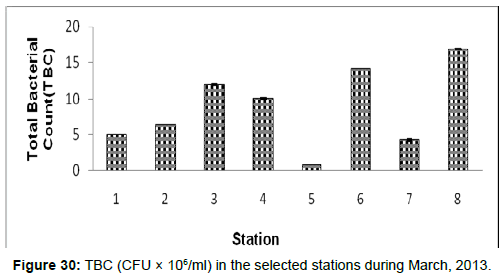
In March, 2013, the Total Bacterial count ranged from 0.68 ± 0.01 (CFU × 106/ml) to 16.94 ± 0.02 (CFU × 106/ml) during the study period. The station wise order of TBC is Frasergaunge (Stn.8) > Namkhana (Stn.6) > Lot 8 (Stn.3) > Kachuberia (Stn.4) > Haldia (Stn.2) > Diamond harbour (Stn.1) > Sagar Island (Stn.7) > Chemaguri (Stn.5) (Figure 30).
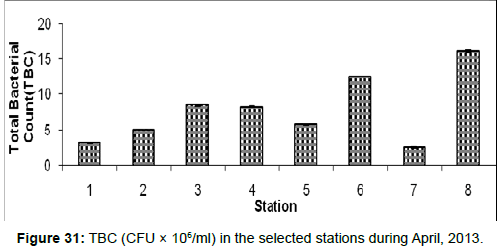
In April, 2013, the Total Bacterial count ranged from 2.50 ± 0.01 (CFU × 106/ml) to 16.00±0.15 (CFU × 106/ml) during the study period. The station wise order of TBC is Frasergaunge (Stn.8) > Namkhana (Stn.6) > Lot 8 (Stn.3) > Kachuberia (Stn.4) > Chemaguri (Stn.5) > Haldia (Stn.2) > Diamond harbour (Stn.1) > Sagar Island (Stn.7) (Figure 31).
E. coli count
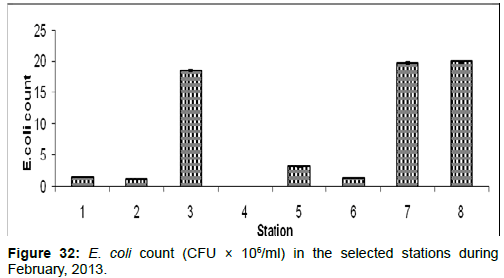
In February 2013, the E. coli count ranged from 0.01 ± 0.001 (CFU × 106/ml) to 19.89±0.12 (CFU × 106/ml) during the study period. The station wise order of E. coli count is Frasergaunge (Stn.8) > Sagar island (Stn.7) > Lot 8 (Stn.3) > Chemaguri (Stn.5) > Diamond harbour (Stn.1) > Namkhana (Stn.6) > Haldia (Stn.2) > Kachuberia (Stn.4) (Figure 32).
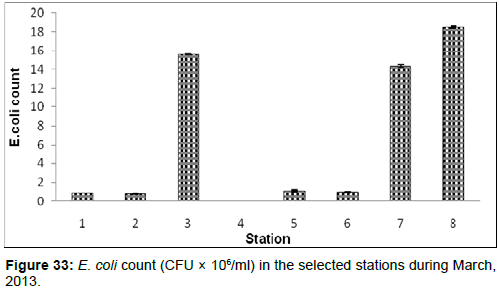
In March, 2013, the E. coli count ranged from 0.002 ± 0.001 (CFU × 106/ml) to 18.55±0.12 (CFU × 106/ml) during the study period. The station wise order of E. coli count is Frasergaunge (Stn.8) > Lot 8 (Stn.3) > Namkhana (Stn.6) > Chemaguri (Stn.5) > Sagar Island (Stn.7) > Diamond harbour (Stn.1) > Haldia (Stn.2) > Kachuberia (Stn.4) (Figure 33).
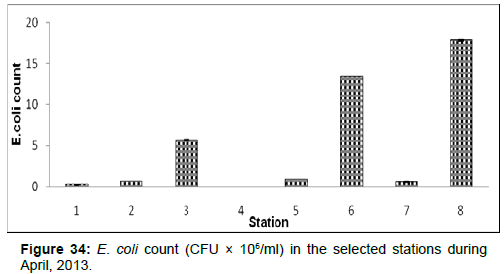
In April, 2013, the E.coli count ranged from 0.01 ± 0.001 (CFU × 106/ ml) to 17.89±0.05 (CFU × 106/ml) during the study period. The station wise order of E.coli count is Frasergaunge (Stn.8) > Namkhana (Stn.6) > Lot 8 (Stn.3) > Chemaguri (Stn.5) > Haldia (Stn.2) > Sagar Island (Stn.7) > Diamond harbour (Stn.1) > Kachuberia (Stn.4) (Figure 34).
Vibrio sp. count
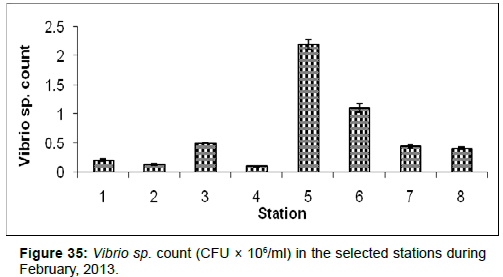
In February, 2013, the Vibrio sp. Count ranged from 0.10 ± 0.01 (CFU × 106/ml) to 2.20±0.09 (CFU × 106/ml) during the study period. The station wise order of Vibrio sp. Count is Chemaguri (Stn.5) > Sagar Island (Stn.6) > Lot 8 (Stn.3) > Namkhana (Stn.7) > Frasergaunge (Stn.8) > Haldia (Stn.1) > Diamond Harbour (Stn.2) > Kachuberia (Stn.4) (Figure 35).
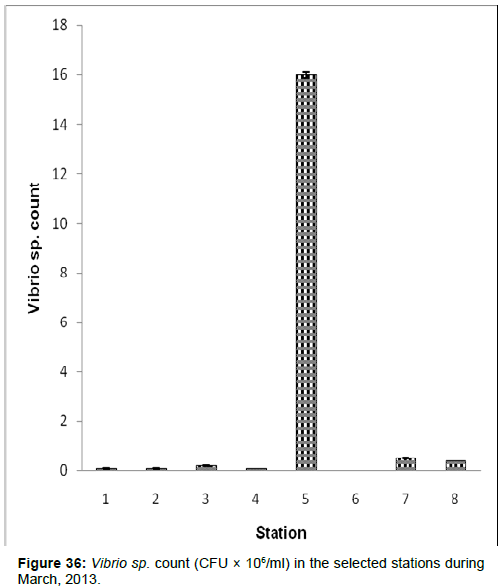
In March, 2013, the Vibrio sp. count ranged from 0.00 (CFU × 106/ ml) to 16.0 ± 0.11 (CFU × 106/ml) during the study period. The station wise order of Vibrio sp. Count is Chemaguri (Stn.5) > Namkhana (Stn.7) > Frasergaunge (Stn.8) > Lot 8 (Stn.3) > Haldia (stn1) > Diamond Harbour (Stn.2) > Kachuberia (Stn.4) > Sagar Island (Stn.6) (Figure 36).
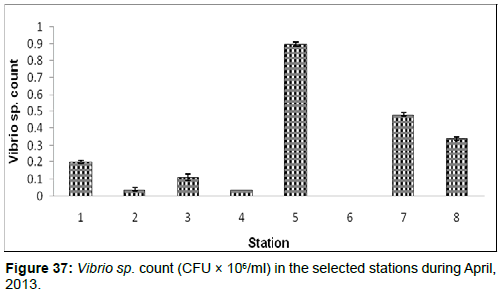
In April, 2013, the Vibrio sp. Count ranged from 0.00 (CFU × 106/ ml) to 0.90±0.01 (CFU × 106/ml) during the study period. The station wise order of Vibrio sp. Count is Chemaguri (Stn.5) > Namkhana (Stn.7) > Frasergaunge (Stn.8) > Haldia (stn1) > Lot 8 (Stn.3) > Diamond Harbour (Stn.2)=Kachuberia (Stn.4) > Sagar Island (Stn.6) (Figure 37)
Streptococcus sp. count
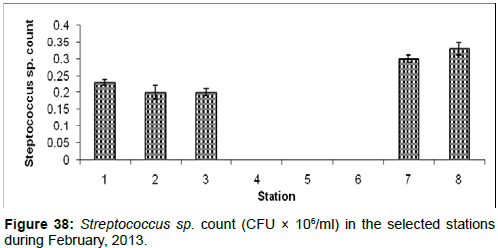
In February, 2013, the Streptococcus sp. Count ranged from 0.00 (CFU × 106/ml) to 0.33 ± 0.02 (CFU × 106/ml) during the study period. The station wise order of Streptococcus sp. Count is Frasergaunge (Stn.8) > Namkhana (Stn.7) > Haldia (stn1) > Diamond Harbour (Stn.2)=Lot 8 (Stn.3) > Kachuberia (Stn.4)=Chemaguri (Stn.5)=Sagar Island (Stn.6) (Figure 38).
In March, 2013, the Streptococcus sp. Count ranged from 0.00 (CFU × 106/ml) to 0.30±0.01 (CFU × 106/ml) during the study period. The station wise order of Streptococcus sp. Count is Frasergaunge (Stn.8) > Haldia (stn1) > Namkhana (Stn.7) > Diamond Harbor (Stn.2) > Lot 8 (Stn.3) > Kachuber ia (Stn.4)=Chemaguri (Stn.5)=Sagar Island (Stn.6) (Figure 39).
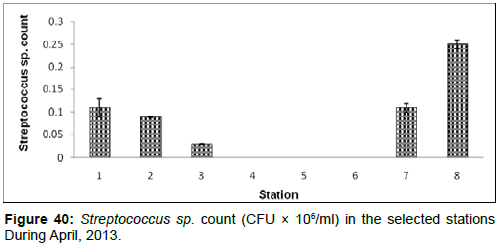
In April, 2013, the Streptococcus sp. count ranged from 0.00 (CFU × 106/ml) to 0.30±0.01 (CFU × 106/ml) during the study period. The station wise order of Streptococcus sp. Count is Frasergaunge (Stn.8) > Namkhana (Stn.7)=Haldia (stn1) > Diamond Harbour (Stn.2) > Lot 8 (Stn.3) > Kachuberia (Stn.4)=Chemaguri (Stn.5)=Sagar Island (Stn.6) (Figure 40).
Salmonella sp. count
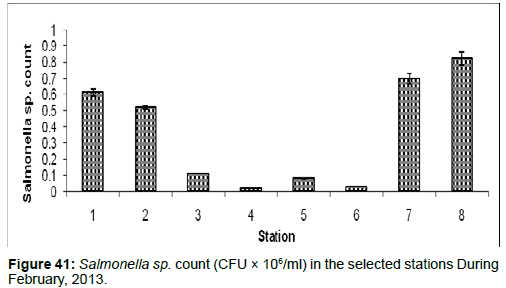
In February, 2013, the Salmonella sp. Count ranged from 0.02 ± 0.001 (CFU × 106/ml) to 0.82 ± 0.04 (CFU × 106/ml) during the study period. The station wise order of Salmonella sp. Count is Frasergaunge (Stn.8) > Namkhanam (Stn.7) > Haldia (stn.1) > Diamond Harbour (Stn.2) > Lot 8 (Stn.3) > Chemaguri (Stn.5) > Sagar Island (Stn.6) > Kachuberia (Stn.4) (Figure 41).
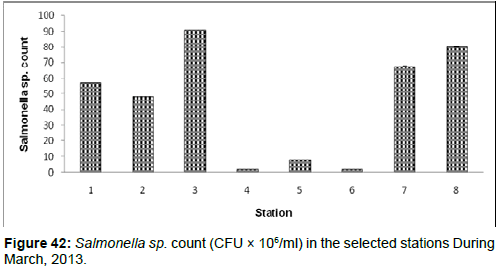
In March, 2013, the Salmonella sp. count ranged from 1.65 ± 0.01 (CFU × 106/ml) to 90.8 ± 0.03 (CFU × 106/ml) during the study period. The station wise order of Salmonella sp. Count is Lot 8 (Stn.3) > Frasergaunge (Stn.8) > Namkhana (Stn.7) > Haldia (stn1) > Diamond Harbour (Stn.2) > Chemaguri (Stn.5) > Sagar Island (Stn.6) > Kachuberia (Stn.4) (Figure 42).
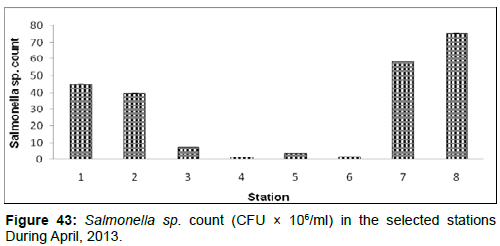
In April, 2013, the Salmonella sp. Count ranged from 1.25 ± 0.01 (CFU × 106/ml) to 75.40 ± 0.13 (CFU × 106/ml) during the study period. The station wise order of Salmonella sp. Count is Frasergaunge (Stn.8) > Namkhana (Stn.7) > Haldia (stn1) > Diamond Harbour (Stn.2) > Lot 8 (Stn.3) > Chemaguri (Stn.5) > Sagar Island (Stn.6) > Kachuberia (Stn.4) (Figure 43).
Discussion
Microbiological water quality investigations of lotic and lentic ecosystems are very rare, despite their importance in accompanying the role of large water bodies for cases of recreation, tourism and aquaculture. An attempt to adequately monitor scientific data in large scale river bodies is a priority to some organizations in Europe as stipulated by Kirschner et al. [9]. This microbiological data in the Sundarban estuary gives a strong signal to the environmental community to embark on the creation of water treatment facilities in order to prevent the transmission of communicable diseases by population that explore its water, as total and faecal pollution is a crucial problem affecting most urban water systems [10].
The monthly values are very important with values reaching 391 ± 80 (MPN/100 ml) in February at Haldia (Stn.1) for total coliforms. These pathogens will keep on accumulating in the open system [11]. The values obtained could be spatio-temporarily linked to the number of visitors in this ecosystem and also the role played by point and nonpoint sources in the bio contamination of aquatic ecosystem [12,13]. These pathogens could be free living, particle associated or in an intermediary state, depending on the organic and inorganic condition of the medium as stipulated in the findings of Basemer et al. [14]
Rainfall- Storm water run-off is a significant source of pollutants to the river, which can include bacteria, viruses and sediment, to which the substrate pollutants attached as indicated by Mallin et al. [15]. Storm rainfall characteristics and conditions prior to the storms are significant factors in the transport and concentrations of pollutants in the river. Stream flow-River flow is the primary transport media of faecal coliform bacteria [16].
Among the diseases associated with poor microbial water quality, those causing dehydrating diarrhea are of critical importance as they could lead to death within 48 hrs after the initial symptoms as analyzed in the findings of Manja et al. [17]. These extreme cases are more predominant in countries where overcrowding and poor sanitary conditions are the norm [18]. The presence of faecal coliforms indicates the contamination of water with faecal waste that may contain other harmful or disease-causing microorganisms, including bacteria, viruses, protozoa or other infectious agents [19]. Drinking water contaminated with these organisms can cause stomach and intestinal illness including diarrhea and nausea.
The Hooghly estuary is the lifeline of the highly urbanized city of Kolkata and supports industry of crucial economic importance. The surrounding area is a complex mixture of commercial, industrial, agricultural, and residential development. The watershed provides important services for drinking water, wildlife habitat, recreation (swimming, fishing, boating), pilgrimage and transportation. The mixed use of the watershed results in a complex pattern of waste and pollutant input that alter ecosystem health. Microbes play an important role in determining water quality (nutrient concentration, clarity, oxygen levels, pathogen load) by controlling the internal transformations but their activity is modulated by the systems variable environmental conditions.
The present dissertation focuses the following points:
• There is an increasing trend in surface water temperature, salinity, pH and silicates while approaching from upstream to downstream region. This may be because of the effects of the tidal action from Bay of Bengal. The surface water dissolved oxygen concentration; nitrate and phosphate did not show any general spatial trend. The anthropogenic activities basically control the concentration of dissolved oxygen, nitrate and phosphate through sewage and other waste disposal. Haldia (Stn. 2), Namkhana (Stn. 7), Frasergaunj (Stn.8) sustain port, industries, hotels and tourism units and fish landing stations. These point sources generate wastes of complex characters due to which the nitrates and phosphates exhibited comparatively higher values in these stations.
• ANOVA revealed significant monthly variations (p < 0.01) in surface water temperature, salinity, pH, dissolved oxygen, nitrate, phosphate and silicate. However, the statistical difference is not significant between stations in case of surface water temperature as Fcal (2.71) is less than Fcrit (2.76) in case of other physico-chemical variables like surface water salinity, pH, D.O., nitrate, phosphate and silicate; significant differences between stations were observed (Table 2).
| Station No. | Name of the Station | Co-ordinates |
|---|---|---|
| Stn.1 | Diamond Harbour | 22°11’04.2”N / 88°11’22.2”E |
| Stn.2 | Haldia | 22º1’31”N / 88º3’29”E |
| Stn.3 | Lot 8 | 21°53’25.6”N / 88°09’58.4”E |
| Stn.4 | Kachuberia | 2152'26.50"N / 8808'04.43"E |
| Stn.5 | Chemaguri | 2139' 58.15"N / 8810' 07.03"E |
| Stn.6 | Namkhana | 21º76’N / 88º23’E |
| Stn.7 | Sagar Island | 21°38' 54.37”N / 88°03' 06.17”E |
| Stn.8 | Frasergaunge | 21°36'55.72''N / 88°12'33.15''E |
Table 1: The table showing station no with names to find co-ordinates
| Variables | Fcal | Fcrit |
|---|---|---|
| Surface water temperature Between stations Between months |
2.71 719.21 |
2.76 3.74 |
| Surface water salinity Between stations Between months |
169.15 72.29 |
2.76 3.74 |
| Surface water pH Between stations Between months |
10.39 23.61 |
2.76 3.74 |
| Surface water dissolved oxygen Between stations Between months |
3.75 9.68 |
2.76 3.74 |
| Surface water nitrate Between stations Between months |
56.75 70.48 |
2.76 3.74 |
| Surface water phosphate Between stations Between months |
28.34 11.09 |
2.76 3.74 |
| Surface water silicate Between stations Between months |
21.57 28.33 |
2.76 3.74 |
Table 2: ANOVA: (for physico-chemical parameters).
Showing variation of hydrological parameters between stations and months
• ANOVA revealed significant monthly variations (p < 0.01) in total coliform count, faecal coliform count, total bacterial count, E. coli count, Vibrio sp. count, Streptococcus sp. count and Salmonella sp. count (exceptions are observed in case of E. coli count and Vibrio sp. count). However, the statistical difference is not significant between stations in case of Vibrio sp. countas Fcal (1.58) is less than Fcrit (2.76). In case of Salmonella sp. Count, the statistical difference between stations is also not significant as Fcal (2.47) is lower than Fcrit (2.76) (Table 3).
| Variables | Fcal | Fcrit |
|---|---|---|
| Total Coliform(TC) count Between stations Between months |
105.62 8.06 |
2.76 3.74 |
| Faecal Coliform(FC) count Between stations Between months |
77.94 3.83 |
2.76 3.74 |
| Total Bacterial Count(TBC) Between stations Between months |
25.69 11.41 |
2.76 3.74 |
| E. coli count Between stations Between months |
33.28 3.47 |
2.76 3.74 |
| Vibrio sp.count Between stations Between months |
1.58 0.91 |
2.76 3.74 |
| Streptococcus sp.count Between stations Between months |
21.13 8.72 |
2.76 3.74 |
| Salmonella sp.count Between stations Between months |
2.47 8.28 |
2.76 3.74 |
Table 3: ANOVA: (for microbial parameters). Showing variation of microbial load between stations and months.
Conclusion
It is very difficult to come to a solid conclusion with a meagre data of three months. A long term study is required (at least 2years) to monitor the seasonal effects of physico-chemical parameters.
With these snapshot of three months it is very clear that the unplanned urbanization, tourism units, agricultural activities are mainly responsible for deterioration of water quality along the Hooghly estuary streches. It is interesting to note that the salinity, pH and silicate level increases from upstream to downstream that is from Haldia to Frasergaunge. This is exclusively the marine effect of Bay of Bengal. However the microbial parameters in some stations like Haldia (Stn.2), Diamond Harbour (Stn.1), Namkhana (Stn.7), Frasergaunge (Stn.8) increase abruptly because of release of untreated waste from hotels, fish landing stations and market places. These activities have not only increase the Coliform load in the water bodies but also pathogenic strain such as Salmonella sp, vibrio sp., have also been observed in Stations like Chemaguri (Stn.5), Namkhana (Stn.7),Frasergaunge (Stn.8)where shrimp culture (Penaeus monodon) activities is a major issue. Over stocking of tiger prawn feed and periodic release of the waste water in the surrounding estuarine is also one of the important reasons for enhanced microbial load in these stations.
Continuous monitoring of the system and strict regulation by State Pollution control Board (SPCB) and
Central Pollution control Board (CPCB) is essential to restore the ecological health of the system.
References
- Carl Oppenheimer, Ferguson Wood EJ (1962) Note on the effect of contamination on a marine slough and the vertical distribution ofunicellular plants in the sediment. Z allg Mikrobiol 2: 45-47.
- Strickland JDH (1972) A practical handbook of seawater analysis 2 (Ed.). J Fish Res Board Can 310.
- APHA (American Public Health Association) (1998) Standard Methods for the Examination of Water and Wastewater (20th Edition).
- Blake PA, Weaver RE, Hollis DG (1980) Diseases of humans (other than cholera) caused by vibrios. Annu Rev Microbiol 34: 341-367.
- Grimes DJ (1975) Release of sediment-bound fecal coli-forms by dredging. Appl Microbiol 29: 109-111.
- Carlson GF Jr, Woodard FE, Wentworth DF, Sproul OJ (1968) Virus inactivation on clay particles in natural waters. J Water Pollut Control Fed 40: R89-R106.
- Gerba CP, Schaiberger GE (1975) Effect of particulates on virus survival in seawater. J Water Pollut Control Fed 47: 93-103.
- Raveendran O, Gore PS, Iyer TSG, Varma PRG, Sankaranarayanan VN (1990) Occurance of enteric bacteria in seawater and mussels along the south west coast of India. Indian J Mar Sci 19: 282-284.
- Kirschner AKT, Gerhard GK, Branko V, Robert LM, Regina S, et al. (2009) Microbiological water quality along the Danube River: Integrating data from two whole-river surveys and a transnational monitoring network. 3673-3684.
- Eleria AL (2002) Forecasting Fecal Coliform Bacteria in the Charles River Basin. Master's Thesis, Tufts University, Medford, Massachusetts 192.
- Bell BP, Goldoft M, Griffin PM, Davis MA, Gordon DC, et al. (1994) A multistate outbreak of Escherichia coli O157:H7-associated bloody diarrhea and hemolytic uremic syndrome from hamburgers. The Washington experience. JAMA 272: 1349-53.
- Cieslak PR, Barrett TJ, Griffin PM (1993) Escherichia coliO157:H7 infection from a manured garden. Lancet 7: 342-367.
- Kelsey H, Porter DE, Scott G, Neet M, White D (2004) Using Geographic Information Systems and Regression Analysis to Evaluate Relationships Between Land Use and Fecal Coliform Bacterial Pollution. J Exp Marine Biol Ecol 298: 197-209.
- Basemer K, Markus MM, Jesus MA, Gerhard JH, Peter P (2005) Complexity of Bacterial communities in a River-floodplain System (Danube, Austria). Appl Environ Microbiol 71: 609-620.
- Mallin MA, Williams KE, Esham EG, Low RP (2000) Effect of Human Development on Bacteriological Water Quality in Coastal Watersheds. Ecol Appl 10: 1047-1056.
- Christensen VX, Jian, Ziegler A (2000) Regression Analysis and Real-Time Water-Quality Monitoring to Estimate Constituent Concentrations, Loads, and Yields in the Little Arkansas River, South-Central Kansas, 1995-99. USGS Water Resources Investigations Report 00-4126, Lawrence, Kansas
- Manja KS, Maurya MS, Rao KM (1982) A simple test for the detection of faecal pollution in drinking water. Bull World Health Organisation 60: 797-801.
- Francy OS, Gifford AM, Darner RA (2002) Escherichia coliat Ohio Bathing Beaches - Distribution, Sources, Wastewater Indicators, and Predictive Modeling. US Geological Survey Water- Resources
- Brewster DH, Brown MI, Robertson D, Houghton GL, Bimson J, et al. (1994) An outbreak of Escherichia coliO157 associated with a children's paddling pool. Epidemiol Infect 112: 441-441.
Relevant Topics
- Algal Blooms
- Blue Carbon Sequestration
- Brackish Water
- Catfish
- Coral Bleaching
- Coral Reefs
- Deep Sea Fish
- Deep Sea Mining
- Ichthyoplankton
- Mangrove Ecosystem
- Marine Engineering
- Marine Fisheries
- Marine Mammal Research
- Marine Microbiome Analysis
- Marine Pollution
- Marine Reptiles
- Marine Science
- Ocean Currents
- Photoendosymbiosis
- Reef Biology
- Sea Food
- Sea Grass
- Sea Transportation
- Seaweed
Recommended Journals
Article Tools
Article Usage
- Total views: 15426
- [From(publication date):
specialissue-2014 - Mar 31, 2025] - Breakdown by view type
- HTML page views : 10795
- PDF downloads : 4631

