Study of the Earthquake Probabilities in the Five Major Faults in and around Bangladesh: A Statistical Analysis
Received: 04-Dec-2017 / Accepted Date: 11-Jan-2018 / Published Date: 15-Jan-2018 DOI: 10.4172/2157-7617.1000438
Abstract
Statistical analysis is a tool to calculate earthquake probabilities. In this work, the previous earthquake data from 1918 to 2016 with the magnitude level 6 and above have been analyzed. From the data analysis, weibull parameters, namely, shape parameter (β), scale parameter (τ) and rate parameter of exponential distribution (λ) have been determined. To calculate earthquake probabilities for the upcoming years, weibull distribution, log-normal distribution and exponential distributions have been studied. These three statistical distributions have been compared among them in five major faults in and around Bangladesh.
Keywords: Earthquake; Probability; Weibull distribution; Log-normal distribution; Exponential distribution
Nomenclature of Greek symbols
β: Shape parameter of Weibull distribution; τ: Scale parameter of Weibull distribution; λ: Rate parameter of exponential distribution
Introduction
20.35°N to 26.75°N latitude and 88.03°E to 92.75°E longitude is the geographical location of Bangladesh. This location is surrounded by the Major Five Fault Zones i.e., i) Bogra fault zone ii) Tripura fault zone iii) Sub-Dauki fault zone iv) Shilong plateau and v) Assam plateau [1]. Therefore, Bangladesh has been affected by earthquake disasters tectonically since ancient times [2]. Lying in the confluence of India-Burma-Eurasia plateau, it is extremely prone to earthquake [3]. This indicates the necessity of the study about the fore-casting of the upcoming earthquake in Bangladesh and its adjacent areas.
In 2010, the earthquakes occurred in Bangladesh have been studied [4]. In the same year and next of this year, weibull distribution for estimating parameters and earthquake time history for Dhaka, Bangladesh as competent seismic record have also been studied respectively [5,6]. After the four years i.e., in 2014 of this study, another study titled by the probabilistic prediction for the earthquake of Bangladesh has been carried out [7]. Recently in 2015, Chakravorti et al., have studied for the earthquake fore-casting in Bangladesh and its surrounding regions [1]. These studies have been carried out for the fore-casting the probability for an earthquake of magnitude ≥ 6.0 occurring in the upcoming years statistically.
As there is no way to predict about a recurrent time of earthquake to save the lives and the property the fore-casting has done about an earthquake occurrence in the future. There are two ways such assimulation based fore-casting and the statistical based fore-casting. Basically, simulation based fore-casting is used to predict the earthquake for the long time and statistical based fore-casting is used to predict for the short time fore-casting. Simulation is helpful to produce the more accurate fore-casting using the stress, strain, latitude, longitude, length, depth etc. i.e., parameters of the earthquake fault zones. But the result of simulation and the result of different statistical distributions especially Weibull distribution is nearly similar. Conditional Weibull probabilities, seismic hazard of India study in 2004 and Kolmogorov-Smimov Test has been carried out in 2004 and proved that Weibull distribution is the best distribution to forecast probabilities of the occurrence earthquake [8].
However, the intention of this work is to calculate the earthquake probabilities in major five faults in and around Bangladesh. For this, the average time differences of the previous occurring earthquake have been calculated for these regions. Several statistical distributions have been proposed for the calculation of earthquakes probabilities for a short time. From these, weibull distribution has been used for the prediction of next strong earthquake. Log-normal and exponential distributions are also used for the comparison of the for-casting probabilities using weibull distribution in this work. The paper is organized as follows as: in section 2, we have given a brief description of statistical distributions. In section 3, the data are analyzed for the earthquake of the magnitude ≥ 6.0 from 1918 to 2016. For these data, the distribution parameters i.e., shape parameter (β), scale parameter (τ) and the decay parameter (λ) are determined and the comparisons are shown among the various statistical distributions. Finally, we have given the conclusion in section 4.
Statistical Distributions
Statistical analysis is useful to calculate earthquake probabilities. We have used three statistical distributions for the comparative study.
Weibull distribution
For this purpose, Weibull distribution is considered AS one of the most widely used lifetime distributions which has a wide range in engineering applications [9,10]. Weibull published his paper of Weibull distribution in 1939 [11]. An example is the distribution of times to failure of fibers. The Weibull distribution has also been widely used for specifying the distribution of earthquake recurrence times [12].
The PDF for a Weibull distribution of recurrence times is given by the Handbook of statistical distributions [13].
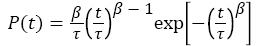 (1)
(1)
Where, β and τ are fitting parameters.
The CDF for a Weibull distribution is
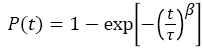 (2)
(2)
The hazard function for the weibull distribution is
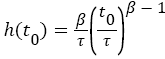 (3)
(3)
Log-normal distribution
The log- normal is one of the most widely used statistical distributions with a variety of fields. The PDF for a lognormal distribution of recurrence time t is given by JK et al. [13].
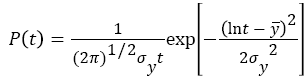 (4)
(4)
The log normal distribution can be obtained from the normal distribution by making the substitution  and
and are the mean and standard deviation of this equivalent normal distribution.
The corresponding CDF for the lognormal distribution is given by:
 (5)
(5)
Where,  is the error function [1]
Exponential distribution
In probability theory, an exponential distribution is a continuous probability distribution, which is commonly used to model the time between independent events that maintaining a constant average rate [11].
The exponential distribution can be written with the rate of λ is
 (6)
(6)
Where, the waiting time is measured forward from the present,  is waiting times for an earthquake on a fault from the time since the last earthquake is t0[4].
Data Analysis
Here the data are considered for the thirty-seven earthquakes for statistical analysis for the earthquake of magnitude ≥ 6.0 that occurred from 1918 to 2016. Three of them are great earthquake (ML 8.5 and above) that are very powerful to cause serious damage of life and properties. Three statistical distributions have been analyzed to calculate the statistical earthquake probabilities in five major faults in and around Bangladesh. The weibull parameters and the rate parameter of exponential distribution are also calculated for these data. The average interval among these thirty-seven earthquakes is 2.76 years. Values of fitting parameters for weibull distribution and the rate parameter of the exponential distribution have been also calculated from data of the year from 1918 to 2016. The values of fitting parameters β, τ and the rate parameter of exponential distribution λ are 1.2175, 2.97 and 0.3627 respectively.
Data Collection
We have collected earthquake data from United State Geological Survey (USGS) and Dhaka Metrological Station for 1918 to 2016 is given in Table 1 [14,15].
| Date | Location of Epicenter | Magnitude in Richter’s Scale | Time difference | |||
|---|---|---|---|---|---|---|
| Latitude (N) | Longitude (E) | |||||
| Deg. | Mts. | Deg. | Mts. | |||
| 1918 | 24 | 30 | 91 | 00 | 7.6 | 4 |
| 1923 | 25 | 18 | 91 | 00 | 7.1 | 5 |
| 1927 | -- | -- | -- | -- | 6.5 | 4 |
| 1930 | 25 | 30 | 90 | 00 | 7.1 | 3 |
| 1932 | 25 | 00 | 90 | 00 | 7.4 | 2 |
| 1933 | 26 | 00 | 90 | 30 | 7.6 | 1 |
| 1934 | 26.5 | 86.5 | -- | 8.3 | 1 | |
| 1935 | 28 | 48 | 89 | 18 | 6.3 | 1 |
| 1936 | 27.5 | 87 | -- | 7.5 | 1 | |
| 1938 | 23.5 | -- | 94.3 | -- | 7.2 | 2 |
| 1940 | -- | -- | -- | -- | 6.5 | 2 |
| 1941 | 27 | 00 | 92 | 00 | 6.8 | 1 |
| 1943 | 26 | -- | 93 | -- | 7.2 | 2 |
| 1954 | 28 | 30 | 91 | 30 | 6.5 | 11 |
| 1955 | 22.8 | -- | 93.0 | -- | 6.8 | 1 |
| 1956 | 23.0 | -- | 94.5 | -- | 6.3 | 1 |
| 1957 | 25 | -- | 94 | -- | 6.8 | 1 |
| 1958 | 23.5 | -- | 94.5 | -- | 6.4 | 1 |
| 1959 | 24 | -- | 95 | -- | 6.1 | 1 |
| 1964 | 24.9 | -- | 95.3 | -- | 6.7 | 5 |
| 1970 | -- | -- | -- | 6.5 | 6 | |
| 1975 | 21.5 | -- | 94.7 | -- | 6.5 | 5 |
| 1980 | 29.6 | -- | 81.1 | -- | 6.0 | 5 |
| 1993 | -- | -- | -- | -- | 6.3 | 13 |
| 1994 | -- | -- | -- | -- | 6.2 | 1 |
| 1995 | -- | -- | -- | 6.4 | 1 | |
| 1997 | -- | -- | -- | -- | 8.5 | 2 |
| 2000 | -- | -- | -- | -- | ≥6.00 | 3 |
| 2004 | -- | -- | -- | -- | 7.36 | 4 |
| 2007 | -04 | 11 | 106 | 53 | 8.5 | 3 |
| 2008 | -02 | 22 | 99 | 31 | 7.3 | 1 |
| 2009 | 27 | 40 | 91 | 36 | 6.4 | 1 |
| 2011 | 02 | 03 | 92 | 26 | 8.7 | 2 |
| 2012 | 23 | 47 | 95 | 55 | 6.6 | 1 |
| 2014 | 18 | 08 | 87 | 50 | 6.1 | 2 |
| 2015 | 28 | 05 | 84 | 52 | 7.5 | 1 |
| 2016 | 23 | 21 | 94 | 26 | 7.2 | 1 |
Table 1: Earthquake data of in and around Bangladesh from 1918 to 2016.
Parameter calculation
Using statistical programming language R to calculate the value of Weibull parameters, log–normal distribution (mean and standard deviation), and rate parameter of exponential distribution. Time difference between previous years earthquake record have been used from 1918 to 2016. The values of Weibull parameters β, τ and the rate of exponential distribution λ are 1.2175, 2.97 and 0.3627 respectively are calculated using this program. In the previous study the earthquake records from 1918 to 2008, the values of these parameters were 1.205, 3.22 and 0.333 respectively [1].
Results and Discussion
From 1918 to 2016 the earthquake data have been used for this study and the average years 2.76 between two successive earthquakes have been calculated.
Figure 1 shows the graph of CDF of Weibull distribution function. This figure means the probability of a strong earthquake occurrence in upcoming years. Similarly, Figures 2 and 3 show the graph of CDF of lognormal distribution and the exponential distribution function probability respectively using equation (5) and (6). Figure 4 gives the comparative analysis among CDF exponential distribution probability, CDF Weibull distribution and the CDF log-normal distribution.
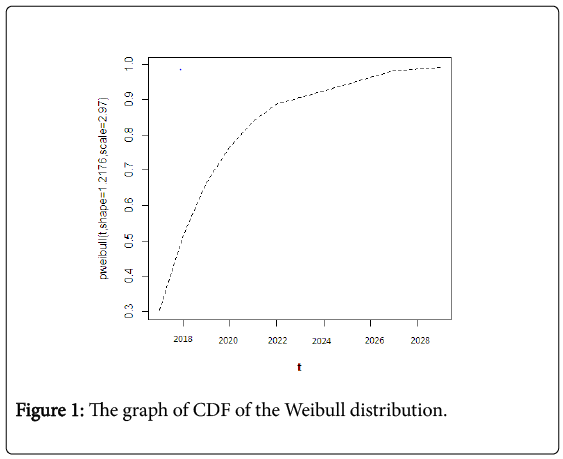
Figure 1: The graph of CDF of the Weibull distribution.
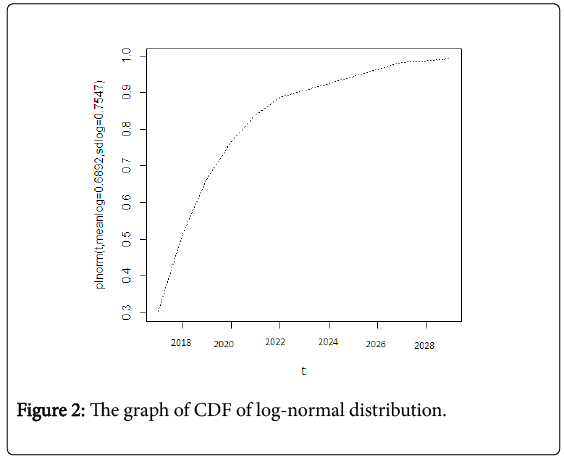
Figure 2: The graph of CDF of log-normal distribution.
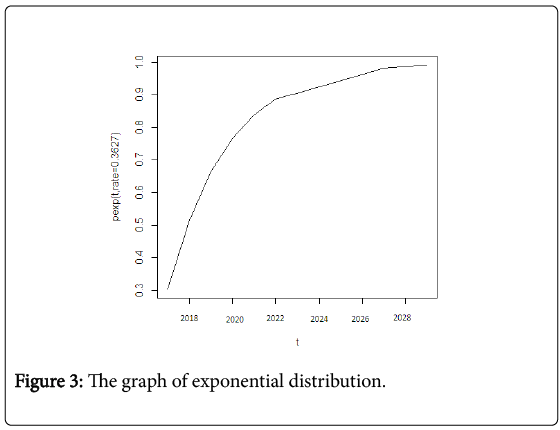
Figure 3: The graph of exponential distribution.
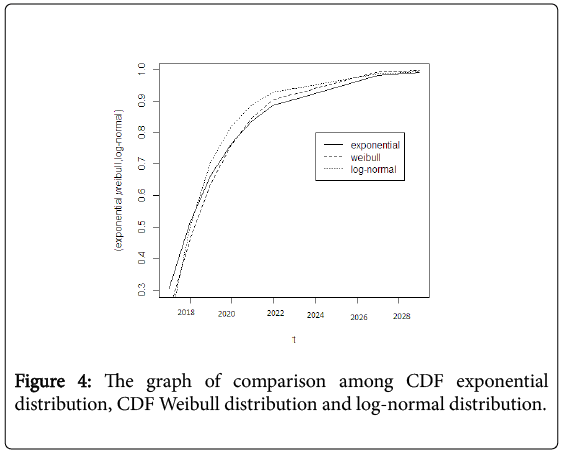
Figure 4: The graph of comparison among CDF exponential distribution, CDF Weibull distribution and log-normal distribution.
Conclusion
In this work, the study has been carried to find out the probability of occurrence earthquake using the earthquake’s data that occurred from 1918 to 2016. The parameters of weibull distribution and the rate of exponential distribution are calculated for this data. The values of weibull parameters β, τ and the rate of exponential distribution λ are 1.2175, 2.97 and 0.3627 respectively. The average year of occurrence earthquake from 1918 to 2016 is 2.76 years. These extended data are different from the previous from the previous data reported in [1]. In the previous study the earthquake records from 1918 to 2008, then the values of weibull parameters β, τ and the rate parameter of exponential distribution λ were 1.205, 3.22 and 0.333 respectively.
The average year between earthquakes from 1918 to 2008 was 3 years. From these values and the average year between the earthquakes records of 1918-2008 and 1918-2016, it is seen that there is a difference in the values β, τ and λ and the average year is decreasing. This indicates the probability of occurrence earthquake has been increasing over the year.
Ideally, the applicable distribution could be obtained from the historical record of earthquakes on faults. The discussions of these three statistical distributions estimate the great future earthquakes in Bangladesh. The above discussions of these three distributions tell us the probability of an earthquake occurrence increases for all distributions and after 13 years from 2016 i.e., 2029 becomes 99.9%. This estimates that the upcoming years are highly risky and alarming for Bangladesh with five major faults of occurring earthquake (Bografault zone, Tripura fault zone, Sub-Dauki fault zone, Shillong plateau and Assam plateau).
Conflict of Interest
The authors declare that there is no conflict of interests regarding the publication of this paper.
Acknowledgements
Authors thank to Research Cell and Dean, Faculty of Life Science, Mawlana Bhashani Science and Technology University, Santosh, Tangail-1902, Bangladesh for the financial support to carry out this study.
References
- Chakravorti BK, Kundar M, Moloy DJ, Islam J, Faruque SB (2015)Earthquake forecasting in Bangladesh and its surrounding regions. European Scientific Journal 11: 238.
- Hossain MA (1998) Earthquake Database and Seismic Zoning of Bangladesh. Department of Civil Engineering, BUET, Dhaka, Bangladeshpp: 59-74.
- Yakovlev G, Turcotte DL, Rundle JB,Rundle PB (2006) Simulation-based distributions of earthquake recurrence times on the San Andreas fault system. Bulletin of the Seismological Society of America 96: 1995-2007.
- Chakravorti BK, Faruque SB (2010) Study of Earthquakes: ABangladesh perspective, MS thesis, Department of Physics, SUST, Sylhet, Bangladesh.
- Bhattacharya P, Bhattacharjee R (2010) A study on Weibulldistribution for estimating the parameters. Journal of Applied Quantitative Methods 5: 2.
- Islam AB, Rahman MA, Jummat M (2011) Simplified design guidelines for seismic base isolation in multi-storey buildings for Bangladesh National Building Code (BNBC). International Journal of Physical Sciences 6: 3923-3928.
- Roy S (2014) Probabilistic prediction for earthquake in Bangladesh: Just how big does the earthquake have to be next years? JEarth Res 3: 108-114.
- Yilmaz V, Eray V (2004)Â Impact of weather conditions in Turkey. Turkey University, Turkey. 5: l243-1250.
- Weibull W (1951) A statistical distribution function of wide applicability.J ApplMech 18: 293–297.
- Meeker MQ, Escobar LA (1991) Statistical methods for reliability data. John Wiley & Sons, New York, USA.
- Sundarapandian V (2009) Probability, statistics and queuing theory. Eastern Economy Edition.
- Rikitake T (1982) Earthquake forecasting and warning. D. Reidel, Dor-drecht, The Netherlands.
- Patel JK, Kapadia CH, Owen DB (1976) Handbook of statistical distributions.Marcel Dekker, New York, USA.
- Meteorological Department (Climate Division) (1998) Earthquake data of in and around Bangladesh from 1918 to 2016, Government of People’s Republic of Bangladesh, Metrological complex, Agargaon, Dhaka-1207.
Citation: Rahman F, Islam J, Mohammad M, Chakravorti BK, Sarkar P (2018) Study of the Earthquake Probabilities in the Five Major Faults in and around Bangladesh: A Statistical Analysis. J Earth Sci Clim Change 9: 438. DOI: 10.4172/2157-7617.1000438
Copyright: © 2018 Rahman F, et al. This is an open-access article distributed under the terms of the Creative Commons Attribution License, which permits unrestricted use, distribution, and reproduction in any medium, provided the original author and source are credited.