Research Article Open Access
A Concise Study of Organic Volatile Impurities in Ten Different Marketed Formulations by [GC/HS-FID/MS] Gas Chromatography Technique
Gnana Raja M1*, Geetha G2 and Sankaranarayanan A11Manager, Analytical research and development, KMS Health center, Chennai, India
2Professor, PSG College of Pharmacy, Coimbatore, India
- *Corresponding Author:
- Gnana Raja M
Manager, Analytical research and development
KMS Health Center, Padi, Chennai, Tamil Nadu, India
Tel: +917708901162
E-mail: laconil2002@yahoo.com
Received date: July 22, 2014; Accepted date: August 25, 2014; Published date: August 29, 2014
Citation: Gnana Raja M, Geetha G, Sankaranarayanan A (2014) A Concise Study of Organic Volatile Impurities in Ten Different Marketed Formulations by [GC/HS-FID/MS] Gas Chromatography Technique. J Anal Bioanal Tech 5:202 doi: 10.4172/2155-9872.1000202
Copyright: © 2014 Gnana Raja M, et al. This is an open-access article distributed under the terms of the Creative Commons Attribution License, which permits unrestricted use, distribution, and reproduction in any medium, provided the original author and source are credited.
Visit for more related articles at Journal of Analytical & Bioanalytical Techniques
Abstract
Organic solvents such as Methanol, Isopropyl alcohol and Dichloromethane frequently used in sustained release or controlled release dosage form in pharmaceutical industry for coating. The good choice of solvent for coating of modified release dosage form is Methanol, Isopropyl alcohol and Dichloromethane. A selective Gas Chromatographic GC/HS-FID method has been developed and validated as per ICH guidelines for residual solvent quantification and confirmed the mass number by GC/HS-MS method. The separation was carried out on DB 624 column (30 m, 0.53 mm, [ID] 0.25 mm coating thickness), using Perkin Elmer/Clarus 500 GC/MS, with nitrogen as carrier gas in the split mode by head space injection method. The method described is simple, sensitive, rugged, reliable and reproducible for the quantization of Isopropyl alcohol, methanol and Dichloromethane at residual level in marketed modified release dosage form. In this paper completely demonstrated the method of quantification of residual solvents by GC/HS/FID and confirming by GC/HS/MS of the residual solvents present in 10 different marketed products availed in southern part of India. The enteric coated product has been selected and experiment was performed.
Keywords
Enteric coated formulations; Gas chromatography; Head Space; Mass spectroscopy; Residual solvents
Introduction
Residual solvents in pharmaceuticals are defined as organic volatile chemicals that are used to produce in the manufacturer of drug substance or excipients or in the preparation of drug product. Residual solvent do not provide any therapeutic benefit that should be removed to the maximum possible level fulfilling quality based requirements as per ICH guideline this is one of the standards to control the quality and purity of the pharmaceutical substance, excipients and drug products [1,2]. During the manufacturing process, certain types of formulations like gel extrusion module tablet (GEM), extrusion and spheronization (ES) techniques and enteric or modified release tablets often using solvents like methanol, isopropyl alcohol and dichloromethane [3-5].
Most of the pharmaceutical modified release dosage form having different type organic solvents that differ in molecular weight, polarity and volatility. For complex samples like these, head space sampling is the fastest and cleanest method [6-8]. A head space sample is normally prepared in vial containing the sample, dilution solvent, matrix modifier and the head space. Volatile compounds from complex sample mixture can extract from non volatile sample components and isolated in head space or vapor portion of a sample vial [9,10].
Experimental Method
Instruments and materials
Gas Chromatograph Perkin Elmer Clarus 500 was used in the development and validation of GC method. Gas chromatograph was equipped with standard oven for temperature programming, split/split less injection ports and flame ionization detector. DB-624 column (30 m×0.53 mm [ID]×0.25 μm coating thickness, 6% cyanopropyl phenyl and 94% dimethyl polysiloxane stationary phase), with nitrogen as carrier gas in the split mode by head space injection method was used. Analytical grade solvents isopropyl alcohol, methanol and dichloromethane were used as standard and dimethyl sulphoxide (DMSO) were used as solvent and it was purchased from Thomas Baker, Mumbai, India. Ten different branded extended release coated formulations were purchased from chemist shop which is situated in the southern part of India.
Preparation of standard
Isopropyl alcohol, methanol and dichloromethane were prepared at the concentration of 1000 μg/mL, 300 μg/mL and 120 μg/mL respectively by diluting with DMSO. 5 mL of the above solution was transferred into head space vial and crimped properly and analyzed in GC system. The standard was analyzed by GC/HS/FID and the response was used for the calculation of amount of residual solvents from the FID detector. The standard was analyzed by GC/HS/MS for determined the standard mass number of the each residual solvent.
Preparation of sample
Accurately weighed and crushed ten units in each brand of tablets. 500 mg of crushed tablet powder transferred in to head space vial and added 5 mL of DMSO and crimped properly. The sample was analyzed by GC/HS/FID and the quantification was done by the response found from the FID detector. The sample was analyzed by GC/HS/MS for confirming the mass number of the each residual solvent.
Temperature programming

Gas chromatographic conditions
Gas chromatographic conditions were shown in Table 1.
| Carrier Gas | Nitrogen |
| Flow | 1.5 mL/Minutes |
| Split ratio | 1:30 |
| Detector Temperature | 250 |
| Hydrogen/zero air | 1:10 |
| Attenuation | -3 |
| Run Time | 25 Minutes |
Table 1: Gas chromatographic conditions
Head space parameter
Head Space Parameters were shown in Table 2.
| Temperature | Timing | ||
| Carrier | 18 Psi | Pressurization | 2 minutes |
| Needle | 70°C | Inject | 0.05 minutes |
| Transfer line | 80°C | Withdraw | 0.2 Minutes |
| Oven | 60°C | Thermostat | 15.0 Minutes |
| GC Cycle | 25.0 minutes | ||
Table 2: Head Space Parameter
Mass conditions
Mass conditions were shown in Table 3.
| Scan Type | Full |
| Scan Range | 27 to 170 m/z |
| Scan Time | 2 s |
| Library | NIST-011 |
Table 3: Mass conditions.
| Sample | Isopropyl alcohol | Methanol | Dichloromethane | |||
|---|---|---|---|---|---|---|
| Area | Concentration µg/g | Area | Concentration µg/g | Area | Concentration µg/g | |
| 1 | 10321 | 5089 | 11542 | 3141 | 9051 | 583 |
| 2 | 10412 | 4667 | 12542 | 2891 | 8478 | 622 |
| 3 | 10235 | 4973 | 11412 | 3177 | 9245 | 570 |
| 4 | 10741 | 4863 | 10243 | 3539 | 8954 | 589 |
| 5 | 10254 | 4769 | 11541 | 3141 | 8124 | 649 |
| 6 | 10235 | 4985 | 12543 | 2890 | 8154 | 647 |
| Average | 4891 | Average | 3130 | Average | 610 | |
| SD | 155.2 | SD | 238.6 | SD | 34.0 | |
| % RSD | 3.2 | % RSD | 7.6 | % RSD | 5.6 | |
Table 4: Precision
Method validation
The analytical method validation was carried out as per ICH method validation guidelines [2]. The validation parameters addressed were System suitability, Precision, Linearity, and Limit of detection [LOD], Limit of quantization [LOQ], Accuracy, Robustness and Ruggedness.
System suitability
Six standard injections were injected and the percent related standard deviation was calculated.
Precision
Accurately weighed and crushed ten units each brand of tablets. 1 g of each brand of crushed powder mixed in a mortar. Then weighed 500 mg of mixed tablet powder transferred in to head space vial and spiked the standard at the target concentration and analyzed spiked and unspiked samples by GC/HC/FID, concentration of each solvent was calculated and the true concentration was obtained the subtracted value from the unspiked sample (Table 4).
Linearity
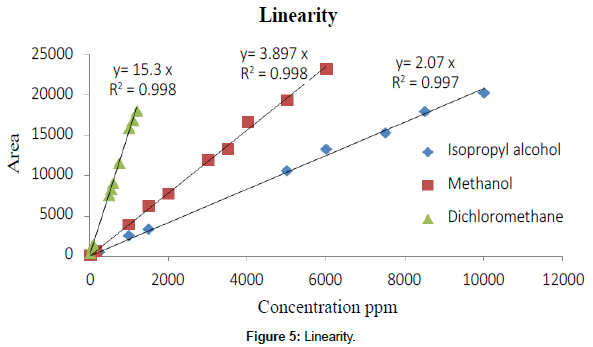
Linearity was established from the range of LOQ to 200% of the target concentration for each solvent. Linearity graph was plotted concentration of each solvent against response of the each solvent (Table 5).
| S.No | Isopropyl alcohol | Methanol | Dichloromethane | ||||
|---|---|---|---|---|---|---|---|
| % Level | Area | % Level | Area | % Level | Area | ||
| 1 | LOQ | 53 | LOQ | 55 | LOQ | 74 | |
| 2 | 2 | 165 | 5 | 621 | 13 | 1254 | |
| 3 | 5 | 501 | 33 | 3901 | 17 | 1485 | |
| 4 | 20 | 2514 | 50 | 6121 | 83 | 7543 | |
| 5 | 30 | 3321 | 67 | 7695 | 125 | 8297 | |
| 6 | 100 | 10542 | 100 | 11854 | 100 | 9051 | |
| 7 | 120 | 13214 | 125 | 13214 | 125 | 11541 | |
| 8 | 150 | 15210 | 167 | 16541 | 167 | 15847 | |
| 9 | 170 | 17854 | 183 | 19237 | 183 | 16841 | |
| 10 | 200 | 20145 | 200 | 23084 | 200 | 18012 | |
| [R2] | 0.997 | 0.997 | 0.998 | ||||
Table 5: Linearity
LOD & LOQ establishment
LOD and LOQ was established by S/N ratio method, signal to noise ratio was found closer to 10 for limit of quantization and 3 for limit of detection (Table 6).
| Solvents | Concentration (ppm) | Area | S/N ratio |
|---|---|---|---|
| Isopropyl alcohol | 23 | 53 | 9.56 |
| Methanol | 25 | 55 | 10.42 |
| Dichloromethane | 11 | 81 | 10.31 |
Table 6: LOQ
Accuracy
Accuracy was established LOQ to 200% of the target concentration, standard solution was spiked in the mixture of the crushed formulations.
Robustness and Ruggedness
Analytical parameters were deliberately changed and the system suitability was checked. Initial temperature of the gradient program and flow of the carrier gas was changed ± 2 number for chromatographic condition. Different brand of column was used. Head space parameter needle, oven and transfer line temperature was changed ± 10%. For intermediate precision experiment was performed with another analyst (Table 7).
| S.No | Name | Isopropyl alcohol | Methanol | Dichloromethane | |||
|---|---|---|---|---|---|---|---|
| Concentration (µg/g) | Mass Number | Concentration (µg/g) | Mass Number | Concentration (µg/g) | Mass Number | ||
| 1 | Brand # 1 | 500 | 45 | 221 | 32 | 140 | 84 |
| 2 | Brand # 2 | 240 | 45 | Not Detected | Not Detected | ||
| 3 | Brand # 3 | Not Detected | 654 | 32 | 230 | 84 | |
| 4 | Brand # 4 | 212 | 45 | Not Detected | Not Detected | ||
| 5 | Brand # 5 | 843 | 45 | 215 | 32 | Not Detected | |
| 6 | Brand # 6 | 214 | 45 | 241 | 32 | Not Detected | |
| 7 | Brand # 7 | Not Detected | 850 | 32 | 214 | 84 | |
| 8 | Brand # 8 | 321 | 45 | 154 | 32 | Not Detected | |
| 9 | Brand # 9 | 854 | 45 | Not Detected | 210 | 84 | |
| 10 | Brand # 10 | 541 | 45 | 798 | 32 | Not Detected | |
Table 7: Concentration of residual solvent in different brand
Results and Discussion
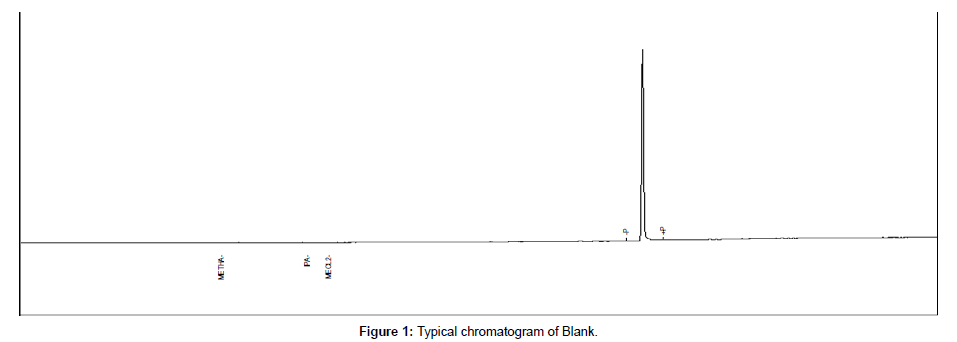
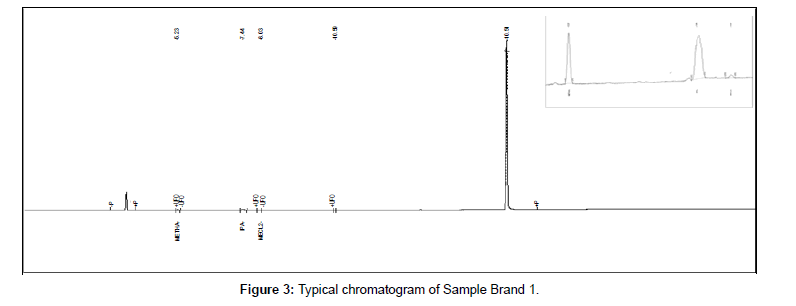
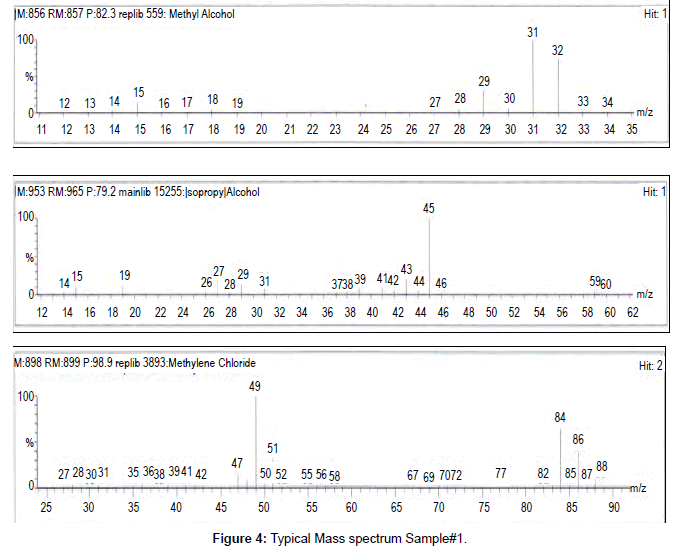
Gas chromatographic method for the determination of residual solvents in marketed formulations by GC/HS/FID and the mass number of the respective residual solvent was confirmed by GC/HS/ FID/MS. Residual solvent method was developed and validated as per ICH guidelines and the parameter was explained above. System suitability was performed and the percent related standard deviation and bracketing standard was found below 15.0% for the entire activity. Precision was performed in spiked samples at targeted concentration and LOQ concentration for each solvents and the percent relative standard deviation of six sample preparations was found 3.2 to 7.6% for 100% level and 7.7% to 12.2% for LOQ level each solvent respectively. Linearity was established from LOQ to 200% of the target concentration and the correlation coefficient was found 0.997 to 0.998. Accuracy was performed from LOQ to 200% at five levels from the target concentration in mixed formulations powder, recovery was found 90.0% to 107.0% at each level each solvent. Range was covered from the precision, linearity and accuracy section. Robustness and Ruggedness was proven by the suitability of the method and the percent related standard deviation was found 4.1% to 8.1% for this activity. Each sample was analyzed by GC-HS/MS and mass number of the each solvent in each sample was compared with the standard mass number. Hence it is conforming the particular solvent may be methanol, isopropyl alcohol and dichloromethane and the detailed results tabulated in Table 8. Concentration of each solvent was with in the limit as per the ICH guidelines [Q3C (R5)]. Compiled validation result tabulated in Table 8. Typical chromatogram, mass spectrum and linearity plot refer Figures 1 to 5.
| Parameter | Acceptance criteria | Results |
|---|---|---|
| System Suitability | % RSD Not More Than 15.0% | 1.6% to 8.1% |
| Precision | % RSD (six sample preparation) Not More Than 15.0% | @ LOQ level – 7.7 to 12.2% and 100% Level 3.2 to 7.6% |
| Linearity | Correlation coefficient Not Less Than 0.995 | 0.997 to 0.998 |
| Accuracy | Percent Recovery 85.0% to 115.0% | 90.0 to 107.0% [Overall recovery form LOQ to 150%] |
| Robustness and Ruggedness | % RSD Not More Than 15.0% | 4.1 to 8.1% [Overall compilation of system suitability] |
Table 8: Overall compilation of validation [Results of entire study]
References
- US Pharmacopial convention (2000) United States Pharmacopoeia. 24th edition, US Pharmacopial convention, Rockville, MD, 877.
- ICH Harmonized Tripartite Guidelines (1997) Impurities: Guideline for Residual Solvents Q3C(R3). Current Step 4 Version.
- Legrand S, Dugay J, Vial J (2003) Use of solid-phase micro extraction coupled with gas chromatography for the determination of residual solvents in pharmaceutical products. J Chromatogr A 999: 195-201.
- Dennis KJ, Josephs PA, Dokladalova J (1992) Proposed automated headspace method for organic volatile impurities (467) and other residual solvents. Pharm Forum 18: 2964-2972.
- Puranik SB, Sharath S, Sanjay Pai PN (2012) Head Space Gas Chromatography analysis of residual solvent using EC-5 column. IJPCR 1: 22-27.
- Ramos CS (2013) Development and Validation head space chromatographic method for determination of residual solvents in five drug substance. IJPSI 2: 36-41.
- Anil Kumar V, Arvind G, Srikanth I, Srinivasarao A, Dharma Raju Ch (2012) Novel analytical method development and validation for the determination of residual solvents in Amlodipine besylate by gas chromatography. Der Pharma Chemica 4: 2228-2238.
- Varun raj V, Pramod G, Naresh babu N (2010) Estimation of Residual solvents in Clopidogrel Bisulphate by using Chromatographic Techniques. IJRPB 1: 92-96.
- Grodowska K, Parczewski A (2010) Analytical methods for residual solvents determination in pharmaceutical products. Acta Poloniae Pharmaceutica – Drug Research 67: 13-26.
- Baliyan PK, Singh RP, Arora S (2009) Simultaneous estimation of Residual solvents (Isopropyl Alcohol and Dichloromethane) in Dosage form by GC-HS-FID. Asian Journal of Chemistry 21: 1739-1746.
Relevant Topics
Recommended Journals
Article Tools
Article Usage
- Total views: 14333
- [From(publication date):
September-2014 - Apr 05, 2025] - Breakdown by view type
- HTML page views : 9734
- PDF downloads : 4599


