Research Article Open Access
Structural Deformation and Depositional Processes: Insights from the Greater Ughelli Depobelt, Niger Delta, Nigeria
Izuchukwu I Obiadi* and Obiadi CMGeological Sciences Department, Nnamdi Azikiwe University, Awka, Nigeria
- *Corresponding Author:
- Izuchukwu I Obiadi
Department of Geological Sciences
Nnamdi Azikiwe University, Awka
Anambra State, Nigeria
Tel: +234 806 9074221
E-mail: izuchukwuig@yahoo.com
Received Date: June 20, 2016; Accepted Date: June 30, 2016; Published Date: July 13, 2016
Citation: Obiadi II, Obiadi CM (2016) Structural Deformation and Depositional Processes: Insights from the Greater Ughelli Depobelt, Niger Delta, Nigeria. Oil Gas Res 2:118. doi: 10.4172/2472-0518.1000118
Copyright: © 2016 Obiadi II, et al. This is an open-access article distributed under the terms of the Creative Commons Attribution License, which permits unrestricted use, distribution, and reproduction in any medium, provided the original author and source are credited.
Visit for more related articles at Oil & Gas Research
Abstract
The growth and development of the structural and depositional systems in the hydrocarbon rich Niger Delta, off the Atlantic Coast of Nigeria, West Africa, involves a complex interaction of extension, contraction and subsidence such that at any given point in time up-dip extensional system are kinematically linked to down-dip contractional systems via a transitional zone. On the regional tectonostratigraphic zonation are local structural and depositional systems associated with individual extensional faults and thrust-cored folds, local subsidence and withdrawal associated with shale diapir growth. The research is a case study of growth faults and associated deltaic sedimentation in the Greater Ughelli Depobelt of the Niger Delta. Using 3D seismic, a range of well log suites and biostratigraphic data, a regional sequence stratigraphic framework of the study area was produced. Six Maximum Flooding Surfaces MFS’s and five Sequence Boundaries SB’s were defined within the confines of available data. With the aid of these regional horizons/markers (MFSs and SBs) and events pattern in the seismic volume, a structural interpretation model and framework for the study area was also undertaken. Structural analysis show that fault activity began well before 31.3 Ma and continued beyond 20.7 Ma, and has greatly influenced the creation of accommodation space and sediment accumulation. Generally, due to structural deformation and structurally induced accommodation creation, stratigraphic thickness is observed to have increased in the basin ward direction, and at different stages in the structural evolution of the study area, ‘local depocenter’ have migrated to the NW (29.3 Ma-22.2 Ma) and then to the SE (22.2 Ma-20.7 Ma) resulting also in lateral changes in stratigraphic thicknesses in these directions.
Keywords
Ughelli depobelt; Biostratigraphic; Depocenter; Stratigraph; Atlantic rifting
Introduction
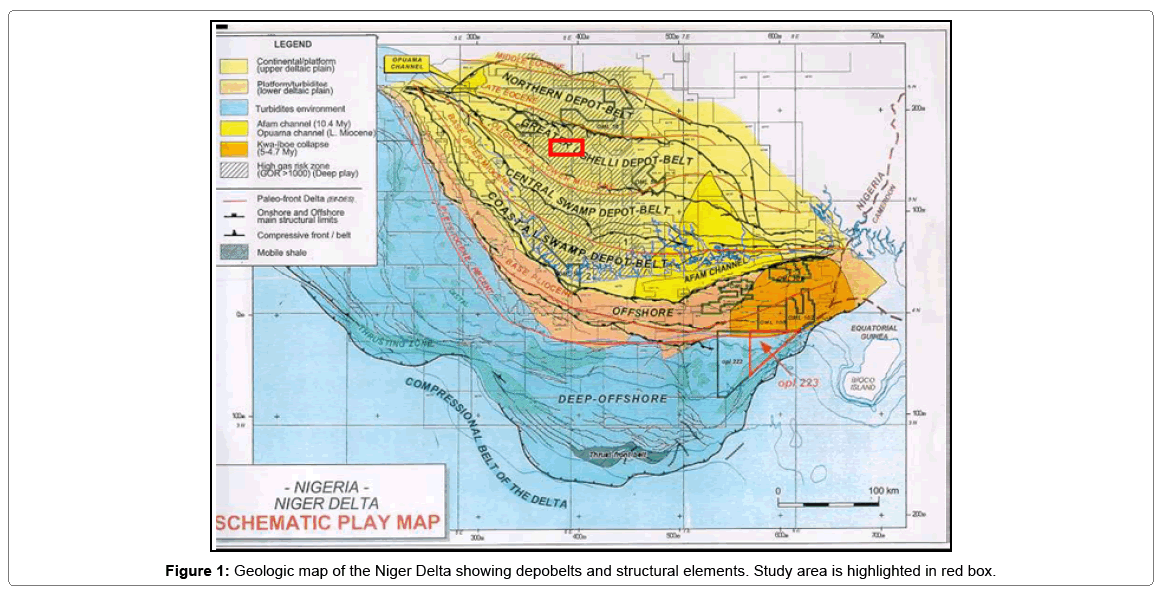
The Niger Delta is located in the Gulf of Guinea at a formal triple junction of the south Atlantic rifting [1]. Covering an approximate areal extent of 70,000 km2, the delta is recognized as a classic example of continental-margin structural collapse under sediment loading [2-7]. The delta originally developed inland during Late Cretaceous to Eocene and has prograded from collapsed continental onto the oceanic crust from Oligocene to present. The delta is a long-lasting system supplied by the Niger and Benue rivers. Both rivers have extensive drainage basins which delivered a high sediment supply accommodated by large growth faults. The resulting succession of deltaic, inters lope and abyssal plain deposits has reached a thickness of approximately 12 km [1]. Deltaic growth faults and associated strata record the interaction between sedimentary processes and fault movements, and as such they are good for detailed studies of the interaction of tectonics and sedimentation [8-12]. Structure and depositional systems have migrated with the progradation of the delta through time. Throughout the history, the delta has prograded in a step-like fashion such that at any one time sedimentation was concentrated in an arcuate depobelt bounded by large-scale growth faults. These depobelts are defined by one or more paleontologically distinct, transgressive shale horizons, and include temporally related smaller-scale structures and depocenters. Subsidence within the depobelts ceased episodically, at which time alluvial sands advanced rapidly across the delta top, concurrent with a seaward shift in deposition and subsidence [13]. Five regional depobelts are defined in the basin – (1) Northern Delta, (2) Greater Ughelli, (3) Central Swamp, (4) Coastal Swamp and (5) Offshore depobelts (Figure 1). The study area is in the Greater Ughelli Depobelt of the Niger Delta basin of Nigeria.
Lithostratigraphic framework
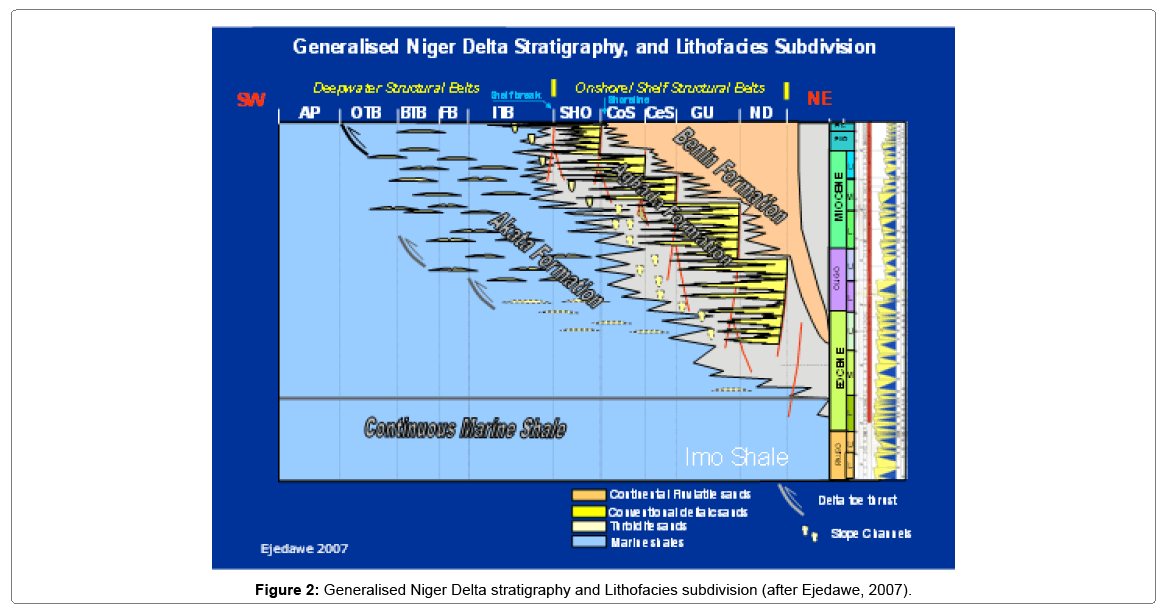
The sedimentary fill of the Niger Delta basin has been subdivided into three (3) broad lithofacies units, which include the marine shales (Akata Formation); marginal marine sandstones, shales and clays (Agbada Formation); and massive continental sandstones (Benin Formation) (Figure 2). The Akata Formation is the oldest units and forms the base of the sequence in each depobelt and has stratigraphic thickness which may reach 7000 m in the central part of the delta. Overlying the Akata Formation is the paralic Agbada Formation represented by sands, shales and clays alternations in various proportion and thickness deposited in a number of deltafront, delta-topset and fluvio-deltaic environments. It has a maximum thickness of about 3000 m. The Benin Formation is the youngest unit with variable thickness which becomes thinner offshore [14]. This generally regressive clastic sequence of the delta reaches a maximum thickness of about 9-12 km [15].
Structural framework
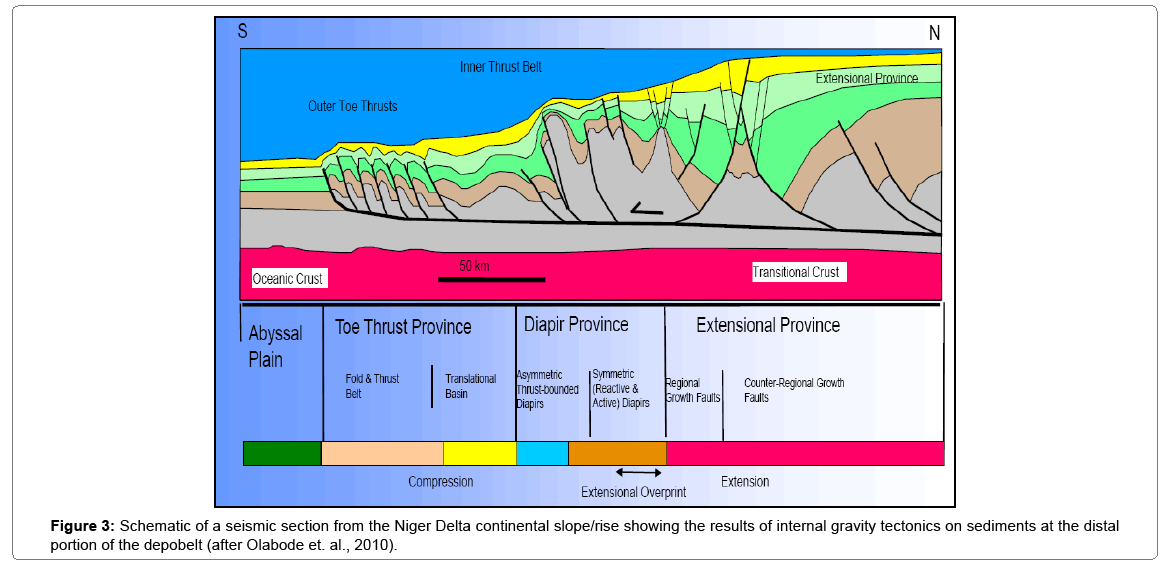
The Niger Delta is subdivided into structural zones that are characterized by distinctive basinwards variations in structural styles and deformation linked on a regional scale by slow gravity collapse of thick deltaic prism [7,9,16]. The zones are (1) an inner extensional zone of listric growth faults beneath the outer shelf; (2) a translational zone of diapirs and shale ridges beneath the upper slope; and (3) an outer compressional zone of imbricate toe-thrust structures beneath the lower slope (Figure 3). However Corredor [17,18], further subdivides the Niger Delta into five major structural zones based on structural styles imaged in seismic data and high resolution bathymetry. They are (1) an extensional zone beneath the continental shelf that is characterized by both basinward-dipping and counter-regional growth normal faults and associated rollovers and depocenters; (2) a mud-diapir zone located beneath the upper continental slope which is characterized by passive, active, and reactive mud diapirs including shale ridges and massifs, shale overhands, vertical mud diapirs that form mud volcanoes at the seafloor; (3) the inner fold and thrust faults (typically imbricated) and associated folds, including some detachment folds; (4) a transitional detachment fold zone beneath the lower continental slope that is characterized by large areas of little or no deformation interspersed with large, broad detachment folds above structurally thickened Akata Formation; and (5) the outer fold and thrust belt characterized by both basinward and hinterlandverging thrust faults and associated folds. Deformations across these structural zones are very much active today.
Data availability and quality
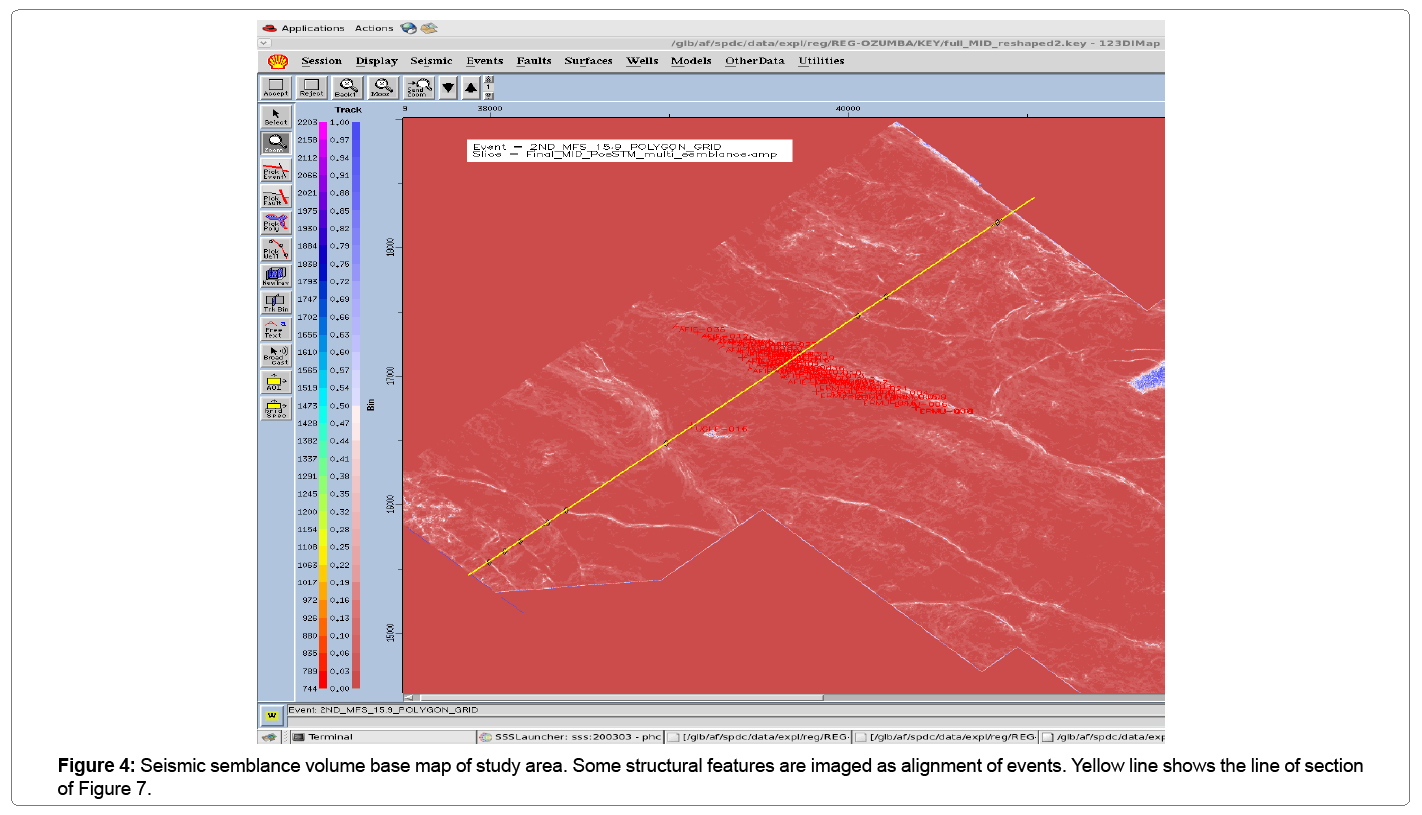
Materials used for this study included 3D seismic volume (Figure 4), well log suites and biostratigraphic data. The seismic volume is characterized by a series of nearly parallel reflections from strata offset by growth normal faults that dip offshore to the southwest. The reflections are quite chaotic close to and behind faults while they are continuous at zones away from faults. Reflections within the upper 0.9 s TWT (two-way-travel time) are slightly discontinuous and of relatively low amplitude [19]. Based on regional studies of the basin these can be inferred to be reflections off layers of the sandy Benin Formation. At intervals between 1 s and 4.5 s TWT, the reflections are relatively continuous and of good amplitude. These are inferred to be reflection from the marginal-marine Agbada Formation and marine Akata Formation. Data quality generally deteriorates at depth below 4.5 s TWT, characterized by zones of discontinues and chaotic low amplitude reflection; and zones of continuous and high amplitude reflections. Well log suites comprise Gamma Ray logs and Spontaneous Potential SP logs. In some wells the whole length of the bore were logged while in some others only a small portion, mainly in the productive zone, were logged. The quality of the logs is quite good especially where the whole length of the well bore is logged. Bio stratigraphic data comprises Biofacies data, Palyno logical zone (P-Zone) and Foraminifera zone (F-Zone) (Shell Petroleum Development Company SPDC, Nigeria zonation scheme). The bio faces data contains information on total foraminifera abundance and diversity, total planktonic foraminifera abundance and diversity, total benthic calcareous foraminifera abundance and diversity, total benthic arenaceous foraminifera abundance and diversity, pale bathymetry and environment of deposition for various depth intervals of the well bore.
Methodology
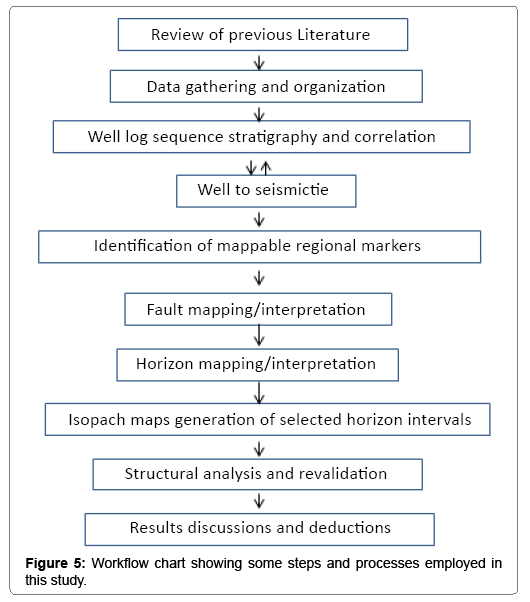
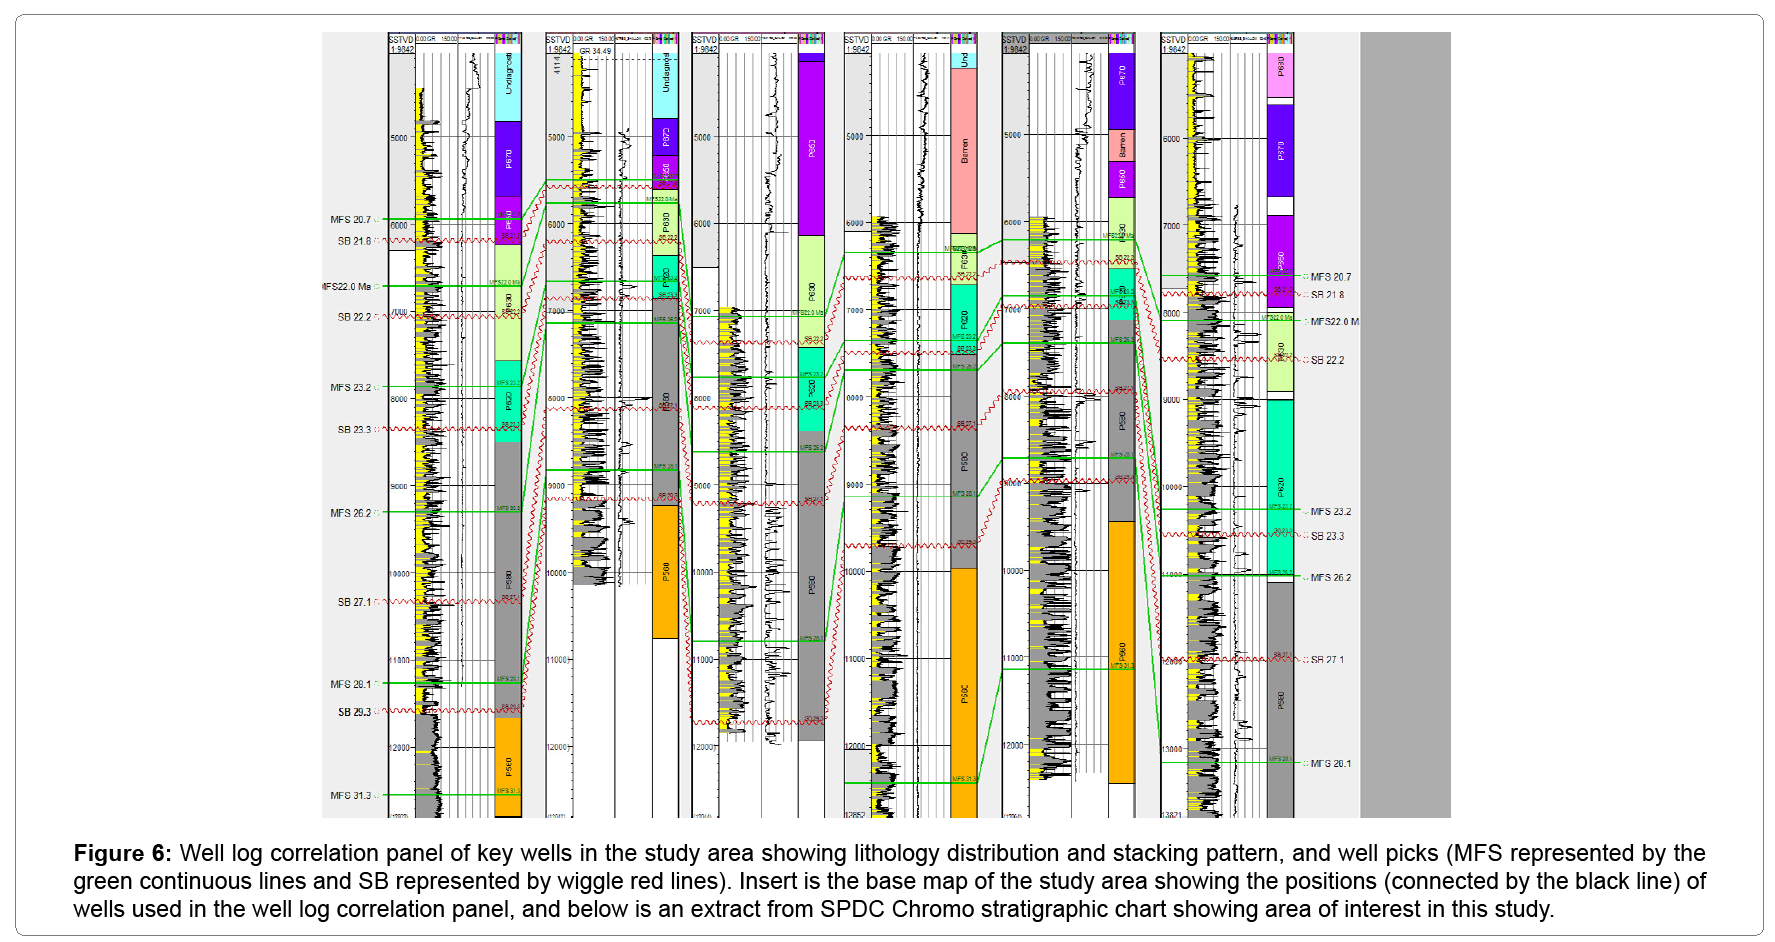
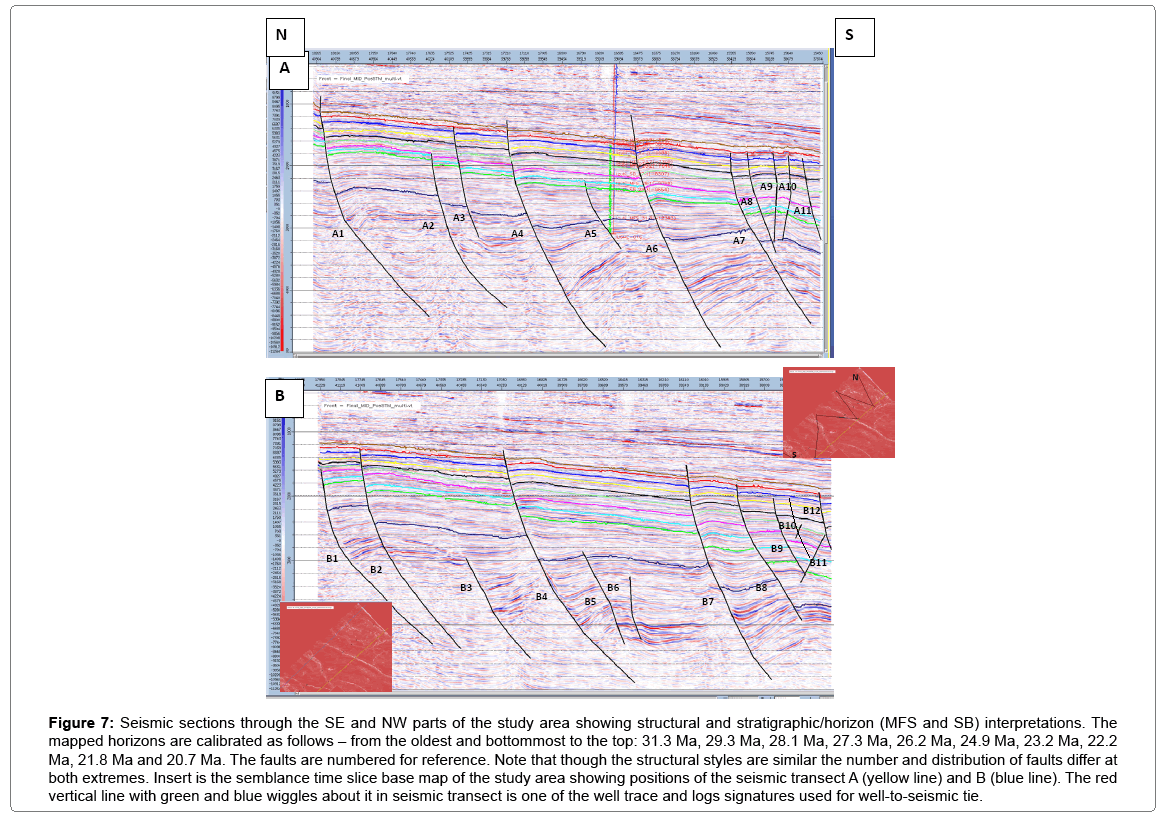
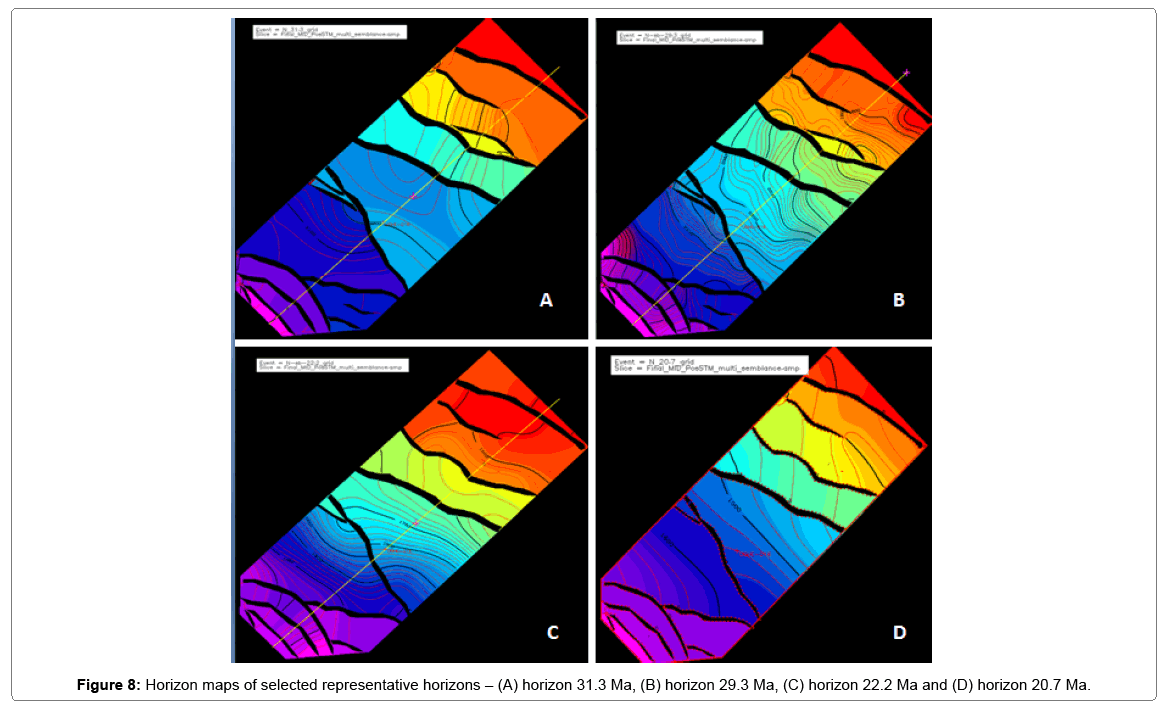
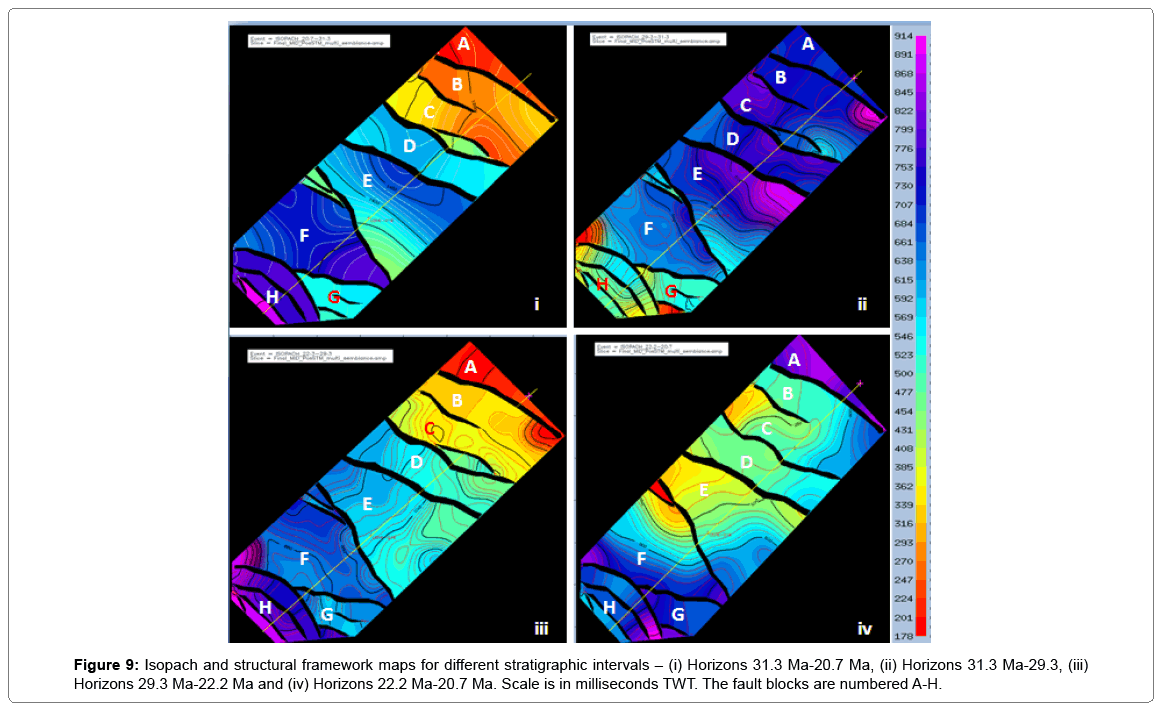
An integrated and systematic approach was employed in the interpretation and analysis of the data available for this study as summarized in the work flowchart (Figure 5). A lithologic interpretation of the Gamma Ray GR logs was done to identify the different rock types and their stacking pattern. Based on this stacking pattern candidates for Maximum Flooding Surfaces MFS and Sequence Boundary SB were identified. Best candidate picks were constrained and defined by the integration of the biostratigraphic data of the wells in the study area. The selected MFS and SB were then calibrated and dated with the aid of the SPDC Niger Delta Chronostratigraphic scheme and correlated across wells to produce a well log sequence stratigraphic correlation panel (Figure 6). Well – to – Seismic tie was done by converting the well picks (MFS’s and SB’s) into well tops and textured against displayed seismic section. Faults, which show up in the seismic volume as discontinuity with displacement; and distortions of events, were identified and interpreted all through the seismic volume (Figure 7). Corresponding reflections identified from the well-to-seismic ties were interpreted all through the seismic volume and corrected for mis-ties, to produce horizon maps (Figure 8), from which isopach maps of selected stratigraphic intervals of interest were created (Figure 9).
Figure 6: Well log correlation panel of key wells in the study area showing lithology distribution and stacking pattern, and well picks (MFS represented by the green continuous lines and SB represented by wiggle red lines). Insert is the base map of the study area showing the positions (connected by the black line) of wells used in the well log correlation panel, and below is an extract from SPDC Chromo stratigraphic chart showing area of interest in this study.
Figure 7: Seismic sections through the SE and NW parts of the study area showing structural and stratigraphic/horizon (MFS and SB) interpretations. The mapped horizons are calibrated as follows âÂ?Â? from the oldest and bottommost to the top: 31.3 Ma, 29.3 Ma, 28.1 Ma, 27.3 Ma, 26.2 Ma, 24.9 Ma, 23.2 Ma, 22.2 Ma, 21.8 Ma and 20.7 Ma. The faults are numbered for reference. Note that though the structural styles are similar the number and distribution of faults differ at both extremes. Insert is the semblance time slice base map of the study area showing positions of the seismic transect A (yellow line) and B (blue line). The red vertical line with green and blue wiggles about it in seismic transect is one of the well trace and logs signatures used for well-to-seismic tie.
Results and Discussions
Sequence stratigraphy
Identifying, mapping and correlating events/horizons in seismic is not without its ambiguity. Several factors are responsible for the amplitude, geometry and continuity of reflections in the final seismic volume such that two different events of different ages may appear to be similar, and hence may be mapped during seismic interpretation as the same especially across faults and in zone of chaotic seismic reflection characteristics, by pattern recognition and/or ‘ghost matching’. Serious errors in seismic interpretation and resultant exploration/exploitation decisions have been made because of this. A better approach to seismic interpretation is the incorporation of sequence stratigraphy and biostratigraphic data in the identification and correlation of events/horizon of interest as well as in dating same. Well-log sequence stratigraphy constrained by seismic stratigraphy and biostratigraphy data was done with the aim of identifying regional time significant and creatable events (MFS’s and SB’s). Within the limits of available data, six MFS’s and five SB’s were identified and correlated across key wells in different fault blocks in the study area. They are – MFS 31.3 Ma, SB 29.3 Ma, MFS 28.1 Ma, SB 27.3 Ma, MFS 26.2 Ma, SB 24.9 Ma, MFS 23.2, SB 22.2 Ma, MFS 22.0 Ma, SB 21.8 Ma and MFS 20.7 Ma. These regional horizons were tied to seismic, mapped all through the seismic volume and used for studies on structural analysis and evolution, and the influence of structural deformation on depositional processes. Since these horizons are picked and interpreted from wells in different fault block, correlation of events across faults are better constrained. From the well logs signatures, the MFSs are characterized by thick and extensive shale units defined by thick high gamma-ray value intervals that separates overall fining-upward interval from coarseningupwards intervals (Figure 6), and high abundances and diversities of microfossils. Key index fossils were used to constrain and date individual MFS. In seismic, they (MFS) are characterized by extensive and continuous conformable events that can be correlated from fault block to fault block. The SBs are characterized by sizeable sand unit defined in well log by abrupt and sharp bases of thick low gamma ray value intervals usually separating coarsening-upwards intervals from fining-upwards intervals (Figure 6). Also in seismic, SBs are somewhere marked by evidences of erosional activities and other truncations. The stratigraphic thickness and geometry of the sequence interval is greatly influenced by the structural deformation displacement and styles.
Structural analysis and evolution
Faults in the study area were interpreted mainly from seismic and sometimes constrained from the interpretation of the well log correlation panel. The faults are defined by abrupt termination and displacement of reflection pattern in seismic (Figure 7), and sharp displacement and dislocation of horizon correlation patterns in the well log correlation panel (Figure 6). All the faults are extensional in nature and characterized by the downward displacement of the hanging wall relative to the foot wall, resulting in the basinwards thickening of stratigraphy in response to the fault displacement and accommodation space creation. The styles and geometry of faults interpreted in the study area comprises broadly basinward concave, northwest-southeast trending listric faults and antithetic faults. The dip of the fault planes for all the faults generally decreases with depth. The propagation and interaction of these faults produced different structural features that greatly impacted horizons and accommodation space differently at different locations. Most of the faults are interpreted to cut across the whole width of the study area, from the northwest to south east extremes, (faults A1/B1, A3/B3, A4/B4, A5/B5, A6/B7, A7/B8, A8/ B9, A9/B10 and A11/B12), while other are restricted to one of these extremes, either dying out towards the opposite extreme (fault B2) or joining another fault along that direction (faults A2, B6, A10, B11). Most of these faults extend deep into the underlying plastic and mobile shales of the Akata Formation which forms a detachment base for the faults. Faults A9 and A10, and the corresponding B11 are antithetic and counter-regional to the basinwards dip of the other faults. They are interpreted to have resulted from the local tensional stress occasioned by the displacement along the fault A6/B7 which gave rise to an anticlinal structure in the basinward direction and a crestal collapse. Fault throw and displacement as well as folding of surfaces across rollover anticlinal structure generally increases with depth. Reflections within downthrown fault blocks fan apart away from the parent fault, and where anticlinal structures are formed by displacement along the parent fault, reflections also fan apart basinward of the anticlinal crest, recording the deposition of syndeformational growth strata (Figure 7). All the mapped faults in the study area recorded growth stratigraphy across them indicating that they are all conformational structures. The kinematic analysis of growth faults and stratigraphy requires a high quality stratigraphic subdivision of syntectonic successions as input, because the computation and analysis of fault throw, heave and slip values directly depends on the accuracy of corresponding horizon pairs on the footwall and hanging-wall sides of a growth fault [8]. A sequence stratigraphic approach was used in identifying and picking corresponding and age constrained regional markers (MFS’s and SB’s) in all the fault blocks in the study area. Analysis of growth stratigraphy shows that the structural evolution/faulting activity in the area spans through and exceed the timeframe represented by the mapped horizons (31.3 Ma-20.7 Ma) as most of the faults and growth stratigraphy interpreted affected these horizons (Figure 7). However, fault activity as interpreted here is seen to be greatest between the periods 31.3 Ma to 29.3 Ma, resulting in the large thickness of growth strata within this interval which is indicative of relatively high rate of structural deformation/downwards displacement of hanging wall block and accommodation space creation. The relative tightness and complexity of fault induced anticlinal structures in the strata within this horizon interval and older strata below lend credence to this interpretation. In the older strata below horizon 31.3 Ma, it can be observed that the growth strata fans out more, adjacent to the parent faults, compared to growth strata in subsequently younger horizons. This, when plotted in growth or expansion index plot recorded a relatively high value of fault activity within this period in the evolutional history of faulting in the area. Structural deformation rate decreased subsequently as can be seen from the analysis of fault throw and growth strata thicknesses in/ between younger horizon intervals of similar age range (using an age range of about 2.1 Ma). Structural activity, complexity and deformation of these younger strata are also less when compared with that obtainable in the older strata in the expansion index plot. Due to unavailability of well log and biostratigraphic data (all the drilled wells do not extend below horizon 31.3 Ma) as well as seismic data deterioration, at greater and shallower depths, it was not possible to map well constrained preand post-deformational horizon respectively and hence the actual dating of the commencement and cessation of structural deformation cannot be done. However a thick reflection with high amplitude, seen about 40 ms TWT above the youngest 20.7 Ma horizon in all the seismic transect (Figure 7) was probably deposited after the termination of faulting activities as none of the interpreted faults cut into it, and also it was not affected by displacement resulting from contemporaneous faulting activities in the older and underlying strata /horizons in the area since it does not have flexural warping/folding, which is indicative of fault displacement induced deformation [20].
Structural deformation and sediment deposition
Most of the structural deformations in the Niger Delta basin are synformational, evolving at the same time as sediment deposition. There exists a linkage of some sort such that the structural and depositional systems are co-dependent – the spatial location of depocenters is controlled by the structural styles and evolution of the basin. Most of the regional faults in the Niger Delta extend deep down into the mobile under-compacted Akata Formation which readily forms a detachment zone. With the high rate of sediment influx into the delta, corresponding structural deformation and displacement/throw assisted by the plastic underlying Akata Shales dÄ?collement zone, create and modify accommodation space for sediment accumulation. Depocenters tends to switch spatial location and stratigraphic thicknesses (which generally reflects the amount of accommodation space available for sediment deposition) varies laterally with location in response to structural deformation. A structural framework for the study area has been produces (Figures 7 and 8). Most of the faults in the interpreted model are regional in extent, cutting across the width of the study and trending NW-SE, extend deep into the Akata formation and recorded significant amount of throw. However, other minor faults such as fault A2 are relatively localized. They sometimes do not extend deep into the Akata Formation and do not as well extend to the shallowest depth recorded by the major faults. These minor faults, which probably evolved as a result of local stress occasioned by displacement along the regional faults, relatively do not record high amount of throw. The usually take up some amount of the total throw attributable to the adjoining major faults resulting in a decrease in the individual amount of throw recorded by the affected major and minor fault pairs (Figure 7). The thickness of sediment deposits between successively younger regional horizons (MFS’s and SB’s) is inferred to reflect mostly variation in structurally generated accommodation and, to a lesser extent, larger scale deltaic progradation into the basin. Analysis of the isopach maps (Figure 9) generated for different representative horizon intervals show that structural deformation has played a very significant role in the generation of sediment accommodation space and the lateral stratigraphic thickness variation recorded in the study area. Figure 9i is an isopach map covering the intervals within all the interpreted horizons (Horizons 31.3 Ma-Horizon 20.7 Ma). This generalized isopach map covering 10.4 Ma of sediment deposition and accumulation and structural deformation, shows that generally faulting activity measured against recorded throw, and stratigraphic thicknesses increased in the basinward direction. This is in conformity with the general progradational nature of the Niger Delta basin. There also exist sharp differences in stratigraphic thickness between adjacent fault block indicating the strong influence of faulting in the creating and modification of accommodation space and sediment deposition. The isopach map of the stratigraphic intervals between Horizon 31.3 Ma-Horizon 29.3 Ma Figure 9ii records the interplay of structural deformation and sediment accumulation within this 2 Ma period. Growth strata thickness generally increased in the landwards direction with the greatest thickness recorded in the parts of the downthrown block closest to the fault. This shows the more proximal faults to be progressively more active during this period of the evolution of the study area. Accommodation space creation was greatest at these proximal locations and sediment depocenters are interpreted to be concentrated at these locations during that geologic period. The relatively large stratigraphic thickness recorded within this period of time suggests it to be the period of highest faulting activity compared to the periods spanned by the other mapped horizons in the study area. The minor fault in Fault Block C and G is interpreted to have evolved after 29.3 Ma as there are no marked growth strata against it within this interval (Figure 9). The two faults in the NW extreme of Fault Block F recorded a significant decrease in thickness of strata because of reduction in accommodation space creation occasioned by the sharing of the total throw accruable to the parent major fault about that location. The period 29.3 Ma-22.2 Ma showed a remarkable change in the fault activity and depositional pattern with the resultant increase in the stratigraphic thickness in the basinward direction (Figure 9iii). Fault activity increased in the distal direction and the recording of growth strata against the minor faults in Fault Blocks C and G indicates that they originated and evolved within this time. Higher fault throws are recorded toward the NW parts of the study area as all the faults blocks recorded greater stratigraphic thickness in that direction. This pattern is seen to reverse within the period 22.2 Ma-20.7 Ma (Figure 9iv). Within this 2.5 Ma period, stratigraphic thickness increase towards the SE direction indicating a general increase in fault displacement in that direction and a switch in the ‘local depocenter’ to that direction. Structural deformation is observed to decrease with age as fault activity (displacement and throw) and fault related folding tends to die out in younger horizons (Figures 7 and 9). This also has a direct influence on accommodation space creating such that sediment accumulation and stratigraphic thickness decreased with time as faulting activities grind to a holt.
Conclusions
A major feature of the hydrocarbon rich Niger Delta basin is the presence of sydepositional growth faults and associated roll-over anticlinal structures. These structures play a major role in the creation and modification of accommodation space for sediment accumulation. High influx of sediment into this basin also influences the nature, style and intensity of structural deformation at play. A sequence stratigraphic framework and structural model together with stratigraphic thickness analysis within and between regional horizons of interest, and fault blocks (isopach maps) were done and used to interpret the interplay between structural deformation and sediment deposition and accumulation in the study area. Results show that fault activity commenced well before 31.3 Ma and continued beyond 20.7 Ma. This structural deformation which appears to decrease with age has greatly influenced the creation and modification of accommodation space, and the deposition and accumulation of sediment in the basin. Generally, due to structural deformation and structurally induced accommodation creation, stratigraphic thickness is observed to have increased in the basinward direction, and at different stages in the structural evolution of the study area, ‘local depocenter’ have migrated to the NW (29.3 Ma- 22.2 Ma) and then to the SE (22.2 Ma -20.7 Ma) resulting also in lateral changes in stratigraphic thicknesses in these directions.
Acknowledgement
The authors wish to express their appreciation to the Shell Petroleum Development Company SPDC, Nigeria for the provision of data and equipments used in this research. This research work is part of a one year research internship activities of the first author who is very grateful to SPDC management and staff for this rare opportunity.
References
- Delhaya V, Ladipo K, Aigbe A, Ujowundu T, Busari O, et al. (2009) Seismic geomorphology of ancient submarine canyon systems: Implications for prospectivity of the Niger Delta. Nigeria EAGE Conference and Exhibition Amsterdam.
- Daily GC (1976) A possible mechanism relating progradation growth faulting clay diapirism and over thrusting in a regressive sequence of sediments. Bulletin of Canadian Petroleum Geology 24: 92-116.
- Khalivov NY, Kerimov AA (1983) Origin of mud volcanism and diapirism International Geological Review. 25: 877-881.
- Morley CK (1992) Notes on Neogene history of the western Alboran Sea and its implications for the tectonic evolution of the rif-Betic orogenic belt. Journal of African Earth Sciences 14: 57-65.
- Morley CK, Crevello P, Ahmad ZH (1998) Shale tectonics and deformation associated with active diapirism: The Jerudong anticline Brunei Darussalam. Journal of the Geological Society of London 155: 475-490.
- Rensbergen PV, Morley CK (2000) 3D study of a shale expulsion syncline at the base of the Champion delta off-shore Brunei and its implications for the early structural evolution of Large delta systems. Marine and Petroleum Geology 17: 861-972.
- Magbagbeola OA, Willis BJ (2007) Sequence stratigraphic and syndepositional deformation of the Agbada Formation Robertkiri field Niger Delta. Nigeria AAPG Bulletin 91: 945-958.
- Back S, Hooper C, Brundiers MB, Kukla PA (2006) Three-dimensional seismic coherency signature of Niger Delta growth faults: integrating sedimentation and tectonics. Basin Research 18: 323-337.
- Hooper RJ, Fitzsimmons RJ, Grant N, Vendeville BC (2002) The role deformation in controlling depositional patterns in the south-central Niger Delta. West Africa Journal of Structural Geology 24: 847-859.
- Imber J, Childs C, Nell PA, Walsh JJ, Hodgetts D, et al. (2003) Hanging wall fault kinematics and footwall collapse in listric growth fault system. Journal of Structural Geology 25: 197-208.
- Castelltort S, Pochat S, Van Den Driessche J (2004) Using T-Z plots as a graphical method to infer lithological variations from growth strata. Journal of Structural Geology 26: 1425-1432.
- Pochat S, Castelltort S, Van Den Driessche, Besnard JK, Gumiaux C, et al. (2004) A simple method of determining mining sand/shale ratios from seismic analysis of growth faults: an example from Upper Oligocene to Lower Miocene. Niger Delta deposits AAPG Bulletin 88: 1357-1367.
- Cohen HA, McClay K (1996) Sedimentation and shale tectonics of the northwestern Niger Delta. Front Marine and Petroleum Geology 13: 313-328.
- Doust H, Omatshola E (1990) Niger Delta in Edwards Divergent/passive margin basins AAPG memoir. 48: 201-238.
- Koledoye AB, Aydin AA (2000) Three-dimensional visualization of normal faults segmentation and its implication for faults growth. The Leading Edge, pp: 692-701.
- Damuth JE (1994) Neogene gravity tectonics and depositional processes on the deep Niger Delta. continental margins Marine and Petroleum Geology 11: 320-346.
- Corredor F, Shaw JH, Bilotti F (2005) Structural styles in the deep-water fold and thrust belts of the Niger Delta. American Association of Petroleum Geologists Bulletin 89: 753-780.
- Ejedawe (2007) An unpublished report on the Niger Delta submitted to SPDC Warri.
- Groshong RH (2006) 3D Structural Geology Second Edition Springer New York. p: 425.
- Olabode S, Matthew J, Won George, Udoekong O, Ibilola O, et al. (2010) Resolving the Structural Complexities in the Deepwater Niger-Delta Fold and Thrust Belt: A Case Study from the Western Lobe Nigerian Offshore Depobelt Search and Discovery.
Relevant Topics
Recommended Journals
- Oil & Gas Research Journal
- Renewable Energy and Applications Journal
- Oceanography Journal
- Industrial Pollution Control Journal
- Coastal Zone Management Journal
- Climatology & Weather Forecasting Journal
- Geoinformatics & Geostatistics Journal
- Engineering and Technology Journal
- Petroleum & Environmental Biotechnology Journal
- Polymer Sciences Journal
Article Tools
Article Usage
- Total views: 12581
- [From(publication date):
December-2016 - Apr 03, 2025] - Breakdown by view type
- HTML page views : 10968
- PDF downloads : 1613

