Research Article Open Access
Stiffness and Damping Simultaneous Identification Based on Extrapolation of Unrecorded Response to Ground Motion
Kojima K1, Kuwabara M2, Yoshitomi S3, Fujita K1 and Takewaki I1*1 Department of Architecture and Architectural Engineering, Kyoto University, Kyotodaigaku-Katsura, Nishikyo-ku, Kyoto 615-8540, Japan
2 NTT Urban Development, Tokyo 101-0032, Japan
3 Ritsumeikan University, Kusatsu 525-8577, Japan
- *Corresponding Asuthor:
- Takewaki I
Department of Architecture and Architectural Engineering
Kyoto University, Kyotodaigaku-Katsura
Nishikyoku, Kyoto 615-8540, Japan
Tel: 81-75-383-3294
Fax: 81-75-383-3297
E-mail: takewaki@archi.kyoto-u.ac.jp
Received January 03, 2013; Accepted January 23, 2014; Published January 31, 2014
Citation: Kojima K, Kuwabara M, Yoshitomi S, Fujita K, Takewaki I (2014) Stiffness and Damping Simultaneous Identification Based on Extrapolation of Unrecorded Response to Ground Motion. J Archit Eng Tech 3:117. doi:10.4172/2168-9717.1000117
Copyright: © 2014 Kojima K, et al. This is an open-access article distributed under the terms of the Creative Commons Attribution License, which permits unrestricted use, distribution, and reproduction in any medium, provided the original author and source are credited.
Visit for more related articles at Journal of Architectural Engineering Technology
Abstract
A new method is proposed for stiffness-damping simultaneous identification in a building structure when responses are recorded at only two stories, i.e. the base and the second floor. Uniqueness of stiffness and damping is guaranteed if the transfer function of the absolute acceleration (or displacement) at the second floor relative to the base is given. Stiffness and damping distributions can then be obtained by minimizing the error between two transfer functions, i.e. the ratio of records at the above-mentioned two floors in the frequency domain and the corresponding theoretical value of the system with assumed stiffness and damping. The stiffness and damping for the theoretical transfer function are evaluated by using identification functions through the extrapolation of unrecorded story responses. The validity of the proposed method is investigated through numerical examples.
Keywords
System identification; Shear building; Data extrapolation; Earthquake engineering.
Introduction
The System Identification (SI) technique plays important roles in structural health monitoring for damage detection. Various SI techniques using measured responses of building structures have been developed (see, for example, [1-11]). It is known that identification problems are often ill-posed due to noises and incompleteness in measurement.
In general, responses need to be measured at every floor above the target story for identification to evaluate the story shear force required in the stiffness-damping evaluation. Therefore, in order to identify physical parameters at the lowest story or at every story, responses at all stories are necessary. It is rather impractical to measure responses at every story from the viewpoint of instrumentation and data management, especially in high-rise buildings. However, limited location of measurement causes problems of non-existence or non-uniqueness of solution [12,13]. To avoid this difficulty, several approaches have been proposed. One approach is to alleviate the degree of ill-posedness using techniques such as the regularization technique [14]. Another approach is to certify the uniqueness of solution for the limited location of measurement.
In the latter approach, theories for unique identification of local stiffness and viscous damping coefficients at a specified target story are proposed based on the local response records at the floors just above and below a target story [12,15]. Furthermore, some methods for elimination of noise effects have been proposed [16,17] based on these theories. In these papers, the mathematical limit manipulation toward an infinite frequency or zero frequency has been introduced and simultaneous identification of local stiffness and damping can be performed in a unified manner and only an FFT technique is needed.
As for the identification of physical parameters at whole stories using limited local records, it has been shown that unique identification can be performed using both the limit manipulation toward an infinite frequency and recurrence equations when records at the base and the second floor are obtained [12]. In this paper, two new SI methods are proposed when the responses at the base and the second floor are obtained. These methods enable one to avoid the limit manipulation and use of recurrence equations and to overcome the difficulty in application to actually recorded data. The validity and effectiveness of the proposed methods are demonstrated through numerical examples using theoretical data in the frequency domain and time-history data.
Identification Method using Limit Manipulation
Identification of Stiffness and Damping Coefficient
The methods developed in [12,15] are explained here (Section 2) for the development of new theories in Sections 3 and 4.
Consider an N-story shear building model, as shown in Figure 1, with viscous damping. The node and element numbers are defined from the top. The jth node and the jth element from the top are called the “node j” and the “element j”, respectively. Let mj and kj denote the mass of the node j and the story stiffness of the element j and let cj be the viscous damping coefficient in the element j. The frequency-domain equations of motion for this shear building model subjected to the horizontal base acceleration  can be expressed by
A(ω)U(ω) = F(ω)Z(ω) (1)

Figure 1: Sensor location in past methods.
U(ω) and Z(ω) are the Fourier-transforms of the nodal absolute horizontal displacements u(t) and the base displacement z(t) , respectively. The vector F(ω) in Eq.(1) indicates 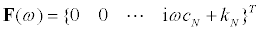 and the symbol
  means the transpose of a vector. The matrix A(ω) in Eq.(1) is defined by
A(ω) = −ω2M+ iωC+K (2)
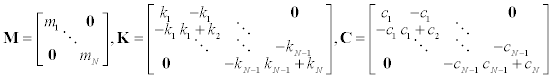 (3a-c)
where, i indicates the imaginary unit.
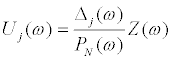
The jth component Uj(ω) in U(ω) can be obtained from Eq.(1) as
 (4)
(4)
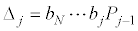
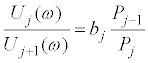
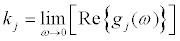
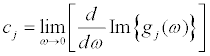
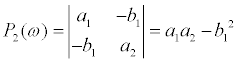
 is the determinant of the upper-left j × j sub-matrix of A(ω) and Δj(ω)is the determinant of the matrix obtained from A(ω) by replacing its jth column by F(ω) . The definitions of F ,Δj ,Pj together with bj(ω) = iωcj + kj provide the expression of Δj .
 (5)
(5)
It should be noted that the matrix for which Δj is defined has a tri-diagonal property only for j = N and ΔN can be expressed rather compactly. This property is closely related to the fact that the story stiffness of the element N and its material damping ratio can be identified uniquely when the acceleration  of the node N is observed in addition to the base acceleration .
Substitution of Eq.(5) into Eq.(4) provides the following relation.
 (6)
(6)
After some manipulations [15], the following relations can be derived.
 (7)
(7)
 (8)
(8)
 (9)
(9)
The stiffness can be obtained from Eq.(8) and the damping coefficient can be derived from Eq.(9) when the masses mj are given and the floor accelerations or displacements are recorded (see Figure 1a). In Eq.(7),  and
and  , Fourier transforms of the acceleration
  and the velocity
  at the jth floor, can be used instead of Uj(ω ).
Uniqueness of identification of structural parameters including unrecorded story
Uniqueness of stiffness and damping distributions is discussed here when there are some stories of unrecorded responses (see Figure 1b). The 2-story models with different sensor locations as shown in Figure 2 are used and stiffness and damper distributions are derived analytically for both models.

Figure 2: 2-story shear building models with different sensor locations.
Sensor location guaranteeing uniqueness of identification: As for the sensor location as shown in Figure 2a, i.e. sensors at the base and the second floor, it can be proved that a unique identification of stiffness and damping distributions is possible based on the recorded response data [12,15].
From Eq.(4), U1(ω) and U2(ω) can be expressed as
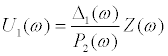 (10a)
(10a)
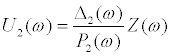 (10b )
From the definitions of Δj(ω) and Pj(ω) , Eqs.(11)–(13) can be obtained.
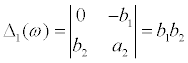 (11)
(11)
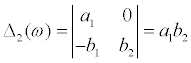 (12)
(12)
 (13)
(13)
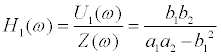
where 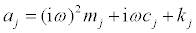 . Using Eqs.(10)-(13), the transfer functions H1(ω) and H2(ω) are expressed as follows.
 (14)
(14)
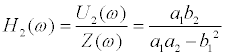
 (15)
(15)
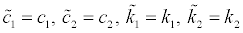
Here, two models with different sets of stiffness and damping coefficients, i.e 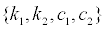 and
and  , are assumed and the corresponding transfer functions of these models are expressed as
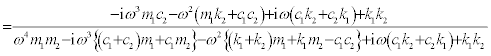
  and
and  , respectively. For the model shown in Figure 2a, H2(ω)can be evaluated from recorded response data. When H2(ω) is equal to
  , the following relation is obtained from Eq.(15).
 (16)
(16)
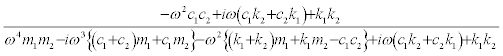
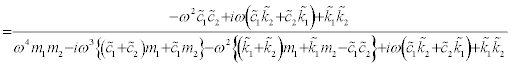
The left-hand side is equal to the right-hand side for every ω if and only if the following relations hold.
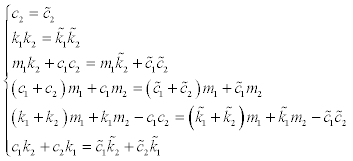 (17)
(17)
The following solution is then obtained which satisfies Eq.(17).
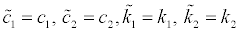 (18a-d)
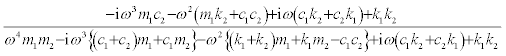
This means that, if the transfer function H2(ω) of the lowest story is given, there exists only one corresponding set of stiffness and damping coefficients. In this sensor location, the uniqueness of stiffness and damper coefficient distributions holds. This result holds also for the N-story structure [12]. In this paper, this sensor location is used later.
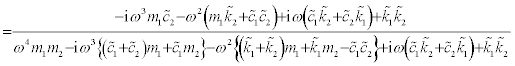
Sensor location without uniqueness: As for the sensor location shown in Figure 2b, i.e. sensors at the base and the top floor, it can be proved that the unique identification of stiffness and damping distributions is not possible from the recorded response data.
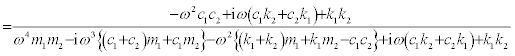
As in the previous section, two sets of stiffness and damping coefficients, i.e. , , and the corresponding transfer functions , are assumed. For the model in Figure 2b, H1(ω) can be evaluated from the recorded response data. When H1(ω) is equal to  , the following relation is obtained from Eq.(14).
 (19)
(19)
The left-hand side is equal to the right-hand side for every ω if and only if the following relations hold.
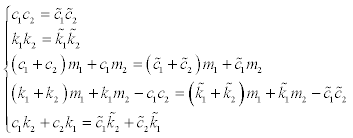 (20)
(20)
The following two solutions are obtained which satisfy the relations of Eq.(20).
 (21a-d)
 (22a-d)
where,
 (23 )
(23 )
This means that, if the transfer function H1(ω) of the top story is given, there exist two corresponding sets of stiffness and damping coefficients. It is therefore concluded that, in this sensor location, the uniqueness of stiffness and damper coefficient distributions is not guaranteed. In general, if the transfer function H1(ω) of the top story is given in the N-story model, it can be proved that there exists N! stiffness and damping coefficient distributions
Identification Method Based on Extrapolation of Unrecorded Data (Method 1)
In this section, a new identification method using extrapolation of unrecorded data is proposed when responses are recorded at the base and the second floor (see Figure 1b). This method is called “Method 1”.
Extrapolation of unrecorded data
A method is proposed for generating unrecorded data based on extrapolation. Here, a ratio L of the interstory drift to that of the lowest story is introduced. The conceptual figure is shown in Figure 3. Let define the following ratio Lj
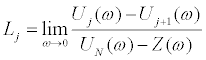 (24)
(24)

Figure 3: Ratios of interstory drifts.
Uj(ω) is a complex number and the limit value of Uj(ω)converges to a real number at frequency 0. Therefore, a real number is given to Lj. If all the parameters {Lj} are given, the approximate interstory drifts and displacements in the unrecorded stories can be obtained from the known valuesUN(ω)and Z(ω) by using Eqs. (25), (26).
 (25)
(25)
 (26)
(26)
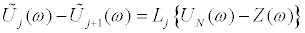
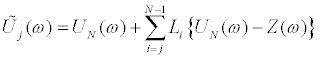
Here,  indicates the extrapolated data. It should be noted that Eqs.(25) and (26) are exact only at zero frequency. By substituting Eqs. (25), (26) into Eq.(7) and applying Eq.(8) to the resulting equation, Eq.(27) is obtained.
 (27)
(27)
Similarly by substituting Eqs. (25), (26) into Eq.(7) and applying Eq.(9) to the resulting equation, Eq.(28) is obtained.
 (28)
(28)
In general (non-stiffness-proportional one),  is not equal to
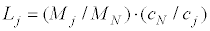
  . Therefore,Lj should be defined for stiffness and damping coefficients, independently.Lkj indicatesLj for identification of stiffness andLcj indicates that for identification of damping coefficient.
Here, LkN = 1, LcN = 1and  ,
,  should be assumed independently.
Identification method using extrapolated data
By using extrapolated response data in the previous section, unique identification of stiffness and damping coefficient distributions can be performed. The outline of the identification is shown in Figure 4. This method identifies the stiffness and damping coefficient distributions by determining ratios and . This requires to equate the estimated transfer function of the lowest story based on the extrapolated data to the actual transfer function.
A detailed algorithm of the proposed method is shown in Figure 5. When the ratios and are assumed, all the displacement can be estimated from Eq.(26), and by using these extrapolated data, identification can be performed by using Eqs.(7)- (9). When all the stiffness and damping coefficients can be obtained by substituting these values into Eq.(1), the transfer function of the lowest story can be estimated.

Figure 4: Concept of identification.

Figure 5: Flow chart of the proposed identification method using extrapolation.
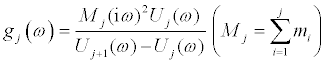
In general, this estimated transfer function constructed from extrapolated data is different from the actual transfer function constructed from recorded data. According to the discussion in Section 2.2.1, these two functions are equal if and only if the true distributions of stiffness and damping coefficients are used. When actual recorded data are used, it is difficult to guarantee the equality of these two functions exactly. Therefore, let us define a function f(L) in Eq.(29) to estimate the error between these two transfer functions. Here, 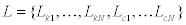 .H N (ω)is a target transfer function estimated from recorded data Z(ω) and UN(ω) is an assumed transfer function estimated from L. The equality of these two functions is guaranteed by minimizing the following value of f(L) .
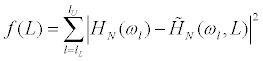 (29)
(29)
where lL and lU indicate the number related to the lower limit circular frequency ωL and the upper limit circular frequency ωU to estimate the error between two transfer functions.
Numerical examples
Investigation using theoretical data in frequency domain: The validity of “Method 1” is investigated here through numerical examples using theoretical data in the frequency domain. The input Z(ω) at the base is set to Z(ω) =1 in all the frequency range and estimateUj(ω) by Eq.(1). In this section, Z(ω) andUN(ω)are used as known recorded data.
As for the 2-story model shown in Table 1, functions to define Lkj ,Lcj are shown in Figure 6 which use the exact response Uj(ω). From Figure 6, the exact values are obtained as Lk1 =0.5 , Lk2 =1.0 , Lc1 = 0.5, Lc2 = 1.0. When the extrapolation is performed using these exact values, identification functions are estimated as shown in Figure 7. From Figure 7, the limit values of identification functions at frequency 0 converge to the exact values of stiffness and damping coefficients. Figure 8 shows the function f (L) whenLk2 andLc2 are set to 1.0 and Lk1 andLc1 are set independently in a range of 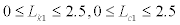 This figure indicates that the function f(L) has the minimal value only when Lk1 =0.5 , Lc1 = 0.5 , and these are the exact values.
| Node and Element number j | mj [kg] | cj[Ns/m] | kj [N/m] |
|---|---|---|---|
| 1 | 1.0×10⁵ | 1.0×10⁶ | 1.0×10⁹ |
| 2 | 1.0×10⁵ | 1.0×10⁶ | 1.0×10⁹ |
Table 1: 2-story model.

Figure 6: Ratios of interstory drifts corresponding to Lkj and Lcj.

Figure 7: Identification function (Eqs.(8), (9)).

Figure 8: Function f(L).
In the examples of this paper, the optimization is performed by using the SQP. Design variables and their initial values are set as 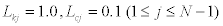 and the ratios LkN, LcN of the lowest story are set to 1.0. kN and cN of the lowest story can be identified from Eqs.(7)-(9) using the known response Z(ω) and UN(ω). Therefore, in the numerical examination below, it is assumed that kN and cN can be identified exactly.
The result of the identification for the 2-story model based on the “Method 1” is shown in Table 2. It can be observed that the identification based on “Method 1” has been performed effectively. Figure 9 shows the transfer functions of the lowest story using given data Z(ω) and UN(ω)and using the identified stiffness and damping coefficients. Two functions coincide with high accuracy.
| Exact value | Identified value (Method 1) | ||
|---|---|---|---|
| Lk | Lk1 | 0.50000000 | 0.50000005 |
| Lk2 | 1.00000000 | 1.00000000 | |
| Lc | Lc1 | 0.50000000 | 0.49999999 |
| Lc2 | 1.00000000 | 1.00000000 | |
| Stiffness [N/m] | K1 | 1000000000 | 1000000014 |
| K2 | 1000000000 | 1000000000 | |
| Damping coefficient [Ns/m] | c1 | 1000000.000 | 1000000.004 |
| c2 | 1000000.000 | 1000000.000 | |
| f(L) | 4.5242×10⁻¹¹ | ||
Table 2: Result of identification (2-story model, ��?Method 1�).

Figure 9: Target transfer function and identified transfer function (2-story model, ��?Method1�).
The above-mentioned 2-story model has proportional damping. The “Method 1” is then applied to a 5-story model with non-proportional damping shown in Table 3. The result of the identification is shown in Table 5 which indicates that the “Method 1” can identify the stiffness and damping coefficients of all the stories with high accuracy using only two given response data.
| Node and Element Number j | mj [kg] | cj [Ns/m] | kj [N/m] |
|---|---|---|---|
| 1 | 1.0�?�?105 | 1.0�?�?106 | 1.0�?�?109 |
| 2 | 1.0�?�?105 | 1.0�?�?106 | 1.0�?�?109 |
| 3 | 1.0�?�?105 | 1.0�?�?106 | 1.0�?�?109 |
| 4 | 1.0�?�?105 | 1.0�?�?106 | 1.0�?�?109 |
| 5 | 1.0�?�?105 | 1.0�?�?106 | 1.0�?�?109 |
Table 3: 5-story model.
Investigation using simulated time-history data: The validity of “Method 1” is investigated through numerical examples using simulated time-history data. The input at the base is generated as a band-limited white noise as shown in Figure10. A time-history response analysis is performed using and the responses  are obtained. and are used as the known recorded data. Fourier transforms of and provide
  and
and  . In “Method 1”,
  are estimated by extrapolating these given data. Furthermore stiffness and damping coefficients should be identified by using the identification function of Eqs.(8), (9). Figure 11 indicates an identification function in the lowest story of the model shown in Table 1. This figure was obtained by applying and to Eq.(8). This figure shows that the identification function using time-history data converges to 0 at frequency 0 because of the unfavorable effect of noise. Therefore, some approximation methods may be necessary to estimate the limit value and it is difficult to use time-history data directly in “Method 1”. In the next section, another identification method without the limit value is proposed.

Figure 10: Band-limited white noise.

Figure 11: Identification function for stiffness.
Identification Method Based on Direct Estimation of Physical Parameters
Identification method without limitmanipulation
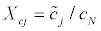
The second approach foridentification is proposed in this section when responses are recorded at thebase and the second floor. This method is called "Method 2". Thismethod does not use extrapolation and directly identify the physical parameters,i.e. stiffness and damping coefficients. Let us introduce thefollowing ratios  and
and  .
.
 (30)
(30)
 (31)
(31)
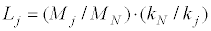
where, kN and cN can be identified by applying recorded data Z(ω) , UN ω)to Eqs.(7)-(9). XkN and XcN are equal to 1 and  can be specified independently.
A detailed algorithm of the proposed method is shown in Figure 12. When the ratios  and
and  are assumed, all the stiffness and damping coefficients can be obtained. By substituting these values into Eq.(1), the transfer function of the lowest story can be estimated. As discussed in Section 3.2, a function f(X ) is defined by Eq.(32) to estimate the error between two transfer functions. Here,
  .HN(ω)is the target transfer function estimated from recorded data Z(ω) and UN(ω).
  is an assumed transfer function estimated from X. The following function f(X ) is minimized so as to make these two functions nearly equal.
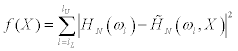 (32)
(32)

Figure 12: Flow chart of the proposed identification method without extrapolation.
The characteristics of the “Method 2” are that stiffness and damping coefficients are used directly as the design variables in the process of optimization and the limit manipulation for frequency 0 is not necessary.
Numerical examples
Investigation using theoretical data in frequency domain: In this section, the validity of “Method 2” is investigated through numerical examples using theoretical data in the frequency domain. An input Z(ω) at the base and responsesUj(ω) are given by the same procedure in Section 3.3.2. In this section, Z(ω) andUN(ω)are used as known recorded data.
As for the “Method 2”, the design variables and their initial values are set as Xkj = 0.2, Xcj = 0.1  and the ratios XKN , XCN ofthe lowest story are fixed to 1.0. In the numerical examination below, it is assumed that kN and cN can be identified exactly and the optimization is performed by the same procedure as in Section 3.3.
The result of identification for the 2-story model (Table 1) is shown in Table 5. The result of identification for the 5-story model (Table 3) is shown in Table 6. These tables indicate that “Method 2” can identify stiffness and damping coefficients of all the stories based on only two given response data with a high accuracy comparable to “Method 1”.
Investigation using simulated time-history data: The validity of “Method 2” is investigated here through numerical examples using simulated time-history data. An input at the base is generated as a band-limited white noise. A time-history response analysis is performed for . and are then used as known recorded data. It is assumed here that kN and cN can be identified exactly from the recorded data by using Eqs.(8), (9) and the optimization is performed by the same procedure as in section 4.2.1.
The frequency range of Eq.(32) affects the result of identification. The upper bound of frequency ωU is varied every 10rad/s and the value corresponding to the lowest objective function f(X ) is used. The frequency ωU is 170rad/s for the 2-story model and 180rad/s for the 5-story model.
The results of identification for the 2-story and 5-story models are shown in Table 7. “Method 2” has a better performance because of avoiding the limit manipulation. The accuracy of the 2-story model is higher than that of the 5-story model and the value of f(X ) are greater than that in Tables 4,5 and 6 using theoretical data in the frequency domain. Figures 13 and 14 show the target transfer function and the identified transfer function at the lowest story corresponding to the 2-story and 5-story models, respectively. In both figures, the difference between two transfer functions increases in higher frequency range. To investigate this error, two transfer functions of the 2-story model estimated by a different approach is shown in Figure 15, i.e. the transfer function estimated using theoretical data in the frequency domain and the transfer function estimated using time-history data. Figure 15 indicates that the difference between two functions increase in higher frequency range. The validity of “Method 2” depends on the assumption that these two functions are considered to be equal with sufficient accuracy. By improving the performance in this accuracy problem, the identification based on “Method 2” is expected to be useful.
| Exact value | Identified value (Method 1) | ||
|---|---|---|---|
| Stiffness [N/m] | k1 | 1000000000 | 1000000008 |
| k2 | 1000000000 | 999999991 | |
| k3 | 2000000000 | 2000000003 | |
| k4 | 2000000000 | 2000000023 | |
| k5 | 3000000000 | 3000000000 | |
| Damping coefficient [Ns/m] | c1 | 1000000.000 | 1000000.110 |
| c2 | 1000000.000 | 999999.928 | |
| c3 | 1000000.000 | 1000000.104 | |
| c4 | 1000000.000 | 1000000.060 | |
| c5 | 1000000.000 | 1000000.000 | |
| f(L) | 1.7468×10⁻¹¹ | ||
Table 4: Result of identification (5-story model, ��?Method 1�).
| Exact value | Identified value (Method 2) | ||
|---|---|---|---|
| Stiffness [N/m] | k1 | 1000000000 | 999999992 |
| k2 | 1000000000 | 1000000000 | |
| Damping coefficient [Ns/m] | c1 | 1000000.000 | 999999.992 |
| c2 | 1000000.000 | 1000000.000 | |
| f(X) | 1.0590×10⁻¹¹ | ||
Table 5: Result of identification (2-story model, ��?Method 2�).
| Exact value | Identified value (Method 2) |
||
|---|---|---|---|
| Stiffness [N/m] |
k1 | 1000000000 | 1000000130 |
| k2 | 1000000000 | 999999853 | |
| k3 | 2000000000 | 2000000098 | |
| k4 | 2000000000 | 2000000077 | |
| k5 | 3000000000 | 3000000000 | |
| Damping coefficient [Ns/m] |
c1 | 1000000.000 | 1000000.133 |
| c2 | 1000000.000 | 1000000.000 | |
| c3 | 1000000.000 | 1000000.244 | |
| c4 | 1000000.000 | 999999.868 | |
| c5 | 1000000.000 | 1000000.000 | |
| f(X) | 2.3254×10⁻¹¹ | ||
Table 6: Result of identification (5-story model, ��?Method 2�).
| Model | Element number j | f(X) | |||||
|---|---|---|---|---|---|---|---|
| 1 | 2 | 3 | 4 | 5 | |||
| 2-story model | Error of kj (%) | -6.67 | 0 | - | - | - | 458.8 |
| Error of cj (%) | +8.71 | 0 | - | - | - | ||
| 5-story model | Error of kj (%) | -12.9 | +19.7 | +3.83 | -13.4 | 0.0 | 472.1 |
| Error of cj(%) | +50.0 | +50.0 | -25.0 | -11.4 | 0.0 | ||
Table 7: Identification error from the exact value.

Figure 13: Target transfer function and identified transfer function (2-story model, ��?Method 2�).

Figure 14: Target transfer function and identified transfer function (5-story model, ��?Method 2�).

Figure 15: Comparison between transfer functions based on theoretical data in frequency domain and corresponding transfer function based on time-history data (2-story model).
Conclusions
In order to overcome the difficulties in the past work [12] in which stiffness and damping coefficients are identified uniquely when responses at the base and the second floor are obtained, more practical and stable physical-parameter SI methods called “Method 1” and “Method 2” have been proposed in this paper.
The advantageous features of these methods can be summarized as follows:
i. These methods enable identification by minimizing the error between the target transfer function and an assumed transfer function. The target transfer function is estimated directly from recorded data. The assumed transfer functions are estimated in a different way in each method. This approach is based on the uniqueness of identification proved in the previous paper [12] and it enables one to avoid the process to solve the recurrence equation.
ii. “Method 1” uses the extrapolation of unrecorded responses in the frequency domain. By introducing the ratios among interstory drifts, unrecorded data (floor acceleration or displacement) can be extrapolated. Applying the previously proposed SI method with limit manipulation [15,16] to these extrapolated data, physical parameters can be obtained at all stories. Based on these assumed physical parameters, the transfer functions can be calculated. Then optimization is performed to minimize the error between the target transfer functions and assumed transfer functions with the ratios among interstory drifts as the design parameters.
iii. The validity of the proposed method, “Method 1”, has been investigated numerically. When the theoretical data in the frequency domain is used, SI is performed with sufficiently high accuracy. However, when the time-history data are used, the limit manipulation is difficult to perform because of the effect of noise in the low frequency range.
iv. To overcome the difficulty in the limit manipulation, “Method 2” has been proposed. This method enables one to avoid the extrapolation of data and the limit manipulation by regarding directly the physical parameters as the design variables. Optimization has been introduced to minimize the error between the target transfer function and an assumed transfer function with the physical parameters as the design parameters.
v. The validity of the proposed method, “Method 2”, has been investigated. When the theoretical data in the frequency domain is used, SI can be performed with the accuracy comparable to the “Method 1”. Furthermore, when the time-history data are used, this method is able to perform SI very well. However, the deterioration of the accuracy is caused by the error between two transfer functions, i.e. the transfer function estimated using theoretical data in the frequency domain and the transfer function estimated using time-history data.
Acknowledgements
Part of the present work is supported by the Grant-in-Aid for Scientific Research of Japan Society for the Promotion of Science (No.24246095, No.25630233). This support is greatly appreciated.
References
- Beck JL, Jennings PC (1980) Structural identification using linear models and earthquake records.Earthquake EngStruc 8: 145-160.
- Doebling SW, Farrar CR, Prime MB,ShevitzDW (1996) Damage identification and health monitoring of structural andmechanical systems from changes in their vibration characteristics: A literaturereview. Los Alamos National Laboratory: LA-13070-MS.
- Ghanem R,Shinozuka M (1995) Structural-system identification. I: Theory. JEngMech 121: 255-264.
- Hjelmstad KD (1996) On the uniquenessof modal parameter estimation. J Sound Vib 192: 581-598.
- Hong KS, Yun CB (1993) Improved method for frequency domain identifications of structures.EngStruct15: 179-188.
- Hoshiya M, Saito E (1984) Structuralidentification by extended Kalman filter. J EngMech 110: 1757-1770.
- Koh CG, See LM,Balendra T (1995) Determination of storey stiffness of three-dimensional frame buildings.EngStruct17: 179-186.
- Masri SF, Nakamura M, Chassiakos AG, CaugheyTK (1996)A neural network approach to the detection of changes in structuralparameters. J EngMech 122: 350-360.
- Safak E (1989) Adaptive modeling,identification, and control of dynamic structural systems I: Theory. JEngMech115: 2386-2405.
- Yao JTP, Natke HG (1994) Damagedetection and reliability evaluation of existing structures. StructSaf 15:3-16.
- Takewaki I, Nakamura M, Yoshitomi S(2012) System Identification for Structural Health Monitoring, WIT Press (UK).
- Udwadia FE, Sharma DK, Shah PC (1978) Uniqueness of damping and stiffness distributions in the identification of soiland structural systems. J ApplMech45: 181-187.
- Minami Y, Yoshitomi S,Takewaki I(2013) System identification of super high-rise buildings using limitedvibration data during the 2011 Tohoku (Japan) earthquake. Structural ControlHealth Monitoring 20: 1317-1338.
- Kang JS, Park SK, Shin S, Lee HS(2005) Structural system identification in time domain using measuredacceleration. J Sound Vib 288: 215-234.
- Takewaki I, Nakamura M (2000) Stiffness-damping simultaneous identification using limited earthquake records.Earthquake EngStruct29:1219-1238.
- Takewaki I, Nakamura M (2005) Stiffness-dampingsimultaneous identification under limited observation. J EngMech 131:1027-1035.
- Yoshitomi S,TakewakiI (2009) Noise-bias compensation in physical- parameter system identification undermicrotremor input.EngStruct 31: 580-590.
Relevant Topics
- Architect
- Architectural Drawing
- Architectural Engineering
- Building design
- Building Information Modeling (BIM)
- Concrete
- Construction
- Construction Engineering
- Construction Estimating Software
- Engineering Drawing
- Fabric Formwork
- Interior Design
- Interior Designing
- Landscape Architecture
- Smart Buildings
- Sociology of Architecture
- Structural Analysis
- Sustainable Design
- Urban Design
- Urban Planner
Recommended Journals
Article Tools
Article Usage
- Total views: 14689
- [From(publication date):
March-2014 - Apr 04, 2025] - Breakdown by view type
- HTML page views : 10078
- PDF downloads : 4611