Research Article Open Access
Status of Copper and Zinc in Biotic and Abiotic Components of Karwar Waters Central West Coast of India
Smruta Phal1* and JL Rathod21Department of Marine Biology, Karnataka University, Post Graduate Centre, Kodibagh, Karwar-581303, Karnataka, India
2Department of Marine Biology, Karnataka University, Post Graduate Centre, Kodibagh, Karwar-581303, Karnataka, India
- *Corresponding Author:
- Smruta Phal
Research Scholar, Department of Marine
Biology, Karnataka University, Post Graduate Centre
Kodibagh, Karwar-581303, Karnataka, India
Tel: +919480562928
E-mail: Sphal123@gmail.com
Received date: June 23, 2015; Accepted date: November 27, 2015; Published date: December 02, 2015
Citation: Phal S, Rathod JL (2015) Status of Copper and Zinc in Biotic and Abiotic Components of Karwar Waters Central West Coast of India. J Marine Sci Res Dev 5:174. doi:10.4172/2155-9910.1000174
Copyright: © 2015 Phal S, et al. This is an open-access article distributed under the terms of the Creative Commons Attribution License, which permits unrestricted use, distribution, and reproduction in any medium, provided the original author and source are credited.
Visit for more related articles at Journal of Marine Science: Research & Development
Abstract
The present study was undertaken to study the concentration of Copper and Zinc in the water, sediment and important edible bivalves for a period of 6 months from January 2011 to June 2011. The concentration of copper in water sample at Majali was within the permissible limit (0.05 ppm as per BIS standards), it was (0.23 ppm) in the month of March and May at Devbagh, it was beyond the permissible limit (0.05 ppm) at Majali. In the case of Zinc, the highest concentration observed during May was (0.09 ppm) at Majali and (0.07 ppm) at Devbagh which is far below the permissible limits (5.0 ppm). In case of sediment samples the concentration of Cu was within the permissible limit (which is between 2.0-4.0 mg/L as per FEPA) the highest concentration was (0.39 ppm) in the month of January at Majali and (0.238 ppm) in the month of March at Devbagh, the limit of Zn was also within the permissible limit which is (50 mg/L according to FEPA) 0.09 ppm at Majali and 0.09 ppm at Devbagh. In Paphia malabarica and Mactra violaceae, concentration of Zn and Cu was within the permissible limit ((According to Standard Oyster tissue 156a which is 66.30 ± 4.30 mg/g for Cu and 830 ± 57 mg/g for Zn) highest concentration of Cu in Paphia malabarica was observed (0.4367 ppm) in the month of January at Majali followed by (0.267 ppm) of Zn in the month of June. In Mactra violaceae, the highest concentration of Cu was recorded in the month of January (0.476 ppm) followed by (0.297 ppm) of Zn in the month of June at Majali.
Keywords
Mactra violaceae; Paphia malabarica; Copper; Zinc; Karwar ppm
Introduction
Metals are generally the components found in the earth’s environment in a certain amount. These elements in trace amounts are very beneficial but can cause harm when present in excess. Due to the human interference the bioaccumulation of such elements in the biotic components has increased many folds. In today’s world, many constituents are used for easy sustainability which contain these harmful elements and enter the ecosystem in bulk and are responsible for many ill effects on the biota. Sediments are one of the important abiotic components in the aquatic ecosystem. It has the important quality to withhold certain element like trace metals on which certain organisms are dependent primarily or secondarily. Sediment because of it this quality can be an important indicator of certain pollution [1-4]. Thus the sediment plays a very important role in determining the state of the ecosystem. Vertical profiles of pollutant species in sediment cores have been commonly used as “pollution records” over the last decades [5]. These bivalves feeds on benthic assemblage, there is possibility of accumulation of undesirable elements in these organisms [6,7].
Study area
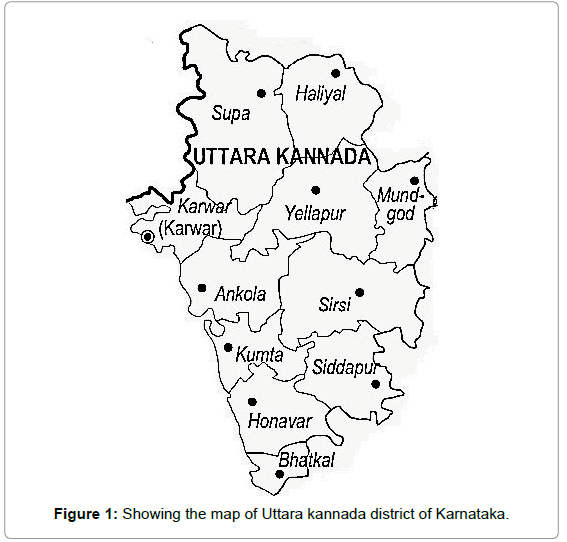
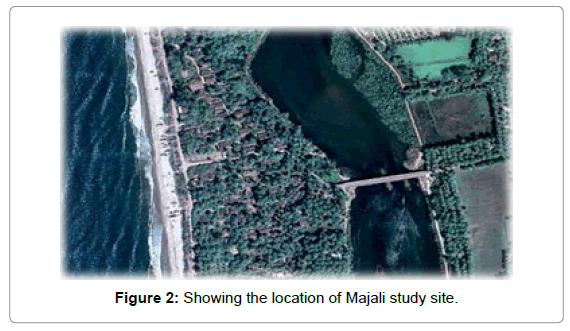
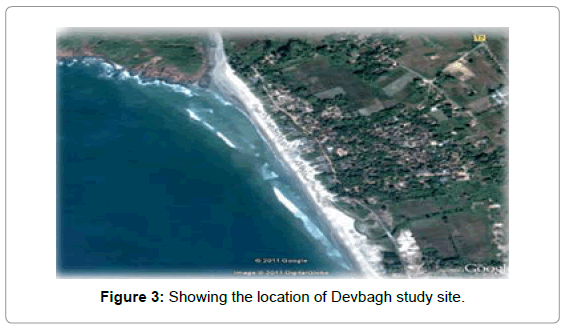
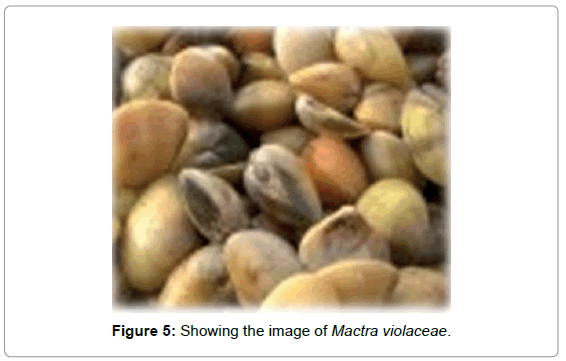
The present study was carried out at two places Majali and Devbagh. Majali is located 14 kilometers away from the Karwar city; this is one of the important fishing places and located at border of Goa and Karnataka. Fishing is the main occupation for most of the people of this area. The beach of this area is about 4 kilometers, the position of this area i.e., Latitude is 14°53’ 46.50”N and Longitude 74°5’ 51.65”E. Another study site selected for study is Devbag area, which is hardly one kilometer away from Devbag beach resort operated by Jungle Lodges and Resorts of forest Department of Karnataka (Figures 1-5). There is creek which forms very good natural habitat for many mangrove plants and aquatic organisms of ecological importance. This area is 7 kilometers away from first station towards southern side.
Materials and Methods
The present study was carried out for a period of 6 months, for which water, sediment and Clams (Mactra violaceae, Paphia malabarica) were collected every month. Water sample was collected in a 250 ml bottle, 2 ml HNO3 was added to it and kept at 2°C until analysis. About 1 gm of the sediment sample was collected and 5 ml Chloroform was added and stored until analysis [8,9]. The clams were collected manually and stored. These samples were then digested and treated with HNO3 and Perchloric acid to get the suitable concentrate for analysis of trace metals. The samples were analyzed by using Perkin Elmer atomic absorption spectrophotometer at Solaris Chemtech Industry, Binaga. The atomic absorption spectrometry quantifies the absorption of ground state atoms in the gaseous state. The atoms absorb ultraviolet or visible light and make transitions to higher electronic energy levels. The analyte concentration is determined from the amount of absorption. The results were expressed in parts per million (ppm).
Result and Discussion
Copper
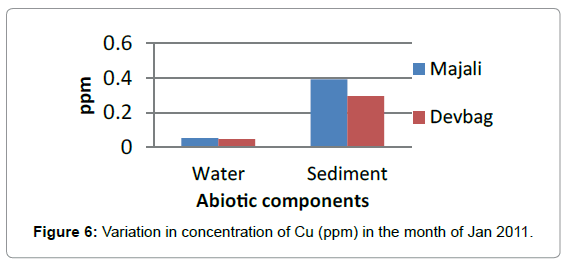
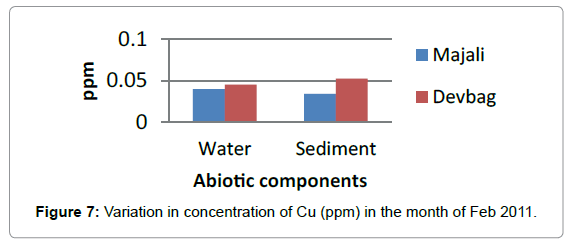
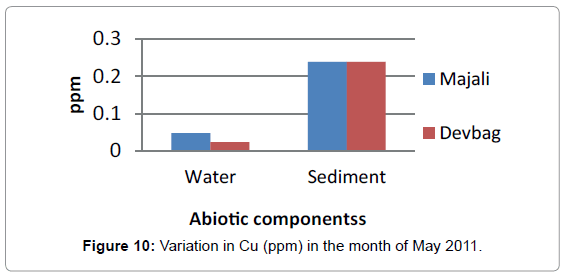
**During present observation concentration of Copper in the month of January in the water sample was (0.052) at Majali, it was low in the month of February (0.039 ppm) (Figures 6 and 7). Then there was a slight increase in the month of March (0.047 ppm) and remained same in the month of April and May. Then it decreased in the month of June (0.18 ppm).**
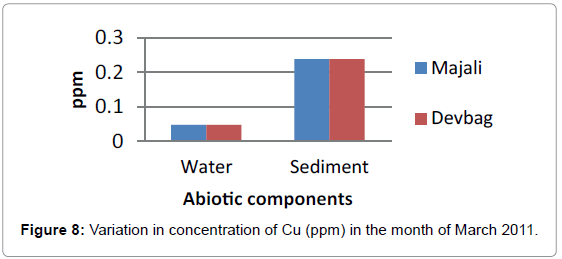
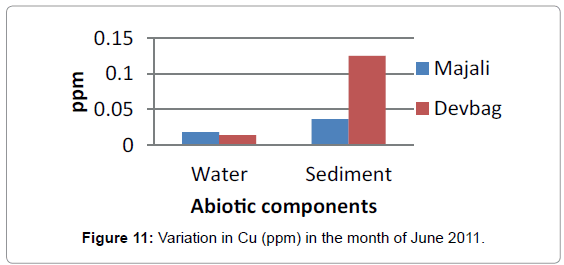
In the sediment sample at Majali, the concentration of copper in sediment was high compared to water sample (0.393 ppm) in the month of January, then it decreased in the month of February (0.034 ppm), then in the month of March there was a slight rise (0.238 ppm) (Figure 8), then absent in the month of April, then again it appeared in the month of May with a slight increase (0.238 ppm) and later a decrease in the month of June (0.036 ppm).
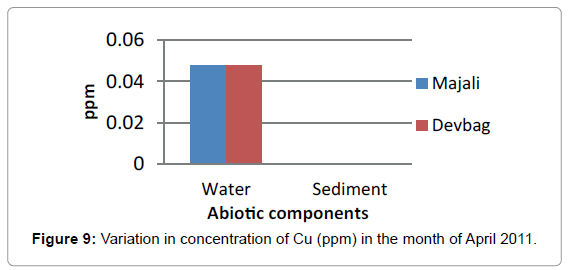
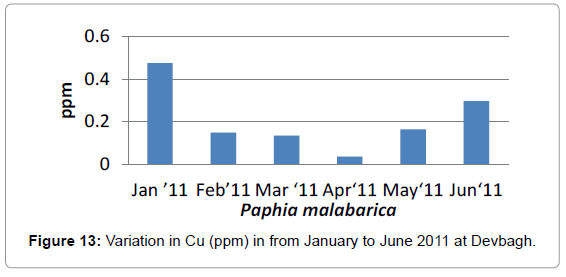
At Devbagh, the concentration of Copper in the water sample in the month of January was (0.046 ppm), it was (0.045 ppm) in the month of February and (0.047 ppm) in the month of March and April (Figure 9). It was (0.023 ppm) in the month of May and (0.013 ppm) in the month of June. In the sediment samples ,the concentration in the month of January was ( 0.29 ppm) ,then it decreased to (0.05 ppm) in the month of February then increased in the month of March (0.238 ppm) and was 0 in the month April (Figures 10 and 11), it was (0.023 ppm) (Figures 12 and 13) in the month of May and (0.125 ppm) in the month of June.
Zinc
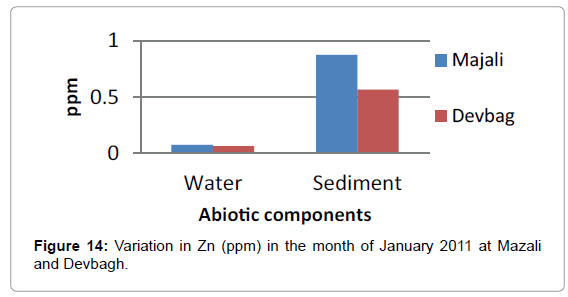
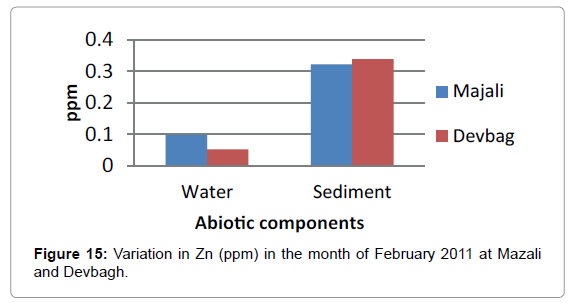
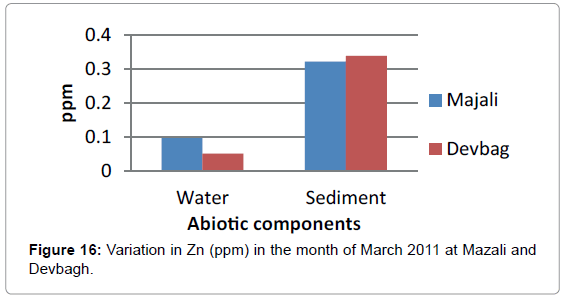
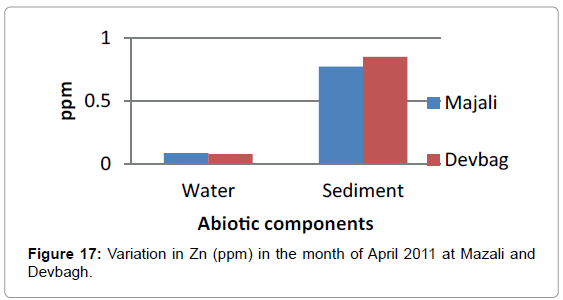
The concentration of Zinc in the water sample at Majali in the month of January was (0.076 ppm), then it increased in the month of February (0.0966 ppm) then there was a slight decrease (0.085 ppm) in the month of March (Figures 14 and 15). Then in the month of April it was (0.031 ppm).Then a slight increase in the month of May (0.085 ppm) and decreased in the month of June (0.015 ppm). The concentration of Zinc in the sediment sample was (0.875 ppm) in the month of January, then (0.321ppm) in the month of February, then it was (0.775 ppm) in the month of March, April and May, then it was (0.05 ppm) in the month of June (Figures 16 and 17).
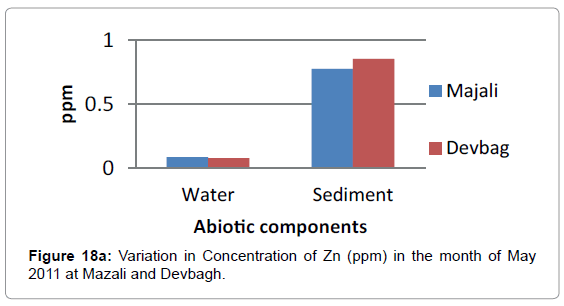
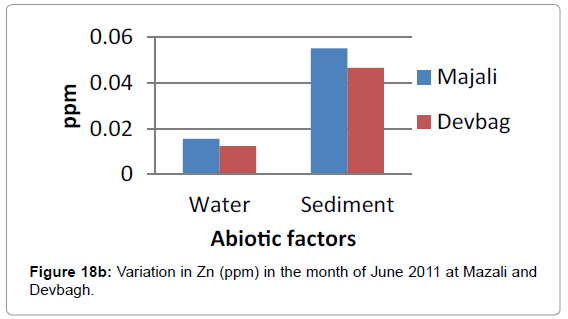
At Devbagh, the concentration of zinc in water sample was (0.065 ppm) in the month of January and (0.051 ppm) in the month of February and a slight increase (0.0775) ppm in the month of March, (0.007 ppm) in the month of April and (0.0775 ppm) in the month of May and (0.012 ppm) in June (Figures 18a,18b and 19).
In the sediment sample, the concentration of Zinc in the month of January was (0.567 ppm) and (0.3381ppm) in the month of February In the month of March it was (0.852 ppm), it was (1.007 ppm) in April which was the highest in all the months. It was (0.8527 ppm) in the month of May and (0.04 ppm) in June (Figure 20).
Copper
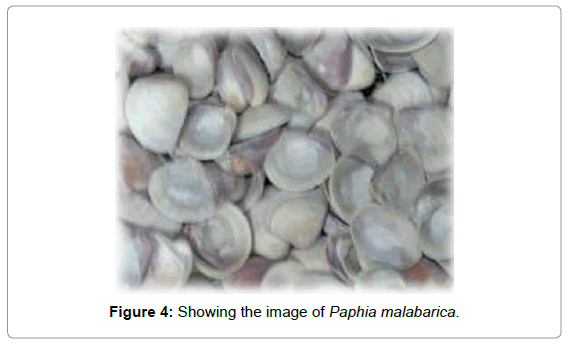
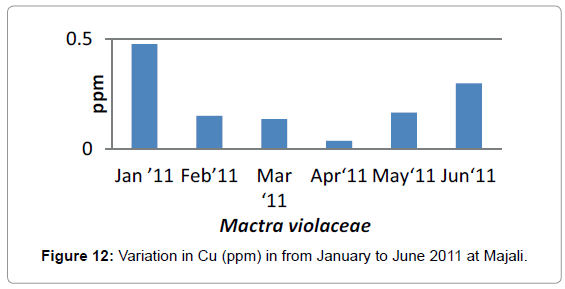
In the case of, paphi malabarica of Majali area the concentration of these metals were very high compared to water and sediment samples.
In the case of Copper, It was (0.04 ppm) in the month of January, (0.14 ppm) in the month of February, it was (0.13 ppm) in the month of March, it was (0.13 ppm), in April it was (0.03 ppm) it was (0.16 ppm) in the month of May and it was (0.29 ppm) in the month of June.
Zinc
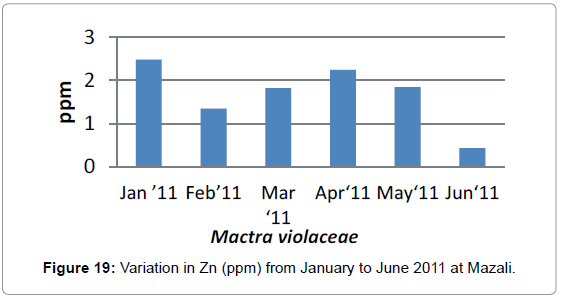
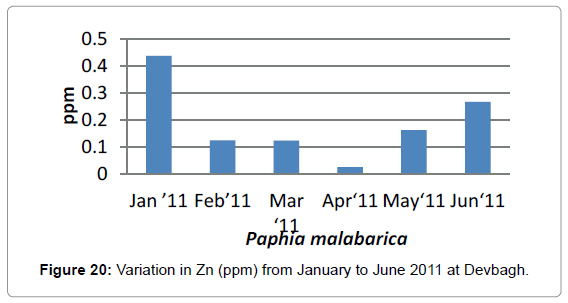
In the case of Zinc, the concentration was highest in the month of January (2.48 ppm) which decreased in the month of February (1. 3 ppm) than it was (1.8 ppm) in the month of March and increased further in the April (2.24 ppm) it was second highest concentration recorded then it again decreased in the month of May (1.8 ppm) and was lowest in the month of June (0.4 ppm).
In Mactra violaceae, found at Devbagh, the concentration in the month of January was (0.43 ppm) followed by (0.12 ppm) in the month of February and March then a decrease of (0.02 ppm) in the month of April and (0.1 ppm) in May and (0.2 ppm) in the month of June.
In the case of Zinc, the highest concentration was observed in the month of January (2.5 ppm) followed by a decrease in February (1.2 ppm) and (1.5 ppm) in the month of March and (1.8 ppm) in the month of April then an increase was noticed in the month of May (2.3 ppm) and then a decline in the month of June. Zinc can enter the water bodies from a number of sources including industrial effluent, sewage effluents and runoff (Boxall et al. 2000).
Statistical analysis
In the present study Anova was conducted in order to know the significance. At station 1, Majali, there was no significant difference for both Copper and Zinc in both water and sediment. In the case of Paphia malabarica a significant difference was observed in the case of copper 0 concentration which was 0.03<p, p=0.05 and also in the case of Zinc which was 0.001<p, p-=0.05. At Devbagh, no significant difference was observed in copper and zinc concentration in both water and sediment. In the case of Mactra violaceae at Devbagh, a significant difference was observed in Copper content which was 0.043494<p, p=0.05 and Zinc also showed a significant difference of 0.003469<p, p=0.05.
Conclusion
The results show that there was very low concentration of said metals than permissible for Cu, Zn) concentration of Copper and Zinc in the water and sediment components, this may be because of non-availability of industries in that area. The presence of these metals may be mainly due to the anti-corrosive and anti-fouling paints used to protect the hull portion of the boat and natural activities like weathering of rocks and erosion of soils. In the case of bivalves Paphia malabarica and Mactra violaceae, the concentration of Zinc is more because these organisms mainly feeds on sediments, the Zinc content is mainly present in the paints used for the protection of the hull and other domestic and electrical appliance which are discarded in to the sea after use without any prior treatments these organisms have tendency to bio accumulate.
There was observed an metal-metal interaction in some bivalves (Flower et al.).
Acknowledgement
Authors sincerely thank UGC New Delhi for providing financial assistance in the form of Major Research Project to carry the work and also Solaris Chemtech, Binaga, Karwar for helping in sample analysis.
References
- Forstner U, Salomons W (1980) Trace metal analysis in polluted sediments, part I. Assessment of source and intensities.Environ technol Letters 1: 494-505.
- Angelidis MO, Aloupi M (2000) Geochemical study of coastal sediments influenced by river transported pollution: Southern Evoikos Gulf, Greece. Mar Poll Bull 40: 77-82.
- Bhat, Neelkanthan B(1991) Hydrobiologicalconditions of the surface waters of Kali Estuary, Karwar. Environment and Ecology 1:37-46.
- BhosaleU, Sahu KC (1991) Heavy metal pollution around the island city of Bombay, India. Part II: distribution of heavy metals between water, suspended particles and sediments in a polluted aquatic regime.ChemGeol90:285-305.
- Forstner U, Wittmann GTW (1979) Metal pollution in the aquatic environment. Springer-Verlag, Berlin, Germany 257.
- Jadhav(1990)Studies on the distribution of trace metals in the coastal waters of Karnataka. M.Sc.Dissertation thesis, submitted to karnatak University, Dharwad157.
- Krishnakumar PK, Bhat GS (1988) Heavy metal distribution in the biotic and abiotic matrices along the Karnataka coast, West coast of India. Indian J of Mar Sci27:201-205.
- Phillips DJH (1977) The use of biological indicator organisms to monitor trace metal pollution in marine and estuarine pollution –A Review. Environment pollution 13: 281-317.
- Standard Method for the Examination of water and Waste water, APHA (2005).
Relevant Topics
- Algal Blooms
- Blue Carbon Sequestration
- Brackish Water
- Catfish
- Coral Bleaching
- Coral Reefs
- Deep Sea Fish
- Deep Sea Mining
- Ichthyoplankton
- Mangrove Ecosystem
- Marine Engineering
- Marine Fisheries
- Marine Mammal Research
- Marine Microbiome Analysis
- Marine Pollution
- Marine Reptiles
- Marine Science
- Ocean Currents
- Photoendosymbiosis
- Reef Biology
- Sea Food
- Sea Grass
- Sea Transportation
- Seaweed
Recommended Journals
Article Tools
Article Usage
- Total views: 11111
- [From(publication date):
December-2015 - Apr 02, 2025] - Breakdown by view type
- HTML page views : 10248
- PDF downloads : 863

