Statistical Analysis on Alzheimer's Disease
Received: 01-Nov-2023 / Manuscript No. jbtbd-23-122359 / Editor assigned: 03-Nov-2023 / PreQC No. jbtbd-23-122359 (PQ) / Reviewed: 20-Nov-2023 / QC No. jbtbd-23-122359 / Revised: 25-Nov-2023 / Manuscript No. jbtbd-23-122359(R) / Published Date: 29-Nov-2023 QI No. / jbtbd-23-122359
Abstract
Alzheimer's disease is a progressive neurodegenerative disease that occurs mostly in the elderly and has memory impairment as the main clinical symptom. There is no ideal treatment for Alzheimer's disease, so early prevention is important. In this paper, we use brain structural information to diagnose Alzheimer's disease features and cognitivebehavioral characteristics, which is important for early and accurate diagnosis of mild cognitive impairment. To investigate the factors influencing Alzheimer's disease, a correlation analysis model was developed after preprocessing the missing values of the data. First, the data features were viewed, the missing values of the data were analyzed, and the useless features were removed and the missing values of the remaining features were filled with the average value. To verify the accuracy of the subsequent intelligent diagnosis model and clustering model, this paper divides the training set and test set according to PTID. Finally, the top ten important features are selected and the Spearman coefficients are chosen according to the distribution of the features for correlation analysis. Machine learning methods were utilized to build an Alzheimer's classification model to solve the problem of intelligent diagnosis of Alzheimer's disease. The pre-processed dataset in the above paper was trained with the model, and five methods of logistic regression, support vector machine, KNN classification, decision tree classification and XGB were utilized to build the classification model, and the accuracy, recall and F1 value of each model were visualized and compared, among which the accuracy of XGB model reached 83%, which is reasonable for the intelligent diagnosis of the disease. A K-Meansbased clustering model for disease types was established using the K-Means clustering algorithm, clustering CN, MCI and AD into three major classes, and then refining MCI into three subclasses. The optimal K-values and random seeds were firstly found using the elbow principle, then the cluster analysis was performed using the feature values and data sets selected after preprocessing, and finally the MCI in MCI was extracted and sub-clustered into three subclasses SMC, EMCI and LMCI.
In order to investigate the evolution pattern of different categories of diseases over time, patients with 3 categories of diseases are screened separately for analysis in this paper. Firstly, by combining the results above and reviewing the data, the features irrelevant to this task and columns containing a large number of missing values were removed, the remaining features were selected and probability density plots were drawn, and all discrete features and all features that were essentially zero were continued to be screened out. After that, the 15 features of CN, MCI and AD diseases were plotted separately over time to reveal their evolution patterns over time. We reviewed the relevant literature, sorted out and summarized the existing studies at home and abroad, and summarized the criteria for determining the five stages of Alzheimer's disease and the early intervention of the disease.
Keywords
Alzheimer's disease; Machine learning; XGB algorithm; K-Means clustering
Introduction
Background and significance of the selected topic
Alzheimer's disease (AD) is a progressive neurodegenerative disease with an insidious onset and a chronic progressive course, with early symptoms that are not obvious and easily overlooked. It is characterized clinically by full-spectrum dementia, including memory impairment, aphasia, language impairment, dysgraphia, visuospatial skill impairment, executive motor impairment, and personality and behavioral changes, and its etiology are unknown. It is characterized by a progressive decline in activities of daily living and is associated with a variety of neuropsychiatric symptoms and behavioral disturbances. The disease usually progresses in the elderly, and after 10 to 20 years of onset, patients gradually lose their ability to live independently and die from complications.
According to the disease progression, Alzheimer's disease is divided into early, middle and late stages, and this classification helps to diagnose and develop treatment plans. In the preclinical stage, the patient's daily life and work are basically not affected; in the early stage of the disease, the patient's social functions (work skills) are reduced, but basic life skills are maintained and the ability to live independently is relatively intact, lasting about 3 years; in the middle stage of the disease, the patient is unable to live independently and may even die due to various accidents and complications, lasting about 2 years; in the late stage of the disease, the patient completely loses the ability to take care of himself/herself, various behaviors occur In the late stage of the disease, the patient loses the ability to care for himself completely, degenerates in various behaviors, and dies from various complications within 1 to 2 years [1].
The preclinical stage of Alzheimer's disease, also known as mild cognitive impairment (MCD), is a transitional state between normal and severe. Due to limited awareness of the disease among patients and their families, 67% of patients are diagnosed as moderate to severe, missing the optimal stage for intervention. Therefore, early and accurate diagnosis of Alzheimer's disease and mild cognitive impairment is of great importance.
Problem restatement
The data used in this paper contains specific information characteristics of 4850 cognitively normal elderly (CN), 1416 subjective memory complaint (SMC) patients, 2968 early mild cognitive impairment (EMCI) patients, 5236 late mild cognitive impairment (LMCI) patients and 1738 Alzheimer's disease (AD) patients collected at different time points. In this paper, we use the brain structural characteristics and cognitive behavioral characteristics of different categories of people provided in the appendix to construct an Alzheimer's disease identification model and design an intelligent diagnosis method to accurately diagnose Alzheimer's disease.
(1) The characteristic indicators of the attached data were preprocessed to examine the correlation between the data characteristics and the diagnosis of Alzheimer's disease.
(2) To design an intelligent diagnosis of Alzheimer's disease using the attached structural brain features and cognitive-behavioral characteristics.
(3) First, CN, MCI and AD are clustered into three major classes then, for the three subclasses contained in MCI (SMC, EMCI and LMCI), the clustering is continued to be refined into three subclasses.
(4) The same sample in the annex contains features collected at different time points. Please analyze them in relation to the time points to reveal the evolutionary pattern of different categories of diseases over time.
(5) Please review the relevant literature to describe the early 1,000 prognosis and diagnostic criteria for the five categories of CN, SMC, EMCI, LMCI, and AD [2].
Data sources and description
Data description
The data in this paper were measured by medical techniques and contain key features to identify early stage Alzheimer's disease. The features are interpreted as follows:
I. Basic personal information
COLPROT Data Collection Study Protocol
ORIGPROT Original Research Program
PTID Propensity to Interest
SITE Website
VISCODE Personally, I think it's a diagnostic code that runs at different times
EXAMDATE Test date
DX_bl Diagnosis
AGE
II. Second, the base situation of participants
PT GENDER Participant Gender
PT EDUCAT Participant Education
Where are the PT ETHCAT participants from?
PT RACCAT Participant Skin Tone
PT MARRY Participant Marital Status
III. Medical characteristics
APOE4 gene, the most important genetic risk factor for Alzheimer's disease
FDG corner buckle belt, temporal buckle belt and back buckle belt of average FDG-PET
PIB Mean PIB SUVR in frontal cortex, anterior cingulate gyrus, precuneus cortex and parietal cortex
AV45 reference area-average of flubetapir across the cerebellum.
ABETA Alzheimer's disease important research factor-Aβ (betaamyloid)
The role of TAU protein in Alzheimer's disease
PTAU Important biomarkers for Alzheimer's disease diagnosis-
Aβ/T-Tau/P-Tau
CDR-SB Comprehensive assessment of key outcome indicators of cognitive and functional impairment in AD patients
ADAS ADAS-Cog Alzheimer's disease Assessment Scale
IV. MMSE scale
Score of 27-30: Normal
Score <27: cognitive dysfunction
21-26, Mild
10-20, Moderate
0-9, Severe
V. RAVLT Mental Awareness Scale
RAVLT_immediate 5-trial total
RAVLT_learning Trial 5-Trial 1
RAVLT_forgetting Forgetfulness RAVLT forgetfulness (Trial 5-Delayed)
RAVLT_perc_forgetting perc (RAVLT-Oblivion percentage)
VI. Others
LDELTTOTAL (Logical Memory-Delayed Recall)
DIGITSCOR Digital Symbol Substitution
TRAPSCOR Thyrotropin Receptor Antibody
FAQ Function Activity Questionnaire
MOCA Montreal Cognitive Assessment Scale ECOG scoring criteria
FLDSTRENG Magnetic Resonance Field of View Intensity
FSVERSION Freesurfer for MRI image processing
mPACCdigit ADNI-modified preclinical cognitive complex
(PACC) with digit symbol replacement
mPACCtrailsB ADNI-modified preclinical cognitive complex (PACC) with track B
TRABSCOR Track B
Data display
As shown in Figures 1 and 2 below, the given dataset has 116 features and 16,222 sample data. In this problem, the DX_bl column is used as the label column, and the remaining 155 columns are feature columns. The label column contains a total of 5 categories, namely, CN, SMC, LMCI, EMCI, and AD. Among the 115 features, there are a total of 93 numerical features and 22 category features.

Figure 1: Data display.

Figure 2: Classification of Alzheimer's disease.
Analysis Process
Investigate the factors influencing Alzheimer's disease
In order to investigate the factors influencing Alzheimer's disease, a correlation analysis model was developed after preprocessing the missing values of the data. First, the data features were viewed, the missing values of the data were analyzed, and the useless features were removed and the missing values of the remaining features were filled with the mean values. To verify the accuracy of the subsequent intelligent diagnosis model and clustering model, this paper divides the training set and test set according to PTID. Finally, the top ten important features are selected and the Spearman coefficients are chosen according to the distribution of the features for correlation analysis.
Machine learning methods
Machine learning methods were utilized to build Alzheimer's disease classification models to solve the problem of intelligent diagnosis of Alzheimer's disease. The preprocessed dataset in the above paper was trained with the model, and five methods of logistic regression, support vector machine, KNN classification, decision tree classification and XGB were utilized to build the classification model, and the accuracy, recall and F1 value of each model were visualized and compared, in which the accuracy of XGB model reached 83%, which is reasonable for the intelligent diagnosis of the disease.
A K-Means-based clustering model
We used K-Means clustering algorithm to establish a K-Meansbased clustering model for disease types, clustering CN, MCI and AD into three major classes, and then refining MCI into three subclasses. The optimal K-values and random seeds were firstly found using the elbow principle, then the cluster analysis was performed using the feature values and datasets selected after preprocessing, and finally the MCI in MCI was extracted and sub-clustered into three subclasses SMC, EMCI and LMCI.
The evolution pattern of different categories
To investigate the evolution pattern of different categories of diseases over time, patients with 3 categories of diseases are screened separately for analysis. Firstly, by combining the results above and reviewing the data, the features irrelevant to this task and columns containing a large number of missing values were removed, the remaining features were selected and probability density plots were drawn, and all discrete features and all features that were essentially 0 were continued to be screened out. After that, the 15 features of CN, MCI and AD diseases were plotted separately over time to reveal their evolution patterns over time [3,4].
Data Processing
Missing value handling method
The processing of missing values is divided into cases with missing values and missing value interpolation from a general point of view.
Delete cases with missing values
There are mainly simple deletion method and weighting method. The simple deletion method is the most primitive method for processing missing values. It removes the cases with missing values. This method is most effective if the problem of missing data can achieve the goal by simply deleting a small portion of the sample. When the type of missing values is non-complete random missing, the bias can be reduced by weighting the complete data. After labeling the cases with incomplete data, the complete data cases are assigned different weights, which can be found by logistic or probit regression for each case. This method is effective in reducing bias if there are variables in the explanatory variables that are determinants of the weight estimates. If the explanatory variables and weights are not correlated, it does not reduce the bias. In the case of multiple missing attributes, it is necessary to assign different weights to the missing combinations of different attributes, which will greatly increase the difficulty of calculation and reduce the accuracy of prediction, and the weight method is not ideal.
Possible values to interpolate missing values
It comes from the idea that interpolating missing values with the most probable values produces less information loss than deleting incomplete samples altogether. In data mining, the face is usually a large database, which has dozens or even hundreds of attributes. Giving up a large number of other attribute values because of the missing value of one attribute, such deletion is a great waste of information, so the idea and method of interpolating the missing values with possible values is generated. The following methods are commonly used.
Mean value interpolation: The attributes of the data are classified as fixed-range type and non-fixed-range type. If the missing value is fixed-range, the mean value of the existing values of the attribute is used to interpolate the missing value; if the missing value is non-fixed-range, the plurality of the attribute (i.e., the value with the highest frequency) is used to make up the missing value according to the principle of plurality in statistics.
Interpolation using same mean interpolation: The same mean interpolation methods all belong to single-value interpolation, the difference is that it uses a hierarchical clustering model to predict the type of missing variables and then interpolates with the mean of that type. Suppose X=(X1,X2...Xp) is a variable with complete information and Y is a variable with missing values, then first cluster X or its subsets and then interpolate the mean values of different classes by the class to which the missing cases belong. This interpolation method will introduce autocorrelation in the model and create obstacles to the analysis if the analysis also needs to be done later in the statistical analysis with the introduced explanatory variables and Y.
Great likelihood estimation: Under the condition that the missing type is randomly missing, assuming that the model is correct for the complete sample, then the marginal distribution of the observed data can be estimated by the great likelihood of the unknown parameters. This method is also known as the maximum likelihood estimation ignoring missing values, and the calculation method often used in practice for the parameter estimation of the maximum likelihood is expectation maximization. This method is more attractive than case removal and single-value interpolation and it an important premise: it is applicable to large samples. The number of valid samples is sufficient to ensure that the ML estimates are asymptotically unbiased and obey a normal distribution. However, this method may fall into local extremes, convergence is not very fast, and the computation is complex.
Multiple interpolation: The idea of multi-value interpolation comes from Bayesian estimation, which considers that the value to be interpolated is random and its value comes from the observed values. The specific practice is usually to estimate the values to be interpolated and then add different noises to form multiple sets of optional interpolation values. The most suitable interpolation value is selected according to some selection basis.
Missing value identification
The missing values in the dataset are visualized using missingno from the Missing Value Visualization Python tool library to see the distribution profile of the missing values in the data, as shown in the following Figure 3. In the above figure, the white part indicates the missing values, and more blanks represent more serious missingness. From the figure, we can see that some of the features have serious missing values and need to be processed for missing values on the dataset.
Missing value processing

Figure 3: Distribution of missing values in the dataset.
First, in this paper, the features with the number of missing values greater than 30 percent of the number of samples are removed, and the shape of the remaining data is 16222 rows and 52 columns. Since DX_ bl is a label column, the sample with DX_bl column empty is deleted, and the shape of the remaining data is 16208 rows and 52 columns. In addition, by reviewing related information and analyzing the features, the following features were artificially removed: 'RID', 'COLPROT', 'ORIGPROT'. 'SITE', 'VISCODE', 'EXAMDATE', 'DX'. 'EXAMDATE_ bl', 'FLDSTRENG_bl', 'FSVERSION_bl', ' IMAGEUID_bl', 'update_ stamp'.
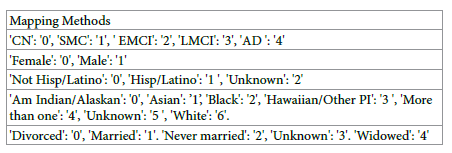
After processing, the patient identity PTIDs are counted to obtain the data of 2410 patients in this dataset at present. After that, the patient identity feature PTIDs are encoded by Label Encoder. Since characteristics such as disease type and gender are stereotypical variables, the following mapping of category characteristics is required.
After the above processing, the distribution of missing values of the
data is as in Figure 4.

Figure 4: Distribution of missing values of processed data.
There are also numerical variables in the dataset that are missing, and this paper uses mean interpolation to fill in the missing data with the average of each feature. The number of diseases in each category at this point was LMCI: 5236, CN: 4850, EMCI: 2967, AD: 1738, and SMC: 1416 (Figure 5).

Figure 5: Distribution of various diseases after data pre-processing.
Data Analysis
Intelligent diagnostic model
An intelligent diagnostic model is a computer program that uses machine learning algorithms to analyze medical data and provide diagnoses for various diseases. It can be trained on large datasets of medical records, symptoms, and treatments to identify patterns and make predictions about the likelihood of different conditions. Intelligent diagnostic models can assist healthcare professionals in making more accurate diagnoses, reducing the risk of misdiagnosis, and improving patient outcomes. They can also help to streamline the diagnostic process, reducing wait times and improving efficiency in healthcare systems. Some common applications of intelligent diagnostic models include diagnosing cancer, identifying heart disease, predicting stroke risk, and detecting Alzheimer's disease. However, it is important to note that these models are not perfect and should always be used in conjunction with the expertise of medical professionals [5-7].
Model introduction
I. Logistic regression
Logistic regression, also known as logistic regression analysis,is a generalized linear regression analysis model, which belongs to supervised learning in machine learning. The derivation process and computation are similar to the regression process, but it is actually mainly used to solve the dichotomous classification problem (also can solve the multiclassification problem). The model is trained with a given n sets of data (training set), and the given set or sets of data (test set) are classified at the end of the training. Each of these sets of data is composed of p indicators.
II. Linear separable support vector machine
For linearly divisible datasets, the goal of learning is to find a separation hyperplane in the feature space that can divide the instances into different classes. The separation hyperplane divides the feature space into two parts, one with positive classes and one with negative classes. The side of the separation hyperplane where the normal vector points are the positive class and the other side is the negative class. And the sum of the distances between the two nearest points of this separation hyperplane is required to be the maximum, and this separation hyperplane is called the interval maximum separation hyperplane.
The mathematical model of a linear separable support vector machine is
f (x) = sign(w* x+ b*)
Where is the spaced maximum separation hyperplane?
III. KNN algorithm
KNN is short for k nearest neighbor, which means find the k nearest instances to vote on the class label of the new instance. KNN is an instance-based learning algorithm, which is different from Bayesian and decision tree algorithms, etc. KNN does not need training, when a new instance appears; it directly finds the k nearest instances in the training dataset and assigns this new instance to the class with the highest number of instances among these k training instances. KNN also becomes lazy learning, it does not need training process and the accuracy of classification is high when the class label boundaries are relatively neat. kNN algorithm needs to decide the value of k artificially, i.e., find several nearest instances, and the results of classification results will be different for different values of k.
IV. Decision tree classification
Decision tree is a decision analysis method that evaluates the project risk and judges its feasibility by forming a decision tree to find the probability that the expected value of the net present value is greater than or equal to zero on the basis of the known probability of occurrence of various situations, and is a graphical method that intuitively uses probability analysis. Since this decision branch is drawn as a graph resembling the branches of a tree, it is called a decision tree. In machine learning, a decision tree is a predictive model that represents a mapping relationship between object attributes and object values. The class tree (decision tree) is a very common classification method. It is a supervised learning, so called supervised learning is given a bunch of samples, each with a set of attributes and a category, which are determined in advance, then a classifier is obtained by learning, which is able to give the correct classification for the emerging objects.
V. XGBoost model
The core algorithm idea of XGBoost is to keep adding trees and keep feature splitting to grow a tree. Each time a tree is added, it actually learns a new function f(x) to fit the residuals of the last prediction. When we finish training to get k trees, we want to predict the score of a sample,which is actually based on the features of this sample, which will fall to a corresponding leaf node in each tree, and each leaf node corresponds to a score. Finally, we just need to add up the scores corresponding to each tree to be the predicted value of the sample.
The objective function of XGBoost consists of two parts: the loss function and the canonical term. The loss function: represents how well the model fits the data. Usually, its first-order derivative is used to point out the direction of gradient decline. XGBoost also calculates its second-order derivative, which further takes into account the trend of gradient change and fits faster and with higher accuracy. Regular term: used to control the complexity of the model. The more leaf nodes there are, the larger the model is, which not only takes longer to compute, but also over-fits after a certain limit, leading to the degradation of the classification effect. the regular term of XGBoost is a penalty mechanism, and the more the number of leaf nodes, the stronger the penalty is, thus limiting their number.
Model Training
The dataset contains multiple samples of the same patient, and to avoid the data of one patient being separated, the training set and test set are divided according to PTID.
Seventy percent of the patients with PTID less than 1687 were divided into the training set with 11425 samples; 30% of the patients with PTID greater than 1687 were divided into the test set with 4782 samples.
First, logistic regression was performed on the dataset, with the disease type as the target value, so that CN was 0, SMC was 1, EMCI was 2, LMCI was 3, and AD was 4. The logistic regression model was established, and the following table shows the evaluation index of the obtained intelligent diagnostic model, and the logistic regression model recognition accuracy was 37% (Table 1).
| Accuracy | Recall Rate | F1 value | Quantity | |
|---|---|---|---|---|
| 0 | 0.3 | 0.43 | 0.36 | 1328 |
| 1 | 0 | 0 | 0 | 459 |
| 2 | 0.32 | 0.37 | 0.34 | 831 |
| 3 | 0.46 | 0.56 | 0.5 | 1600 |
| 4 | 0.41 | 0.01 | 0.02 | 564 |
| accuracy | 0.37 | 4782 | ||
| macro avg | 0.3 | 0.27 | 0.25 | 4782 |
| weighted avg | 0.34 | 0.37 | 0.33 | 4782 |
Table 1: Logistic regression model evaluation.
Second, a linearly divisible support vector machine using support vector machine learning method requires the training set to be linearly divisible and the hyperplane is obtained by maximizing the hard interval [8].
Again with the disease type as the target value, let CN be 0, SMC be 1, EMCI be 2, LMCI be 3, and AD be 4. The linearly divisible support vector machine model is established, and the obtained intelligent diagnostic model is evaluated with the following table, and the model recognition accuracy is 39% (Table 2).
| Accuracy | Recall Rate | F1 value | Quantity | |
|---|---|---|---|---|
| 0 | 0.36 | 0.37 | 0.37 | 1328 |
| 1 | 0 | 0 | 0 | 459 |
| 2 | 0.31 | 0.33 | 0.32 | 831 |
| 3 | 0.43 | 0.67 | 0.52 | 1600 |
| 4 | 0 | 0 | 0 | 564 |
| accuracy | 0.39 | 4782 | ||
| macro avg | 0.22 | 0.28 | 0.24 | 4782 |
| weighted avg | 0.3 | 0.39 | 0.33 | 4782 |
Table 2: Evaluation of linearly separable support vector machine models.
Third, the data classification and prediction problem is solved by using the K nearest neighbor algorithm and setting the K value to 5. Again with the disease type as the target value, let CN be 0, SMC be 1, EMCI be 2, LMCI be 3, and AD be 4.
The KNN classification model was established, and the obtained intelligent diagnosis model evaluation index is shown in the following table, and the model recognition accuracy is 32% (Table 3).
| Accuracy | Recall Rate | F1 value | Quantity | |
|---|---|---|---|---|
| 0 | 0.3 | 0.26 | 0.28 | 1328 |
| 1 | 0.18 | 0.25 | 0.21 | 459 |
| 2 | 0.36 | 0.35 | 0.36 | 831 |
| 3 | 0.43 | 0.42 | 0.43 | 1600 |
| 4 | 0.18 | 0.21 | 0.19 | 564 |
| accuracy | 0.32 | 4782 | ||
| macro avg | 0.29 | 0.3 | 0.29 | 4782 |
| weighted avg | 0.33 | 0.32 | 0.32 | 4782 |
Table 3: KNN model evaluation.
Fourth, the classification is achieved by using decision tree classification with the help of the branching structure of the tree. Again, with the disease type as the target value, let CN be 0, SMC be 1, EMCI be 2, LMCI be 3, and AD be 4. A decision tree classification model was established, and the following table shows the evaluation index of the obtained intelligent diagnostic model, and the model recognition accuracy was 74% (Table 4).
| Accuracy | Recall Rate | F1 value | Quantity | |
|---|---|---|---|---|
| 0 | 0.73 | 0.66 | 0.69 | 1328 |
| 1 | 0.26 | 0.32 | 0.29 | 459 |
| 2 | 0.86 | 0.92 | 0.89 | 831 |
| 3 | 0.89 | 0.85 | 0.87 | 1600 |
| 4 | 0.69 | 0.74 | 0.72 | 564 |
| accuracy | 0.74 | 4782 | ||
| macro avg | 0.69 | 0.7 | 0.69 | 4782 |
| weighted avg | 0.76 | 0.74 | 0.75 | 4782 |
Table 4: Evaluation of decision tree classification model.
Fifth, the XGBoost model is established, and the tuning of parameters is mainly based on the grid search method of python sklearn class library to select the optimal hyperparameters. Again, with the disease type as the target value, let CN be 0, SMC be 1, EMCI be 2, LMCI be 3, and AD be 4. The XGB classification model was established, and the evaluation index of the obtained intelligent diagnosis model is shown in the following table, and the model recognition accuracy is 83% (Table 5).
| Accuracy | Recall Rate | F1 value | Quantity | |
|---|---|---|---|---|
| 0 | 0.78 | 0.84 | 0.81 | 1328 |
| 1 | 0.39 | 0.28 | 0.33 | 459 |
| 2 | 0.90 | 0.98 | 0.94 | 831 |
| 3 | 0.91 | 0.92 | 0.92 | 1600 |
| 4 | 0.85 | 0.74 | 0.79 | 564 |
| accuracy | 0.83 | 4782 | ||
| macro avg | 0.77 | 0.75 | 0.76 | 4782 |
| weighted avg | 0.82 | 0.83 | 0.82 | 4782 |
Table 5: XGBoost model evaluation.
Comparison of each model
In summary, among the five models established for the intelligent diagnosis of Alzheimer's disease, the decision tree classification model and the XGB model achieved judgment accuracy of 74% and 83%, respectively, while the judgment accuracy of the remaining three models was only above 30%, probably because the models ignored the characteristics of certain categories. In reality, the factors affecting Alzheimer's disease may also be difficult to detect, thus increasing the difficulty of early disease identification and diagnosis. The f1-score in accuracy, macro avg and weighted avg of the five models are now visualized and analyzed as shown below Figure 6.

Figure 6: Comparison of the effect of each model.
Correlation analysis
Correlation analysis is a statistical technique used to measure the strength and direction of the relationship between two or more variables. It is a way of looking at how one variable changes in response to changes in another variable, with the goal of identifying patterns and making predictions about future behavior [9].
Data exploration
The 15 most important features of the XGB model established above were selected as the new dataset with two columns PTID and DX_bl. The 5 categories of labels in the dataset were saved as 3 categories, and SMC, EMCI, and LMCI were used as MCI categories. The box line plots of these variables were plotted to view the outliers as follows in Figure 7.

Figure 7: Variable box line diagram.
Histograms and Q-Q plots are plotted to test whether these characteristics conform to a normal distribution, which is related to which parameters are chosen for the later correlation analysis of below in Figure 8.

Figure 8: Histogram of variables and Q-Q plot.
Correlation analysis
Plot the relevance heat map and find the 10 most relevant feature information in Figure 9.

Figure 9: Correlation heat map.
Plot the feature information with correlation greater than 0.5 in Figure 10.

Figure 10: Heat map with correlation greater than 0.5.
Clustering model
Model introduction: The basic idea of K-Means clustering algorithm: assign each sample to the class to which the nearest center (mean) belongs Algorithm flow of K-Means clustering:
I. Specify the number of clusters to be divided K (the number of classes).
II. Randomly select K data objects as the initial clustering centers (not necessarily our sample points).
III. Calculate the Euclidean distance of each of the remaining data objects to the K initial cluster centers, and assign the data object to the cluster class in which the center closest to it is located.
Euclidean distance
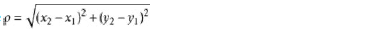
IV. Adjust the new class and recalculate the center of the new class.
V. Loop steps three and four to see if the center converges
(unchanged), and stop the loop if it converges or reaches the number of iterations.
VI. End.
Model training: First, CN, MCI, and AD were clustered into three major classes. Then, for the three subclasses (SMC, EMCI and LMCI) contained in MCI, the clustering was continued to be refined into three subclasses. The specific operation is to categorize AD, CN as 1 and 5. The classes belonging to MCI are all categorized as 2, and the three subclasses in MCI are coded as 2, 3, and 4 in the subsequent MCI tracheotomies.
In the first step, clustering into three major classes, AD, CN, and MCI, this paper uses the K-Means clustering algorithm, and first uses the elbow method to find the optimal K value and obtains the elbow diagram as Figure 11. According to the elbow principle, the optimal K value that should be chosen for K-Means clustering is 2. If we make K directly equal to 3, the number of the three classes clustered out is too average, which is not consistent with the original label distribution. Therefore, in this paper, we choose to perform dichotomization first, and then select a label from the dichotomization and dichotomize it, so as to complete the purpose of triple clustering.

Figure 11: Elbow diagram.
K=2 was chosen for the first clustering, and the label distribution of the first clustering was obtained, as shown below. Based on the distribution of the original labels, we choose to perform the second clustering for category 2 show in Figure 12a. For category 2, the search for the optimal K value continues, and according to the elbow principle, the result obtained is still 2. This coincides with our idea of clustering into three categories twice, and the distribution of clustering into three categories, AD, CN, and MCI, is shown in the below Figure 12b. In the second step, the 2475 samples of MCI class were continued to K-means clustering with the same clustering method as above, and three subclasses SMC, EMCI and LMCI were obtained after clustering with the following distribution shown in Figure 13.

Figure 12: First clustering results.

Figure 13: MCI clustering results.
Temporal evolutionary pattern of diseases
Based on the above analysis and review of relevant data, 15 influential factors related to the causes of Alzheimer's disease were selected:
mPACCtrailsB, mPACCdigit, ICV, MidTemp, Fusiform, Entorhinal, WholeBrain, Hippocampus, Ventricles. IMAGEUID, TRABSCOR, RAVLT_forgetting, RAVLT_immediate, ADAS13, ADAS11. The data were divided into CN, MCI and AD categories according to the disease period, and the relationship between the above 15 features and time points was visualized and analyzed to show the change pattern of different categories of diseases over time [10].
For cognitively normal older adults shown in Figure 14: For patients with mild cognitive impairment shown in Figures 15 and 16.

Figure 14: Plot of the characteristics of cognitively normal older adults over time.

Figure 15: Graph of characteristics of patients with mild cognitive impairment over time.

Figure 16: Graph of characteristics of patients with Alzheimer's disease over time.
Conclusion
Analysis of results
In this paper, to solve the problem of intelligent diagnosis of Alzheimer's disease, an XGBoost model was established, and the accuracy of the classification model reached 83%. To solve the clustering problem of the five stages of Alzheimer's disease, the K-means clustering model was utilized twice to first cluster CN, MCI and AD into three major classes, and then the three subclasses contained in MCI continued to refine the clustering. In this paper, we use visual presentation to analyze the features collected at different time points according to the time series relationship and show the changes of the features of different categories of diseases over time. Finally, the literature is reviewed to describe the early intervention and diagnostic criteria for the five categories of diseases, which have implications for the early diagnosis of Alzheimer's disease.
Early intervention of disease
The pathogenesis of Alzheimer's disease remains unclear, and there is currently no method to cure or slow the progression of the disease. The failure of clinical trials of new drugs for AD in the past has been attributed to too late intervention, making early intervention an important direction for research in AD prevention and treatment. The future direction of AD interventions should be a "three-tier prevention strategy", where interventions to reduce Aβ levels alone may have a preventive effect in the early stages of the disease; after the onset of other pathological events, a comprehensive intervention is needed. A comprehensive intervention is needed after the onset of other pathological events.
After early detection of Alzheimer's disease, patients should receive targeted medication in addition to life interventions under the guidance of professional doctors, such as adjusting the diet structure, appropriate exercise, and appropriate intellectual exercise. Usually the combination of medication and life intervention and training at an early stage can improve the patient's symptoms.
I. Drug treatment.
There is no specific drug to cure Alzheimer's disease, but some drugs can be used to relieve the symptoms. Acetyl cholinesterase inhibitors and NMDA receptor antagonists are often used in clinical practice, and acetyl cholinesterase inhibitors include donepezil and carboplatin, and NMDA receptor antagonists include meantime, etc.
II. Life interventions.
(i) Adjust the diet structure: it is recommended that patients eat foods rich in protein, lecithin, unsaturated fatty acids, such as seafood, milk, lean meat, etc., can supplement the nutrients required by the brain, to improve the brain function of patients have a supporting role, but the nutritional supplement must be under the guidance of professional doctors, dietitians, do not use indiscriminate supplementation.
(ii) Appropriate exercise: patients should be under the guidance of professional doctors, rehabilitation physicians to carry out appropriate exercise, mainly aerobic exercise, such as brisk walking, jogging, swimming; aerobic exercise can effectively promote blood circulation in the brain, delaying vascular sclerosis, slowing down the degeneration of brain function.
(iii) Intellectual exercise: such as frequent communication with friends and relatives, play chess, cards, etc., listen to more music, you can cultivate the hobby of piano, chess, calligraphy and painting, more outdoor activities, more sunshine, can promote the brain, limb activity, is conducive to delaying the progress of the disease.
Patients with Alzheimer's disease can usually slow down the progression of the disease after various interventions in the early stage and with the treatment of doctors. During the treatment process, it is important to review regularly, give feedback to the doctor on the treatment effect, and improve the treatment method in time to obtain better recovery results.
Diagnostic criteria of the disease
(i) CN in cognitively normal older adults
1. Self-care or basic self-care;
2. Age-related changes in vital organs not resulting in significant functional abnormalities;
3. Risk factors affecting health are controlled in a range appropriate to their age;
4. Good nutritional status;
5. Largely normal cognitive function;
6. Optimistic and positive, self-satisfied;
7. Have a certain level of health literacy and maintain a good lifestyle;
8. Active participation in family and social activities;
9. Good social adaptability.
(ii) Patients with subjective memory complaints (SMC)
1. Age over 50 years old.
2. Presence of memory complaints for more than 6 months.
3. Decreased memory compared to previous years (e.g. high school or college years)
4. Give at least one example of memory loss in daily life.
5. Memory problems occur at least once a week.
6. Non-dementia
(iii) Patients with early mild cognitive impairment (EMCI)
The main diagnostic criteria for mild cognitive impairment are cognitive decline but normal basic life skills. Mild cognitive impairment is an intermediate state between normal aging and dementia, and is a cognitive impairment syndrome. It is mainly due to the damage to the nerves of the patient's brain, which leads to the patient's cognitive decline, manifested as memory loss, weak executive function, unfavorable language, etc. In addition patients with mild cognitive impairment have normal basic life skills, but may have slight impairment in complex instrumental daily abilities.
(iv) Patients with advanced mild cognitive impairment (LMCI)
Mild cognitive impairment, an intermediate state between normal aging and dementia, is a cognitive impairment syndrome in which patients will have mild cognitive impairment compared to age-and education-matched older adults, but the ability to perform daily living activities is not severely affected. The core symptom of mild cognitive impairment is diminished cognitive function. Depending on the etiology and the site of brain damage, the diagnosis of mild cognitive impairment must have the following 2 points:
First, the patient shows signs of cognitive decompensation and can be informed by the patient's family or a knowledgeable person that the patient is showing such signs. On the other hand, a partially rated scale to confirm that the patient does show signs of cognitive decompensation;
Second, the patient's basic daily living ability is not affected, but there is a slight impairment when it comes to the ability to perform complex instrumental daily activities. For example, patients may not be able to go shopping or go out to buy groceries, or cook food or manage personal finance.
Therefore, having the above 2 conditions is the only way to diagnose mild cognitive impairment, and it is also recommended to go to a professional institution for evaluation and treatment as early as possible to facilitate early detection and treatment.
(v) Patients with Alzheimer's disease (AD)
The diagnostic criteria for Alzheimer's disease are as follows:
1. It has to meet the diagnostic criteria for dementia, such as cognitive function affecting the ability to perform daily activities, his ability to live a reduced life, and his inability to take care of himself;
2. through objective examination, there is evidence of cognitive impairment, but also to exclude some diseases, such as some diseases that can affect the decline in cognitive function, the most common is delirium, and depression these psychiatric diseases;
3. be consistent with two cognitive domains of decline, such as memory, learning decline, visuospatial decline, executive function decline, and language function decline, two of these within which dementia can be diagnosed;
4. to be consistent with the performance of Alzheimer's disease itself, such as Alzheimer's disease is very insidious, in six months or a year, gradually appear cognitive decline, and some performance provided by the patient, must obtain the evidence, basis provided by the knowledgeable person, indicating that the patient has cognitive impairment;
5. Other diseases should be ruled out, especially Alzheimer's disease, such as vascular dementia, front temporal dementia, Lowy body dementia and other diseases.
Conflict of Interest
We have no conflict of interests to disclose and the manuscript has been read and approved by all named authors.
Acknowledgments
This work was supported by the Philosophical and Social Sciences Research Project of Hubei Education Department (19Y049), and the Staring Research Foundation for the Ph.D. of Hubei University of Technology (BSQD2019054), Hubei Province, China.
References
- Luo, Chun-Fang (2020). Research on XGBoost integration algorithm based on Kmeans clustering[J]. Computer Age. 35: 12-14.
- Zhong Xi,Sun Xiang'e (2019) Research on plain Bayesian integration method based on Kmeans++ clustering[J]. Computer Science. 46: 439-441-451.
- Fan Dongyu,Sun Binlu,Wang Yanjiang (2020) Early intervention in Alzheimer's disease: shifting the focus of intervention from early clinical to early biological stages[J]. Journal of Alzheimer's Disease and Related Disorders 3: 231-234.
- Wu Zhangying, Zhong Xiaomei, Chen Xinru, Wang Yanhua et.al (2016) Characterization of psycho-behavioral symptoms in patients with mild cognitive impairment and Alzheimer's disease[J]. Chinese Journal of Psychiatry. 49: 175-181.
- Fan Jingbo,Sun F,Yang Lan (2016) Progress of intervention research and decision making for prevention and treatment of mild cognitive impairment[J]. New Campus(Reading). 61: 173.
- Dai C (2013) Cognitive function testing and investigation of liver depression symptoms in people with complaints of memory complaints [D]. Beijing University of Traditional Chinese Medicine.
- Zhao Qing (2020) Preliminary construction of a mobile medical app intervention program for older adults based on memory complaint complaints [D]. Nanjing Medical University.
- Chen Yanjie, Zhang Yuanjin, Lv Zhongkuan, Li Yaming et.al (1019) Prevention and intervention of Alzheimer's disease [C]//. Proceedings of the 8th Professional Committee on Void Evidence and Geriatrics of the Chinese Society of Integrative Medicine, the Chinese Society of Gerontology and Geriatrics, Integrative Medicine Branch, and the Geriatric Medicine Committee of the Chinese Medicine Society of Jiangsu Province, Annual Academic Conference. 269-272.
- He Huiping, He Yaowei, Shen Zonglin (2022) Comparative analysis of psycho-behavioral symptoms in patients with Alzheimer's disease and mild cognitive impairment[J]. Journal of Kunming Medical University. 43: 19-23.
- Bin Zhao, Zhai Wang, Jinke Liu (2022) Application of MRI deep Learning in the intelligent diagnosis of Alzheimer disease: methods and applications [J]. Chin Journal of Nervous Mental Disease. 48: 251-256.
Indexed at, Google Scholar, Crossref
Indexed at, Google Scholar, Crossref
Indexed at, Google Scholar, Crossref
Indexed at, Google Scholar, Crossref
Indexed at, Google Scholar, Crossref
Citation: Zhao B, Jiang X, Mou J (2023) Statistical Analysis on Alzheimer'sDisease. J Bioterr Biodef, 14: 359.
Copyright: © 2023 Zhao B, et al. This is an open-access article distributed underthe terms of the Creative Commons Attribution License, which permits unrestricteduse, distribution, and reproduction in any medium, provided the original author andsource are credited.
Share This Article
Recommended Journals
Open Access Journals
Article Usage
- Total views: 708
- [From(publication date): 0-0 - Mar 12, 2025]
- Breakdown by view type
- HTML page views: 606
- PDF downloads: 102