Research Article Open Access
Stalagmite Inferred High Resolution Climatic Changes through Pleistocene-Holocene Transition in Northwest Indian Himalaya
| Bahadur Singh Kotlia1*, Anoop Kumar Singh1, Jaishri Sanwal2, Waseem Raza3, Syed Masood Ahmad3, Lalit Mohan Joshi1, Manisha Sirohi1, Arun Kumar Sharma1 and Netramani Sagar3 | |
| 1Centre of Advanced Study in Geology, Kumaun University, Nainital 263 002, India | |
| 2Geodynamics Unit, Jawaharlal Nehru Centre for Advanced Scientific Research, Bangalore, 560 064, India | |
| 3CSIR-National Geophysical Research Institute, Uppal road, Hyderabad, 500 007, India | |
| *Corresponding Author : | Kotlia BS Centre of Advanced Study in Geology Kumaun University, India Tel: 091-9411196744 Fax: +91 5942 239314 E-mail: bahadur.kotlia@gmail.com |
| Received: February 15, 2016; Accepted: February 29, 2016; Published: March 05, 2016 | |
| Citation: Kotlia BS, Singh AK, Sanwal J, Raza W, Ahmad SM, et al. (2016) Stalagmite Inferred High Resolution Climatic Changes through Pleistocene-Holocene Transition in Northwest Indian Himalaya. J Earth Sci Clim Change. 7:338. doi:10.4172/2157-7617.1000338 | |
| Copyright: © 2016 Kotlia BS, et al. This is an open-access article distributed under the terms of the Creative Commons Attribution License, which permits unrestricted use, distribution, and reproduction in any medium, provided the original author and source are credited. | |
Visit for more related articles at Journal of Earth Science & Climatic Change
Abstract
Investigated for d18O and d13C isotopes, mineralogy and growth rate, a 20 cm long and 230Th-dated calcite stalagmite from Kalakot (Jammu and Kashmir Himalaya), has recorded high resolution precipitation variability during the Pleistocene-Holocene transition. At present, the study area is influenced by both the Indian Summer Monsoon (ISM) and Westerlies. The StalAge model indicates that the stalagmite grew between 16.3 ka to 9.5 ka BP under the ideal isotopic equilibrium conditions as revealed by the Hendy test results. The d18O and d13C values range from -5.41 to -8.82% and -7.09 to -10.84% respectively. Although the U/Th chronology is poor due to low Uranium content in the samples resulting in relatively large errors, the first stalagmite inferred precipitation variability reconstructed from NW Indian Himalaya makes this study significant. The near footprints of three global events, e.g., Older Dryas (OD), Allerod period and Younger Drays (YD) can be noticed at ~14.3-13.9, 13.9-12.7 and 12.7-12.2 ka BP. The precipitation strength was weaker during the OD and YD, but was stronger during the Allerød interstadial. By the termination of YD interval, the climate seems fluctuating in the NW Himalaya. There seems variation in commencement, duration and termination of the above mentioned events in different parts of the globe due to latitude location and response time.
| Keywords |
| Precipitation variability; Late Pleistocene-Early Holocene; Stalagmite; d18O and d13C; NW Indian Himalaya |
| Introduction |
| The reconstructions of the palaeo-Indian Summer Monsoon (ISM) from the last glacial maximum onwards over South Asia have relied on the sediment cores [1-5]. In the Indian subcontinent, the variability of ISM through Late Pleistocene to Holocene has been primarily generated at the centennial scale from the sea sediments [2-4,6-8]. In these records, the proxies of ocean upwelling have been used to deduce the strength of the ISM winds under the atmospheric low-level monsoon jet. However, in recent years, the Holocene precipitation variability in the monsoon core zones and other sites chiefly under the influence of the ISM has also been reconstructed by using the well dated stalagmites [9-20]. |
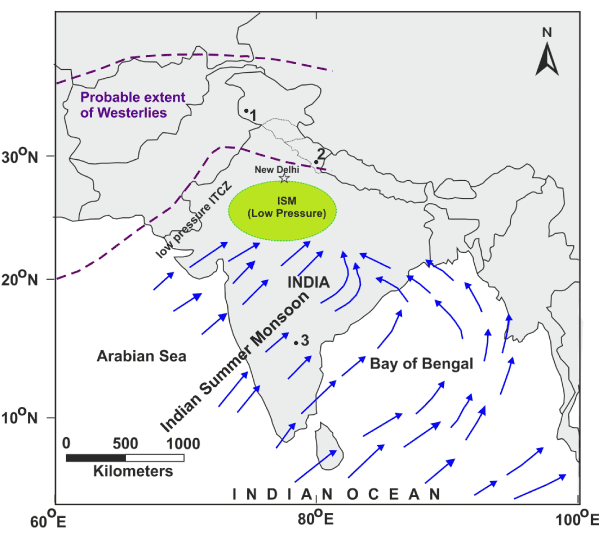
| It has been anticipated that the above records cannot be precisely correlated with the Himalayan records because of the additional role of Westerlies (in addition to the ISM) in the Himalaya [21,22]. The Himalayan region mainly experiences two seasons, i.e., summer and winter. The monsoonal summer precipitation generally occurs during June to September and decreases towards northwest. The Indian Summer Monsoon (ISM) is the main driver of climate (Figure 1), lasting from March-October in the eastern part, June-September in the central sector and July-August in the western Himalaya [23]. Under present-day conditions, the moisture in June and July is mainly transported from the southwest (Indian Ocean) and from the end of July until September, the precipitation is derived mainly from the Bay of Bengal (Figure 1). This reflects that not only the present but also the past climate should show variation in different sectors of the Himalaya particularly throughout latest Pleistocene-Holocene during which no major tectonic activity has been reported that may have resulted in the landscape modification. |
| Although various archive-proxy based palaeoclimatic researches through Pleistocene-Holocene transition are available from the Indian Himalaya [24-38] but the poorly dated profiles obstructs their being most ideal high resolution records except for the Tsokar and Tso Moriri multi-proxy high resolution studies [39-41] respectively. Further, precisely dated stalagmite based multi-decadal records are rare through the Late Pleistocene-Holocene transition [42] although δ18O precipitation variability during Middle to Late Holocene has been obtained through U/Th dated speleothems [21,22,43,44]. The present study forms the foremost speleothem research in the NW Himalaya. We may mention here that the speleothem inferred climatic variability from the locations dominated by the ISM [16,20,45,46] and the East Asian Summer Monsoon (EASM) [47,48] has been well established but, as mentioned above, these also may not be precisely correlated with the Himalayan palaeoclimatic records [21,22]. |
| Study Area |
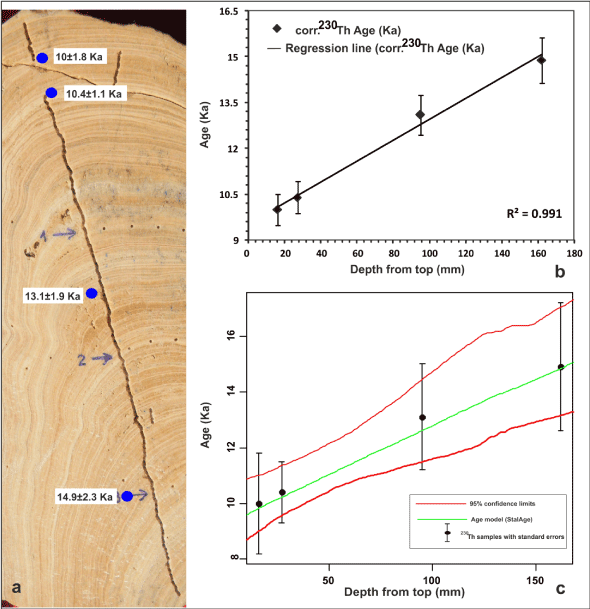
| The Kalakot stalagmite (KL-3, Figure 2a) was collected in 2009 from the Kalakot cave (33°13’19’’N: 74°25’33’’E, altitude 826 m, site 1 in Figure 1). The cave is almost horizontal, about 5 m long with main entrance as 1.8 m ×1.5 m and situated within the greyish colored and stromatolite bearing Great Limestone (also called as Sirban Limestone) [49] of the Precambrian age. The thickness of the host rock above the cave is about 50 m. The surrounding vegetation is dominated by broad leaved elements under warm/wetter environment with a few Pinus trees. The minimum and maximum mean annual precipitation at Jammu meteorological station (about 110 km SW of the cave) for ~75 years is recorded between 700 and 1,965 mm (Data from Indian Meteorological Department). We measured the humidity and temperature inside the cave during extreme summer (May, 2009) as 79% and 10.6°C respectively. Recently, the cave has been acquired by the local priest. |
| Methodology |
| Four U/Th dates (Table 1) were obtained by Thermal Ionization Mass Spectrometry at the Heidelberg Academy of Sciences, Heidelberg (Germany). Sample preparation methods and mass spectrometric analysis were followed as explained in Reference [50,51]. Ages were calculated using the half-lives of uranium-234 and thorium-230 [52]. Correction for detrital contamination assumes a 232Th/238U concentration ratio of 3.8 ± 1.9 and 230Th, 234U and 238U in secular equilibrium. The age uncertainties are quoted at 2σ level and do not include half-life uncertainties. The age-depth modeling was performed using the linear interpolation between U-series dates as well as StalAge (Figures 2b and 2c). The StalAge [53] allows uncertainty estimation and therefore helps in improving the interpretation of short-term variations in the presented record. |
| Mineralogy, surface morphology and crystal composition of the stalagmite at different depths were determined by using petrographic microscope as well as Scanning Electron Microscope (SEM) with Energy Dispersive Analysis (EDAX, Cambridge) at Jawaharlal Nehru Centre for Advance scientific Research (JNCASR), Bangalore, India. Sixteen SEM images were obtained from different parts of stalagmite at an interval of ca. 0.5 cm interval. The samples for isotopic analysis were drilled at an interval of 0.8 mm along the growth axis and δ18O and δ13C values were measured on 245 samples in the National Geophysical Research Institute, Hyderabad by using a Deltaplus Advantage Isotope Ratio mass spectrometer (IRMS), coupled with a Kiel IV automatic carbonate device. The obtained isotopic values are reported in δ notation as permil deviation from VPDB standard. The Analytical precision was better than 0.10% for δ18O and 0.05% for δ13C. The calibration standard was achieved by repeated measurements of international reference standards NBS19 and NBS18 [54]. For the Hendy test, 18 samples were drilled from three layers at various heights. |
| Results |
| Hendy test |
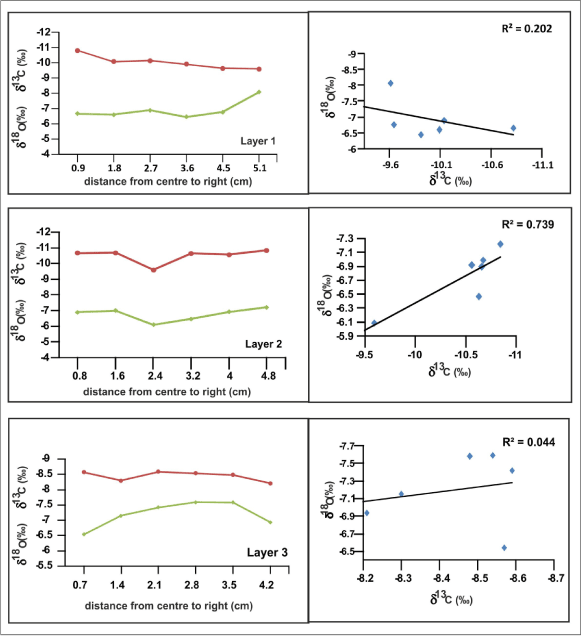
| The Hendy test is based on the deposition of carbonate stalagmite in the isotopic equilibrium with precipitating waters. Hendy [55] suggested a basic decisive factor that the δ18O and 13C should be in equilibrium at the time of formation of the stalagmite and proposed that the values of δ18O are ought to be similar within a single layer with no enrichment towards the outer side of the sample to ensure that there is no kinetic fractionation. We performed the test on the three layers (six samples from each layer) at depth of 6.5 cm, 10.2 cm and 15.9 cm respectively from the top. Each sample was measured from centre to the right end (outermost part) of the stalagmite. Our results (Figure 3) indicate that (1) in general, there is no enrichment of δ18O towards the outer end, and (2) there is no clear relationship between δ18O and δ13C along the same layer, and thus the stalagmite was formed under the isotopic equilibrium. However, the recent studies have proved that the stalagmites need not be in equilibrium with cave drip waters for the stable isotopic values to provide meaningful information about past environmental conditions. As a result, it is has been boldly argued that regardless of the Hendy test failure, speleothems can still be used as precipitation proxy, mainly because δ18O of speleothem calcite reveals rainfall rather than the temperature [46,56,57]. Further, the Hendy test has not been considered a controlling issue in the subtropical stalagmites [43]. |
| Stalagmite mineralogy and growth rate |
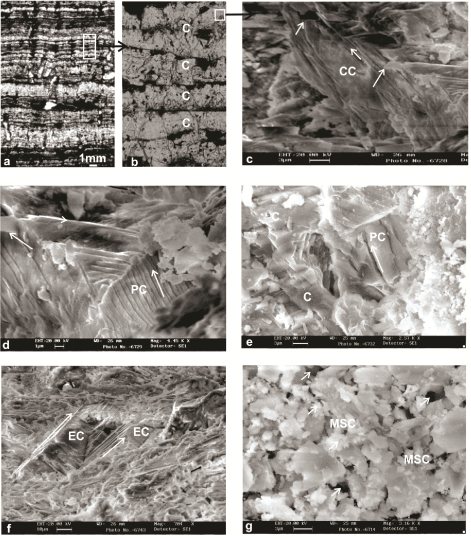
| The sample is composed of calcite. There is no discontinuity, hiatus or significant lithological change on the polished surface (Figure 2a). Four thin sections (3×2 cm) at depths of 0-3.0, 3.5-6.5, 7.0-10.0 and 10.5-13.5 cm from the top were prepared for petrographic analysis under plane polarized light. Petrographic images at 3.5-6.5 cm Figures 4a and 4b depths show various thin calcite laminations (Figure 4a) and high resolution image of the upper part shows flat-topped calcite layers (Figure 4b). Most of the sample is composed of finely laminated compact layers of calcite without showing much variation throughout except two thin porous layers at 6.2 cm and 10.3 cm. The flat-topped calcite layers probably show indication of thin film of water on the surface of the growing stalagmite. The SEM image at depth of 1.5 cm shows well-developed and long columnar calcite (CC), with clearly visible orientation and termination of the crystals (Figure 4c). The crystals of columnar calcite are parallel to each other and can be described as elongated and are wider than 10 microns. The boundary between columnar crystals displays equally-favoured crystallographic orientation, more or less normal to earlier growth surface. At depths of 3.0 and 9.5 cm, the crystals of palisade calcite (PC) are straight and parallel to each other (Figure 4d). The parallel interwoven calcite crystal boundaries and the approximate crystallographic orientations between the crystals is noticed (Figures 4d and 4e). At the depth of 12.0 cm, the crystals of equant calcite (EC) are closely packed and oriented parallel to each other (Figure 4f). Occasionally observed porous layers at 6.2 cm are composed of darker microsparitic calcite (MSC) with a few voids (Figure 4g). |
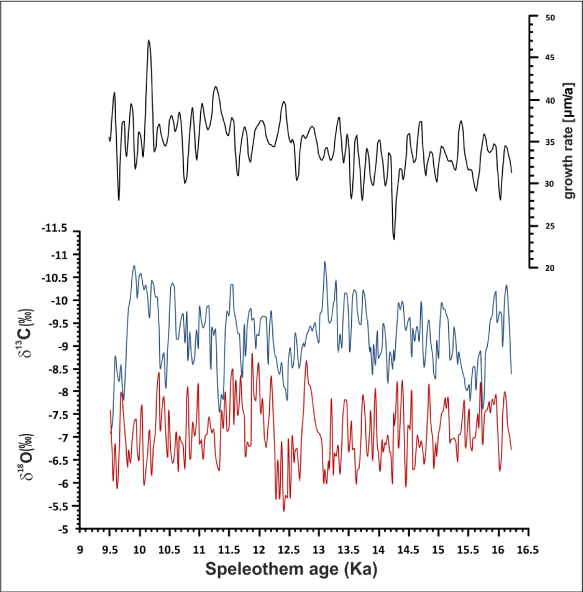
| Based on the statistically calculated growth rate by the StalAge, it is assumed that the KL-3 grew with a rate of ca. 23-47 μm/year with fluctuations. However, during a few multi-century events (e.g., ca. 14.5- 14.2, 12.8-12.5, 11.0-10.8, 9.8-9.6 ka BP), the growth was comparatively slower which can be correlated with the enriched δ18O and 13C values (Figure 5). From ca. 11.6 ka BP, the higher growth rate is observed, followed by a gradual decline from ca. 11.0 ka BP onwards. Since the growth ratio may also depend on other parameters and monitoring of the cave has also not been possible, no precise calibration can be made on the growth rate of the sample. |
| Variation in δ18O and δ13C values |
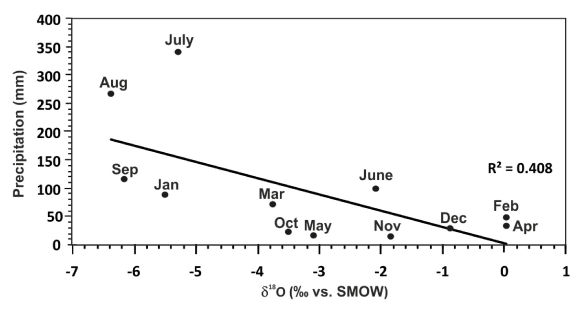
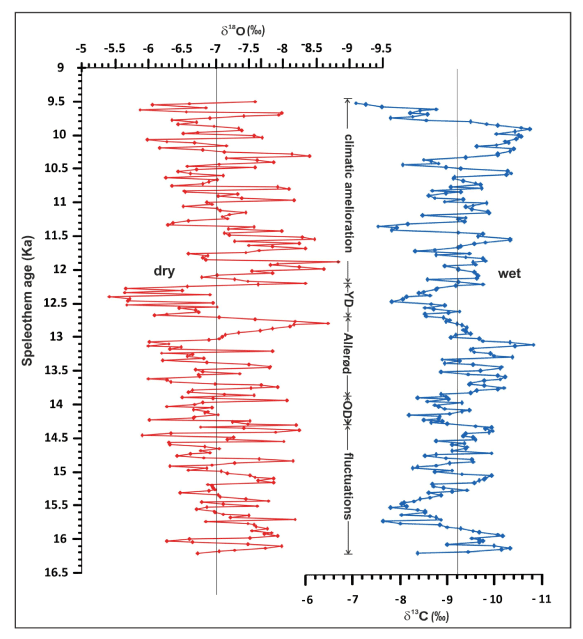
| The four years (2003-2006) δ18O precipitation data (GNIP, http:// www.iaea.org/water) from Jammu (ca. 100 km SE of the cave site) reveal that the higher precipitation during the monsoon months (July to September) is positively correlated with lighter δ18O values (Figure 6), therefore the lighter δ18O values may indicate increased monsoonal rainfall and vice versa. This is supported by the 44 years (1960-2004) mean monthly δ18O of precipitation and relative humidly from New Delhi showing that the lower δ18O values are indicative of high rainfall and more humidity (Figure 5) [43]. In the KL-3 sample, the δ18O and δ13C values range from -5.41 to -8.82% and -7.09 to -10.84% respectively. The variation in δ18O values (~3.5%) is somewhat higher than in the ISM dominated sites in the Peninsular India [22]. Since the values for both isotopes show fluctuations, we preferred to take average values (-7% for δ18O and -9.2% for δ13C) as reference points which may correspond to the consistent interpretation for average climatic pattern during which the stalagmite was formed. The present day mean annual δ18O precipitation value at Kalakot (GNIP, http:// www.iaea.org/water) is -6.8% which is very close to average δ18O values in the KL-3 sample. Thus, the δ18O values higher than the reference line (Figure 7) may be considered to represent the cooler/drier climate. On the other hand, the lower δ13C values should broadly indicate warmer or wetter climate (dominated by C3 plants). This is because the δ13C values in cave speleothems depends on the CO2 in the soil, fractionation and the extent of exchange between seepage drip water and host rock [58,59]. Use of δ13C for palaeoclimatic reconstruction is based on widely differing 13C/12C ratios of C3 and C4 plants. The C3 and C4 plants, separated on the basis of their photosynthesis pathways of carbon fixation have δ13C values in the range of -26 to -28% (with a mean of -26%) and -11 to -14% (with a mean of -12%) respectively [60]. The C3 plants are characteristic of favorable climatic regimes, while the C4, being an adaptation to environmental stress, predominate in arid, semi-arid and dry climatic regimes. Thus the C3 plants dominate in regions of higher soil moisture, whereas, C4 plants favour regions of lower soil moisture [61]. Therefore, under relatively warmer conditions when the C3 plants thrive, δ13C is affected by decomposition and degradation of C3 plants resulting in relatively lighter δ13C values in the stalagmites [62]. |
| Broadly, five phases of climatic pattern can be suggested (Figure 7) as (i) a period of fluctuating δ18O values including a number of excursions of more lighter and less heavier δ18O, indicating shifts in precipitation from ca. 16.3-14.3 ka BP, (ii) an interval between ca. 14.3 and 13.9 ka BP with more heavier values of both δ18O and δ13C that may show sign of the OD event, (iii) a signal of warm/wet period from ca. 13.9-12.7 ka BP, considered as footprints of the Allerød interstadial, (iv) A distinct event of heavier δ18O and δ13C from ca. 12.7-12.2 ka BP, representing YD, and (v) a sudden shift to the higher precipitation and transition to the wetter conditions with oscillations of the heavier δ18O as well as δ13C from ca. 12.2-9.5 ka BP. |
| Discussion |
| As mentioned in the text, the Himalayan sites show climatic divergence from those locations situated in the core monsoon zone of the Peninsular India. We compared our results with the Valmiki cave (solely dominated by the ISM) for similar age duration and noticed a near anti-correlation between the two records (Figure 8a). When compared with the Central Himalayan records, we observed a near similarity in broad pattern but a slight shift in the initiation of the YD event (Figure 8b). Therefore, we suggest that initiation of the so called global events may be at variance from location to location depending on the monsoon characteristics. From ca. 16.3 to 14.3 ka BP, the signal of the Bølling event is not very evident in our record though the oxygen isotope records from Central Himalayan speleothems point to the amplifying of monsoonal effective moisture transport towards north during the Bølling-Allerød period [42]. The Older Dryas is described as a cold period between the Bølling and Allerød interstadials towards the end of the Pleistocene. We have observed the OD stadial from ca. 14.3- 13.9 ka BP during the enriched δ18O and 13C, representing cold and dry event. Elsewhere from the Indian Himalaya, the OD is reported at ca. 14.3-13.8 ka BP from the central sector [28]. |
| In our record, the Allerød interstadial, encompassing a period of ca. 13.9-12.7 ka BP, is characterized by sudden lowering of the δ18O values. Within this duration, we have also noticed a few multi-decadal colder oscillations. A period of ca. 13.0-12.0 ka BP, characterized by onset of strong carbonate precipitation and presence of abundant aquatic plants in the interiors of the Higher Indian Himalaya is recognized as the Allerød event in the interiors of the Higher Indian Himalaya [40] during which the lithalsas also indicate a bigger sized lake in the Tso Kar region of NW Himalaya [39]. |
| The YD duration in the KL-3 stalagmite is identified between ca. 12.7 and 12.2 ka BP. This event has been considered as a major global postglacial cooling event [63,64] between 12.9 and 11.7 ka BP [65,66] and has been recognized throughout Europe, North Atlantic and North Pacific Oceans, Asia, North America and tropics in both ocean and terrestrial sediments [67,68]. The Dongge cave stalagmite has also record of the YD from 13.0-11.5 ka BP [47]. The age bracket of the KL-3 event is also similar as described from the Mediterranean region [69]. |
| In Asia, large portions currently lack records spanning the YD interval and in some parts, duration of the event has been reconstructed on the poor chronology. In India, the YD is reported as a prominent event from ca. 12.7-11.6 ka BP from a very well U/Th dated stalagmite from the Central Indian Himalaya [42]. In Ladakh Himalaya, the YD from ca. 12.5-11.6 ka BP, is marked by climatic deterioration and cooling in a very well dated Tso Kar lake profile [40] and is consistent with pollen studies from the same lake [70], and is also concurrent with speleothem records of Central Indian Himalaya [42] as well as from western Tibet lakes [71,72]. In Tibet and China, a maximum cooling of this event commenced at 12.8 BP in the Qinghai lake, 12 ka BP in the Guliya ice core and 12.5 ka BP in the Erhai lake [73]. |
| Although from poorly dated lake palaeolake profiles, the YD is also recognized in other parts of the Indian Himalaya. In Himachal, a short period of prominent diminution in local (meadow) and regional (desert steppe) vegetation from ca. 12.9-11.6 ka BP is ascribed to the YD event [37]. Based on the crude interpolated ages, the YD has been considered to occur between 12-11 ka BP [74] and ca. 12.8-12.7 ka BP [75] in the Higher Central Himalaya and from ca. 13.5-12.0 ka BP in the low lying humid Himalayan valley [28]. We believe that the signal of the YD is a prominent event in the Himalaya, Tibet and China. |
| Conclusion |
| The foremost record of the stalagmite based high resolution climatic changes from NW Himalaya between ca. 16.3-9.5 ka BP is presented using a suite of proxies, e.g., mineralogy, U/Th dating, growth rate, δ18O and 13C variations. The Kl-3 stalagmite, entirely made up of calcite, grew with fluctuating ratio between 23 and 47 μm/year with comparatively slower rate during ca. 14.5-14.2, 12.8-12.5, 11.0- 10.8, 9.8-9.6 ka BP, during the stadial oscillations. The ages, obtained by U/Th dating and linear interpolation show consistency despite of larger errors due to lesser amount of Uranium in the samples. In general, five stages of the climate pattern are suggested. Three events, e.g., OD stadial, Allerød interstadial and YD stadial are documented in the study. We suggest that the Late Pleistocene-Holocene records from the locations influenced by ISM and Westerlies reveal variations from those sites dominated only by the ISM. Since the time interval of multi-century scale events has been found different in various parts of globe, we believe that the variation in their commencement, duration and termination can be attributed to the latitude location, response time and temporal resolution. |
| Acknowledgements |
| We are grateful to Prof. Mangini, Heidelberg Academy of Sciences, Germany for kindly providing the U/Th dates. The financial assistance was provided by the Alexander von Humboldt Foundation project (Linkage Project, No 3-4-FoKoop, 396 DEU/1017420), Germany and Ministry of Earth Sciences, New Delhi (MoES/ PO/Geosci./43/2015). The working facilities were provided by the Heidelberg Academy of Sciences (Germany), CSIR-National Geophysical Research Institute (Hyderabad), Jawaharlal Nehru Centre for Advanced Scientific Research (Bangalore) and CAS in Geology, Kumaun University (Nainital). |
References
|
Tables and Figures at a glance
| Table 1 |
Figures at a glance
 |
 |
 |
 |
| Figure 1 | Figure 2 | Figure 3 | Figure 4 |
 |
 |
 |
| Figure 5 | Figure 6 | Figure 7 |
Relevant Topics
- Atmosphere
- Atmospheric Chemistry
- Atmospheric inversions
- Biosphere
- Chemical Oceanography
- Climate Modeling
- Crystallography
- Disaster Science
- Earth Science
- Ecology
- Environmental Degradation
- Gemology
- Geochemistry
- Geochronology
- Geomicrobiology
- Geomorphology
- Geosciences
- Geostatistics
- Glaciology
- Microplastic Pollution
- Mineralogy
- Soil Erosion and Land Degradation
Recommended Journals
Article Tools
Article Usage
- Total views: 12592
- [From(publication date):
March-2016 - Jul 04, 2025] - Breakdown by view type
- HTML page views : 11553
- PDF downloads : 1039
