Research Article Open Access
Spectrum Analysis Signature Whistle of Bottlenose Dolphins (Tursiops aduncus) at Captive, Indonesia with Yule-Walker AR and Welch Power Spectral Density Method
Muhammad Zainuddin Lubis1*, Pratiwi Dwi Wulandari1, Sri Pujiyati1, Totok Hestirianoto1, Keni Sultan2 and Muhammad Mujahid3
1Department of Marine Science and Technology, Bogor Agricultural University Jln Agatis, Kampus IPB Dramaga, Bogor 16680, Indonesia
2Research Laboratory of Safari Park, Cisarua Bogor 16750, Indonesia
3Bandung Institute of Technology, LAPI-ITB, Jln. Ganesha No 15-B Bandung 40132, Indonesia
- *Corresponding Author:
- Lubis MZ
Faculty of Fisheries and Marine Sciences, Department of Marine Science and Technology
Bogor Agricultural University, Jln Agatis Kampus IPB Dramaga, Bogor, 16680, Indonesia
Tel: +62 251 8425635
E-mail: lubiszainuddin@gmail.com
Received date: May 16, 2016; Accepted date: June 07, 2016; Published date: June 13, 2016
Citation: Lubis MZ, Wulandari PD, Pujiyati S, Hestirianoto T, Sultan K, et al. (2016) Spectrum Analysis Signature Whistle of Bottlenose Dolphins (Tursiops aduncus) at Captive, Indonesia with Yule-Walker AR and Welch Power Spectral Density Method. J Marine Sci Res Dev 6:195. doi: 10.4172/2155-9910.1000195
Copyright: © 2016 Lubis MZ, et al. This is an open-access article distributed under the terms of the Creative Commons Attribution License, which permits unrestricted use, distribution, and reproduction in any medium, provided the original author and source are credited.
Visit for more related articles at Journal of Marine Science: Research & Development
Abstract
Signal and spectrum analysis signature whistle of bottlenose dolphins using Wavelab, and Raven Pro 1.5 software. Analysis spectrum of bottlenose dolphin with software analysis Raven Pro 1.5 with wave data channels 1 with sample rates is 44100 Hz, encoding data 16-bit signed, length time duration is 0,7 second, and samples of data is 32386 and have 6 pattern of signature whistle bottlenose dolphins. Analysis of power spectral density used Power Spectral Density (PSD) Yule-Walker AR and Welch Power Spectral Density of signature whistles with location of research in safari park captivity, Indonesia. The pattern seen in the sound has six patterns of range is at 100-700 ms with frequency 6-22 kHz. Interval of whistle have range in pattern 1 is 100-200 ms, pattern 2 is 200-300 ms, pattern 3 is 320-370 ms, pattern 4 is 430-550 ms, pattern 5 is 550-600 and pattern 6 is 600-650 ms. Range intensity color -47 until -48 dB, range frequency 1-8 kHz, time duration 0-500 ms. Highest intensity value of signature whistle bottlenose dolphins (Tursiops aduncus) is -37.71 dB in frequency 18 kHz with time duration 100 ms. Yule-Walker AR methos have result in marker 1 (perpendicular line) with clay color have (x) 2728 and (y) -15.70 dB, and marker 2 with interrupted line have (x) value 5456 and (y) value -5.55 dB. Welch method have result in marker 1 (perpendicular line) with clay color have (x) 1365 and (y) -32,67 dB, and marker 2 with interrupted line have (x) value 2728 and (y) value -32.46 dB Welch power spectral density is a good method used for signal and spectrum analysis with object signature whistle of bottlenose dolphins.
Keywords
Bottlenose dolphins; Signature whistle; Yule-Walker AR; Welch; Frequency; Intensity
Introduction
Signals are important in communication systems in everyday life, signal processing, and electrical engineering is a function that "convey something of information or insight into actions and behaviors or attributes of some phenomena" [1] (Figure 1).

Figure 1: Bottlenose dolphins (Tursiops aduncus ).
In parts of the physical world, the results indicate the quantity of variation in the form of time or variations in the shape of space, and the potential of the signal that might provide information about a physical system status, or leave a message for each observer observer [1,2].
In acoustics science, spectrogram is the frequency spectrum of sound was be representation in visual as a function of time or another the variable [3]. Function of the spectrum analyzer is an passive acoustic instrument which can be used to converting the sound wave from the source of the note of musical into visual display of the constituental frequency [4]. Acoustic spectrogram was be generated by the analyzer of spectrum provides in acoustic signature sound from the source by passive acoustic intrumental. In addition fundamental frequency and its signature signal to revealing, the spectrogram is also useful for temporal attack analysis, broken, defended, and deleting of the signature signal note [5]. Sound source of a signal can have many different intensity and frequencies mixed. A siganture sounds is characterized by its spectrum of harmonic. In environment sound that we refer to as noise includes many different frequencies, intensity and sound press level (SPL). When the signal of sound contains a mixed of all audible from frequencies, distributed in equally over spectrum of audio, it is called to represented of white noise [3].
Individuals who have their signature whistles of dolphins acoustic environment is through the experience with them [6,7], resulting in a unique whistle contour results with a high level scale kekhasandari individual who is independent of voice features common [8]. Information on the identity of the signature whistles encoded in different frequency contour of this study to analyze the signature whistles of stereotypes [8,9] (Figure 2).

Figure 2: Set of acoustic instrumental.
They can be manufactured as a single signal, or berhubngan or interrupted with a multi-looped form and they are often also produced in a fight which contains a repetition of the type of whistle same signature [9]. Signature whistles (Tursiops aduncus ) we have documented in captivity (the safari park, Indonesia) and free from 2 animals [10,11]. However, with the exception of marine mammals dolphins (Tursiops sp) Exist in the area of Shark Bay, in Australia [12], little attention has been given to the species, whether using a signature whistle. In addition, learning about the production of the results of vocalization, the process by which a whistle signature species that thrive in T. truncatus [7,13], and they must be assured and demonstrated in Specific species of other marine mammals [14]. Here we study the signal and spectrum analysis of the signature whistles of dolphins (Tursiops aduncus ) and Power Spectral Density (PSD) Yule- Walker AR and Welch Power Spectrum Meeting of signature whistle in the safari park, Cisarua, Bogor, Indonesia.
Methods
Data collection and acoustic data analysis
Data were collected in captivity, Indonesia on May 2015. Passive acoustic instruments for the retrieval of data collected using this type SQ3 hydrophone with built-in preamplifier, sensivity than 165 dB return V / μPa, and that the frequency response of 5 Hz - 35 kHz (±3 dB). SQ 3 recorder with software Wavelab 6 Software, and store data with a form that is WAV files with 16-bit. All acoustic wave file, aural, and spectrograms checked using software Wavelab 6 and Raven Pro software (version 1.5; Cornell Laboratory of Ornithology, NY). It can be used as a connector in combination with Hanning window function, temporal network within 0.7s with an overlap of 50% from 100%, and 22 kHz frequency resolution grid with the size of the window and the Fast Fourier Transform (FFT) size both in 2048 (depending on the level samples of sound files of dolphins diperole), produces filter 3-dB bandwidth of 22 kHz. During the recording process by using a hydrophone in the treatment of swimming events at the safari park with a pool depth of 0.5 m below the water surface. In the event the pool there are two dolphins are used as research objects. Number two dolphins have the same size, without a name or designation given.
Dolphins bottle has a length of 2.6 meters, weighs 232 kg, and the age of 14 years (dolphins are classified as adults). The treatments were given in this study is a before and after meals with dolphins object 2 bottles. Figure one set of passive acoustics (Figures 3 and 4) and Sketch in research can be seen in Figure 4.

Figure 3: Map of research location (safari park, Cisarua Bogor,Indonesia).

Figure 4: Sketch of experimental research of dolphins in safari park.
Recording whistle
Values in the propagation of the pressure wave away from the sound in a medium to have a component of particle velocity (v) and has a component of the pressure (p), as well as defining the product acoustic intensity (I), in equation is:
I = p.v (1)
V is the velocity of pressure divided by the acoustic impedance of the medium. The acoustic impedance of the media that is (p) in equation is:
I=p2/(ρc) (2)
In decibel, the equation is:
 (3)
(3)
I0 is the intensity of sound target of the sound pressure in scale is 1 mPa in seawater measured, quantify the sound pressure in equationts is:
 (4)
(4)
Welch method will result in increased an estimation method consists of four steps (Welch 1967). Periodogram method used to determine the power density of the frequency components in the signal based on Fourier transform. Welch method of estimating the power spectral density with an average modified periodogram. With periodogram modifications are:
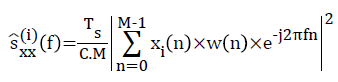 (5)
(5)
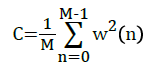
where f = fs is the frequency variable normalized to have a unit of cycles per sample. The scale factor Ts adjust the amount of time discrete signal spectrum to be the same as the analog signal spectrum. M is the length of the signal x (n). Windowing function represented by the sample w (n), and C is a normalization constant defined as:
 (6)
(6)
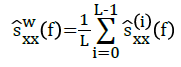
Finally, the estimation of the power density spectrum is:
 (7)
(7)
Whistles are assigned to specific individuals when dolphins were alone near the hydrophone (passive acoustic instrument), near the sole (<0.5 m) from the hydrophone, or the bubble emissions showed that simultaneous and correlated with a whistle (Figure 5).

Figure 5: Filter Design with Band Pass Filter (BPF).
Although the results in the form of variable amplitude in the vocalizations of dolphins, individuals are more than 3 m of passive acoustic equipment itself to make the recording never emitted a whistle as loudly as a dolphin in 0.5 m. If a group of dolphins came to the hydrophones, the intensity of the whistle is used only to determine the individual whistle when one of the dolphins was close to the position of the hydrophone (<0.5 m) and the rest of the group was further (≥3 m). Filters used to design the data whistle Band Pass Filter (BPF), Band Pass Filter design can be seen in Figure 5.
Results and Discussion
This study has demonstrated signal and spectrum analysis the whistle of bottle nose dolphins (Tursiops aduncus ), clustering spectrum and power spectral density Yule-Walker AR and Welch Power Spectral Density using signature whistles (Figure 6). While this paper aims to describe whistles sound recorded in captivity, Indonesia, and the bottlenose dolphins have traine for behaviour in show pool. The pattern seen in the sound has six patterns of sound that is at 0-700 ms with frequency 0-2200 Hz.
Interval of whistle have range in pattern 1 100-200 ms, pattern 2 200-300 ms, pattern 3 320-370 ms, pattern 4 430-550 ms, pattern 5 550-600 and pattern 6 600-650 ms. This suggests a different sound patterns within a specific time range produced by bottlenose dolphins with maximum time is 100 ms with range power 80-90 kU (Figure 6), and the result is almost the same as the previous study [10,11,15,16]. The clustering of whistle have 8 pattern, the result have using Matlab R2008b with signal processing method (Figure 7), and highest magnitude value in pattern 2 with 0.9 dB. Result of intensity, frequency, and time duration in 3D can be senn in Figure 8.

Figure 6: Spectrum Analysis Signature whistle of bottlenose dolphins (Tursiops aduncus ).

Figure 7: Clustering of whistle bottlenose dolphins.

Figure 8: 3D Intensity (y), Frequency (x), and Time duration (z) of signature whistle.
Figure 6 showed the analysis spectrum of bottlenose dolphins in captive with software analysis Raven Pro 1.5 with wave data channels 1 with sample rates is 44100 Hz, encoding data 16-bit signed, length time duration 0,7 second, and samples of data is 32386 and have 6 pattern of signature whistle bottlenose dolphins.
In Figure 8 showed the 3D figure of intensity (y axes), frequency (x axes), and time duration (z axes) with range intensity color -47 until -48 dB, range frequency 1-8 kHz, time duration 0-500 ms. Highest intensity value of signature whistle bottlenose dolphins (Tursiops aduncus ) is -37.71 dB in frequency 18 kHz with time duration 100 ms. This result showed signature whistle which really is at range frequency 5-6 kHz with highest intensity is -40 dB (Figure 8). Result of Max frequency of whistle in this research be same according in the references [10,17,18].
A result obtained from the Figure 9 has a difference that allows the difference equations used. These results were obtained in the same voice and the same dolphins. It is apparent that the equation welch magnitude value (dB) at the highest frequency range of 500-1000 Hz and 7000 Hz -7500 with the same frequency difference is 5 kHz. Yule- Walker AR power spectral density have result in marker 1 (perpendicular line) with clay color have (x) 2728 and (y) -15.70 dB, and marker 2 with interrupted line have (x) value 5456 and (y) value -5.55 dB (Figure 9a). Welch power spectral density have result in marker 1 (perpendicular line) with clay color have (x) 1365 and (y) -32,67 dB, and marker 2 with interrupted line have (x) value 2728 and (y) value -32.46 dB (Figure 9b). The results of x (frequency) and y (intensity) values obtained by the two equations differ very significantly towards the results of the frequency and intensity are produced, how it has been described by [19,20]. Total of data can be affect to result of spectral density estimates according in reference [21]. Result of welch spectral density have a diffrence in frequency and intensity with Yule-Walker AR power spectral density after described in previous studies [19,22-25].

Figure 9: Power Spectral Density (PSD); a) Yule-Walker AR, and b) Welch Method of signature whistle.
Conclusion
Signal and spectrum analysis signature whistle of bottlenose dolphins in captivity, Indonesia have total of whistle pattern is 6, range frequency of signature whistle is 5-6 kHz with intensity -40 dB. This result have different in intensity and frequency value using software Raven Pro 1.5, Yule-Walker AR power spectral density, and welch power spectral density in signal processing method. Welch power spectral density is a good method used for signal and spectrum analysis with object signature whistle of bottlenose dolphins.
References
- Priemer R (1991) Introductory signal processing. World Scientific.
- Sinha P (2009) Speech processing in embedded systems. Springer Science & Business Media.
- Brzeźniak Z, Goldys B, Peszat S, Russo F (2015) Second order PDEs with Dirichlet white noise boundary conditions. J of EvolEqtns 15: 1-26.
- Hsieh HJ, Hung JW (2015) Magnitude replacement of real and imaginary modulation spectrum of acoustic spectrograms for noise-robust speech recognition. In Consumer Electronics-Taiwan (ICCE-TW), 2015 IEEE International Conference on p: 328-329.
- de Oliveira AG, Ventura TM, Ganchev TD, Figueiredo JM, Jahn O, et al. (2015) Bird acoustic activity detection based on morphological filtering of the spectrogram. Applied Acoustics 98: 34-42.
- Miksis JL, Tyack PL, Buck JR (2002) Captive dolphins, Tursiopstruncatus, develop signature whistles that match acoustic features of human-made model sounds. The Jof the Acoustical Society of America 112: 728-739.
- Fripp D, Owen C, Quintana-Rizzo E, Shapiro A, Buckstaff K, et al. (2005) Bottlenose dolphin (Tursiopstruncatus) calves appear to model their signature whistles on the signature whistles of community members. Animal cognition 8: 17-26.
- Janik VM, Sayigh LS, Wells RS (2006) Signature whistle shape conveys identity information to bottlenose dolphins. Proceedings of the National Academy of Sciences 103: 8293-8297.
- Janik VM, King SL, Sayigh LS, Wells RS (2013) Identifying signature whistles from recordings of groups of unrestrained bottlenose dolphins (Tursiopstruncatus). Marine Mammal Science 29: 109-122.
- Wulandari PD, Pujiyati S, Hestirianoto T, Lubis MZ (2016) Bioacoustic Characteristic Click Sound and Behaviour of Male Dolphins Bottle Nose (Tursiopsaduncus). J Fisheries Livest Prod 4: 2.
- Lubis MZ, Wulandari PD, Hestirianoto T, Pujiyati S (2016) Bioacoustic Spectral Whistle Sound and Behaviour of Male Dolphin Bottle Nose (Tursiopsaduncus) at Safari Park Indonesia, Cisarua Bogor. J Marine Sci Res Dev 6: 2.
- Au WWL, Branstetter B, Moore PW, Finneran JJ (2012) “The biosonar field around an Atlantic bottlenose dolphin (Tursiopstruncatus),” J AcoustSoc Am 131: 569-576.
- Hiley HM, Perry S, Hartley S, King SL (2016) What’s occurring? Ultrasonic signature whistles use in Welsh bottlenose dolphins (Tursiopstruncatus). Bioacoustics pp: 1-11.
- Muhammad Z, Pujiyati S (2015) Influence of Addition of Salt Levels against Study of Bio-Acoustic Sound Stridulatory Movement Fish Guppy (Poeciliareticulata).
- Bebus SE, Herzing LD (2015) Mother-Offspring Signature Whistle Similarity and Patterns of Association in Atlantic Spotted Dolphins (Stenellafrontalis) Scinow Publications Ltd. ABC 2015, Animal Behavior and Cognition 2:71-87.
- Moron JR, Andriolo A (2015) Preliminary evidence for signature and copied whistles among spinner dolphins in the Southwest Atlantic Ocean: Beacon purpose?. The J of the Acoustical Society of America 138: 1904-1904.
- Ward R, Parnum I, Erbe C, Salgado-Kent C (2016) Whistle Characteristics of Indo-Pacific Bottlenose Dolphins (Tursiopsaduncus) in the Fremantle Inner Harbour, Western Australia. Acoustics Australia 1-11.
- Amorim TOS, Andriolo A, Reis SS, Dos Santos ME (2016) Vocalizations of Amazon river dolphins (Iniageoffrensis): Characterization, effect of physical environment and differences between populations. The Journal of the Acoustical Society of America 139: 1285-1293.
- Alkan A, Yilmaz AS (2007) Frequency domain analysis of power system transients using Welch and Yule–Walker AR methods.Energy conversion and management 48: 2129-2135.
- Roy M, Barman S (2016) Improved gene prediction by principal component analysis based autoregressive Yule-Walker method. Gene 575: 488-497.
- Liu XD, Huang XY, Chen YP, Shi MH (2016) Analysis of Cycling Operation Characteristics of Oscillating Heat Pipe Based on AR Power Spectrum. J of engineering Thermophysics p: 37.
- Posada-Quintero HF, Florian JP, Orjuela-Cañón AD, Aljama-Corrales T, Charleston-Villalobos S, et al. (2016) Power Spectral Density Analysis of Electrodermal Activity for Sympathetic Function Assessment. Annals of Biomedical Engineering 1-12.
- Renard N, Deck S, Sagaut P (2016) Spectral Assessment of the Turbulent Convection Velocity in a Spatially Developing Flat Plate Turbulent Boundary Layer at Reynolds Number Re_\ theta= 13\, 000. In Progress in Wall Turbulence, Springer 2: 379-389.
- Welch PD (1967) The use of fast Fourier transform for the estimation of power spectra: A method based on time averaging over short, modified periodograms.IEEE Transactions on audio and electroacoustics15: 70-73.
- Lubis MZ, Pujiyati S, Hestirianoto T (2016) Bioacoustic Characteristic of Male Dolphins Bottle Nose (Tursiopsaduncus).Intern Journal ofScientific Engineering and Technology
Relevant Topics
- Algal Blooms
- Blue Carbon Sequestration
- Brackish Water
- Catfish
- Coral Bleaching
- Coral Reefs
- Deep Sea Fish
- Deep Sea Mining
- Ichthyoplankton
- Mangrove Ecosystem
- Marine Engineering
- Marine Fisheries
- Marine Mammal Research
- Marine Microbiome Analysis
- Marine Pollution
- Marine Reptiles
- Marine Science
- Ocean Currents
- Photoendosymbiosis
- Reef Biology
- Sea Food
- Sea Grass
- Sea Transportation
- Seaweed
Recommended Journals
Article Tools
Article Usage
- Total views: 12205
- [From(publication date):
June-2016 - Mar 31, 2025] - Breakdown by view type
- HTML page views : 11263
- PDF downloads : 942