Research Article Open Access
Spectrophotometric Determination of Nifedipine and Nicardipine in their Pharmaceutical Preparations
Mohamed A. El Hamd1, Ahmed A. H. Abdellatif2*, Sayed M. Derayea3, Osama H. Abdelmageed4 and Hassan F. Askal5
1Department of Pharmaceutical Analytical Chemistry, Faculty of Pharmacy, Al-Azhar University, Assiut 71524, Egypt
2Department of Pharmaceutics and Industrial pharmacy, Faculty of Pharmacy, Al Azhar University, Assuit 71524, Egypt
3Department of Pharmaceutical Analytical Chemistry, Faculty of Pharmacy, Minia University, Minia 61519, Egypt
4Department of Pharmaceutical Chemistry, Faculty of Pharmacy, King Abdulaziz University, Jeddah 21589, Kingdom of Saudia Arabia
5Department of Pharmaceutical Analytical Chemistry, Faculty of Pharmacy, Assiut University, Assiut 71526, Egypt
- *Corresponding Author:
- Ahmed A. H. Abdellatif
Department of Pharmaceutics and Industrial pharmacy
Faculty of Pharmacy, Al Azhar University
Assuit 71524, Egypt
Tel: +20 1016660069
E-mail: ahmed.a.h.abdellatif@azhar.edu.eg
Received date: September 19, 2015; Accepted date: September 30, 2015; Published date October 07, 2015
Citation: Hamd MAE, Abdellatif AAH, Derayea SM, Abdelmageed OH, Askal HF (2015) Spectrophotometric Determination of Nifedipine and Nicardipine in their Pharmaceutical Preparations. Ind Chem Open Access 1:103. doi:10.4172/2471-2663.1000103
Copyright: © 2015 Hamd MAE, et al. This is an open-access article distributed under the terms of the Creative Commons Attribution License, which permits unrestricted use, distribution, and reproduction in any medium, provided the original author and source are credited.
Visit for more related articles at Industrial Chemistry
Abstract
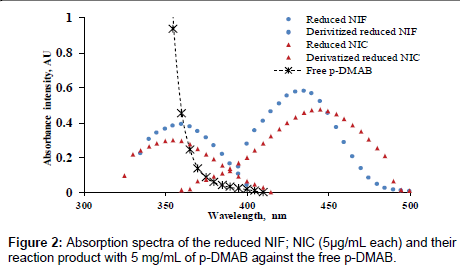
A sensitive and selective spectrophotometric method was developed for determination of nifedipine (NIF) and nicardipine (NIC) in their pharmaceutical preparations. The method based on a rapid reduction of the nitro to primary amino groups using zinc dust and hydrochloric acid. The resulting primary aromatic amine was subjected to a condensation reaction with p-dimethyl amino benzaldehyde to produce a yellowish-green color of Schiff’s bases which quantified spectrophotometrically at the absorption maxima of 434 and 441 nm for NIF and NIC, respectively. Beer’s law was obeyed in the concentration ranges 2.0 to 12.0 μg/mL with a limit of quantitation 1.4 and 1.9 μg/mL and the mean percentage recoveries 98.2±0.3 to 99.5±0.3% NIF and NIC, respectively. The proposed methods were successfully applied to assay NIF and NIC in their capsules and tablets.
Keywords
Sensitive spectrophotometric method; Nifedipine; nicardipine; p-DMAB reagent; Capsules and tablets.
Introduction
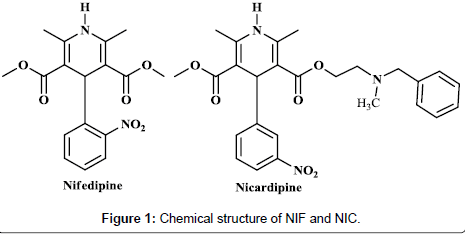
Nifedipine (NIF) and nicardipine (NIC) (Figure 1) are the prototypical of 1,4-dihydropyridine (1,4-DHP) and calcium channel blockers have the therapeutic activities of peripheral and coronary vasodilation. They are used in the management of hypertension, angina pectoris, and some other cardiovascular disorders. Many analytical methods have been developed for their determination in bulk, pharmaceutical formulations, and in biological fluids such as; Spectrometric methods (Spectrophotometric [1-8] and spectrofluorimetric [5, 9-13]), Electrochemical methods [14-16], liquid chromatographic method using different modes of detections [17-22].
Visible spectrometry is probably the most widely used analytical technique, it is very widely used in clinical chemistry, and environmental laboratories because many substances can be converted to colored derivatives, and the instrumentation is ready available and generally fairly easy to operate [23]. The aim of the study was to develop a simple method for precise routine determination of these important drugs in our medical community in Egypt.
Experimental
Instrumentation
Absorbance measurements were made on a Shimadzu model 1601 double beam UV/Visible spectrophotometer (Shimadzu, Tokyo, Japan) with two matched 1.0 cm thickness quartz cells for sample measurements. Jenway 6305, UV-Visible Spectrophotometer (Jenway LTD, U.K), and MLW type thermostatically controlled water bath (Memmert GmbH, Schwabach, Germany).
Materials and methods
Reagent and standard: All chemicals were of analytical reagent grade and were used without further purification. P-dimethylaminobenzaldehyde, 3mg/mL (p-DMAB, Winlab Co., UK) was prepared in ethanol. Zinc dust and hydrochloric acid (HCl, 35.5%) methanol, ethanol, propanol, and acetone were obtained from El Nasr chemical co. (Abu Zaabal, Egypt).
weight variation: The reference standards of pure drugs were generously supplied by their respective manufacturers and they were used without further purification. Selecting twenty tablets and capsules can carry out the weight variation randomly and average weight was determined. Then individual tablets were weighed and the individual weight was compared with an average weight. All the tested tablets and capsules were weighed individually before performing the dissolution test using a research analytical weighing balance. The average weight of the obtained tablets and capsules were calculated using Microsoft Office Excel 2007 [24-25].
Reduction of the nitro group and preparation of standard drug solutions: A stock standard of NIF and NIC solutions were freshly prepared and kept in dark containers due to their photosensitivity [26]. A stock solution 0.5 mg/mL of drugs were prepared in ethanol, then the solution was treated with 20 mL of HCl (3N) and 1g of Zinc dust with shaking until 10 min in a beaker [27]. The mixture solution was filtered then made up to 100 mL with ethanol. Finally, the reduced stock solutions were subjected to the general recommended procedure after dilution with ethanol to fulfill the required concentrations.
Procedure for calibration curve: One-milliliter of the reduced NIF or NIC standard solution with different concentrations was transferred into 10-mL calibrated flasks. 1.0 mL of p-DMAB reagent was added, mixed well and lift for 25 min to for reaction compellation and produce a yellowish-green color. The chromogen was measured at 434 or 441 nm, respectively for NIF and NIC against the blank sample treated similarly after dilution by ethanol to the mark.
Pretreatment procedures for pharmaceutical preparation
Capsule and tablet contain single drug: Twenty tablets or capsules contents were emptied, weighed accurately and the contents were mixed thoroughly. A quantity of the powdered tablets or capsules equivalent to 50 mg of NIF or NIC respectively was treated in ethanol as mentioned above without interference from the pharmaceutical excipients.
Capsules contain NIF and atenolol: Twenty capsules of Tenolat SR® were treated similarly as described above; the resulting reduced solutions were successfully free-from any interference.
Content uniformity: The content uniformity test was carried out by randomly selecting ten tablets and capsules. The tablets and capsules were weighed and powdered, a quantity of powder equivalent to one mg of drug was transferred to a 50-mL volumetric flask, 40 mL water is added and treated similarly as described above. The drug content was calculated using the standard calibration curve and the mean percent of drug content was calculated as an average of three determinations [24].
Results
p-DMAB concentration
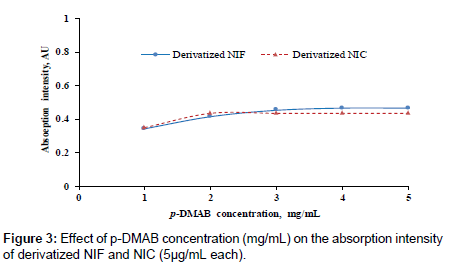
The absorption intensity of yellowish-green color was studied as a function of the p-DMAB concentrations. Different p-DMAB concentrations (1.0-5.0 mg/mL in ethanol) were used to determine the optimum reagent concentration, (Figure 3). The highest color intensity was attained when the concentration of p-DMAB between 2 to 5 mg/ mL whatever; the desirable concentration was 3 mg/mL.
Effect of temperature
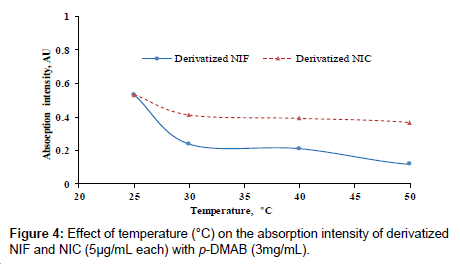
Different degrees of temperature (25-60°C) were carried out to study its effect on the reaction between p-DMAB and the investigated drugs. The measurements were decreased as the temperature increased as in (Figure 5). The highest color intensities were obtained at the room temperature 25 ± 5°C.
Reaction time
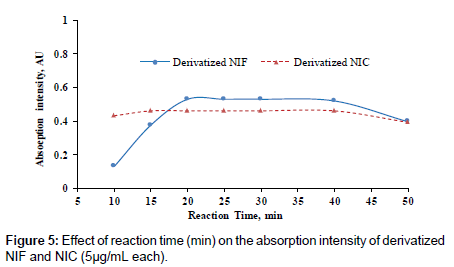
The effect of time on the reaction between the investigated drugs and p-DMAM was studied by carrying out the reaction for different periods of time ranging from 10-50 min. The reaction was completed after 20°C, but for the precise and reproducible measurements the reaction time was selected after 25 min, (Figure 5).
Diluting solvents
Next, various solvents such as water, ethanol, methanol, propanol, and acetone were tested in order to select the most suitable one for the further measurements. The highest measurements were obtained when ethanol was used as a diluting solvent.
Determination of molar ratio
The Job’s method of continuous variation [28] was employed. Master equimolar solutions (1×10⁻³ M) of both p-DMAB and the investigated drugs were prepared. Series of 10-mL portions of the master solutions were made up comprising different complimentary proportions (0:10, 1: 9, ……, 9:1, 10:0) in 10-mL volumetric flasks, mixed well, and allowed to stand for 30 minutes at room temperature (25 ± 5°C), then subjected to the recommended procedure. The stoichiometry of the reaction was 1:1 ratio for both drugs as shown in (Figure 6).
Discussion
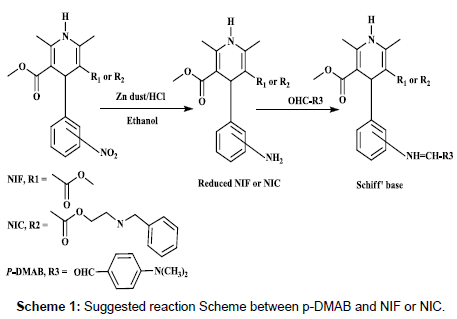
In the present work, the quantitative reaction between the investigated drugs and p-DMAB was proposed. The nitro group present in the structure of NIF and NIC were reduced to primary aromatic amino groups with Zn/HCl mixture and condensed with aldehyde p-DMAB. The reaction was based on imine formation in acid catalyzed environment, which having characteristic yellowish-green color was measure spectrophotometrically at the respective wavelengths.
Many parameters affect the reaction were studied carefully and optimized. Initially, the reduced NIF and NIC (without derivatization) show absorption spectra at 360 and 355 nm, respectively. But after derivatization with p-DMAB, the absorption spectra of both drugs had a hyperchromic effect and blue shift respectively, at 434 and 441 nm, (Figure 2)
The reaction between NIF, NIC, and p-DMAB is presented in Scheme 1; which can be explained as the following: the presence of HCl in the pretreatment step which protonated the carbonyl oxygen of p-DMAB leaving the carbonyl carbon fully positively charged. The reduced NIF and NIC donated a lone pair of electrons to the carboxyl carbon. Finally, after condensation and dehydration thereafter results in the formation of condensation products plus water and proton as a by-products [29].
Validation of proposed method
Linearity range, detection, and quantification limits: The linearity was found in the concentration range of 2.0 to 12.0 μg/mL with high correlation coefficients (r = 0.983-0.991), as shown in (Table 1). The reproducibility, repeatability, and accuracy of method, are acceptable as shown by the low values of coefficient of variation (CV) with acceptable accuracy, (Table 2). The recovery percent value in the range of 98.2 ± 0.3 to 99.5`0.3% indicates non-interferences from the formulation excipients or other combined drugs (Table 4).
| Drug | Conc., μg/mL | r1 | Regression equation2 | LODμg/mL | LOQμg/mL | ε3×10⁴ l/mol/cm |
|---|---|---|---|---|---|---|
| NIF | 2-12 | 0.991 | Y=0.091x-0.041 | 0.494 | 1. 41 | 2.968 |
| NIC | 2-12 | 0.983 | Y=0.051x+0.074 | 0.358 | 1.94 | 3.432 |
1r: correlation coefficient; 2Y: absorbance intensity and x: Sample conc., μg/mL; 3ε: molar absorptivity
Table 1: Quantitative parameters and statistical data for the proposed method.
| Drug | Conc., μg/mL | Accuracy % (n-5) | Precision CV (%), n=5 | |
|---|---|---|---|---|
| Intra-day | Inter-day | |||
| NIF | 5 | 98% | 0.5 | 8.5 |
| NIC | 5 | 94% | 0.8 | 10.0 |
Table 2: Assay of five replicate samples of the studied drugs by p-DMAB reagent.
A small variation in concentration of p-DMAB or the reaction time on the method suitability was checked as in (Table 3), it was found that none of these variables significantly affect the proposed methods at a small change in the original optimization.
| Variation | Recovery%±SD,n=3 | |
|---|---|---|
| NIF | NIC | |
| No variation | 98±0.2 | 99±0.2 |
| p-DMAB concentration4 μg/mL 6 μg/mL |
97±0.7 98±0.2 |
97±0.1 99±0.3 |
| Reactiontime 29 min 31 min |
99±0.6 98±0.3 |
97±0.7 99±0.1 |
Table 3: Robustness of the p-DMAB method for analysis of NIF and NIC drug, 5.0μ/mL.
Method application:The good satisfactory results for the investigated drugs in bulk forms were encouraged to apply this procedure for assay their capsules and tablets. The results were compared with those obtained by the official [26] and reported methods [30] with respect to the accuracy (t-test) and precision (F-value). All of the content uniformity of all tablets and capsules with IP limits of 85 - 115 % of drug and none contain below 75 - or above 125% of drug as shown in (Table2 and 4).
| Product | Recovery % ± SD, n=5 | t-test1 | F-value1 | |
|---|---|---|---|---|
| Proposed method | Official or reported method2 | |||
| Epilate®capsules | 98 ± 0.3 | 99 ± 0.1 | 2.9 | 1.3 |
| Epilate Retard®tablets | 98 ± 0.2 | 98 ± 0.1 | 2.1 | 0.9 |
| Tenolat SR®capsules3 | 99 ± 0.3 | 100 ± 0.7 | 1.8 | 1.3 |
| Pelcard SR®capsulesc | 99 ± 0.3 | 99 ± 0.1 | 1.6 | 1.1 |
1Theoretical values for F and t at 95% confidence limit (n = 5) were 6.39 and 2.78 respectively; 2Reported methods [30]; 3Drugs in combinations, NIF plus atenolol.
Table 4: Determination of NIF and NIC in capsules and tablets using the proposed method.
1Theoretical values for F and t at 95% confidence limit (n = 5) were 6.39 and 2.78 respectively; 2Reported methods [30]; 3Drugs in combinations, NIF plus atenolol.
Conclusion
The proposed method is accurate, precise, and economic that can be successfully employed for the routine analysis for NIF and NIC in the oral dosage forms. There is no requirement of any sophisticated apparatus as in chromatographic methods. Omission of an extraction step with organic solvents is an added advantage.
References
- Esfahani N, Moghadam M, Valipour MG (2008) Rapid and efficient aromatization of Hantzsch 1,4-dihydropyridines with potassium peroxomonosulfate catalyzed by manganese (III) Schiff base complexes. JIran ChemSoc 5:244-251.
- RahmanN, Azmi SNH (2005) New spectrophotometric methods for the determination of nifedipine in pharmaceutical formulations. ActaBiochim Pol 52:915-922.
- Rahman N, Azmi SNH (2006) Validated spectrophotometric method for the assay of nifedipine in bulk and commercial dosage forms. Science Asia 32: 429-435.
- Mahadik K (1991)Spectrophotometric estimation of nifedipine and its formulation. East-Pharm: 34121-34122.
- Askal HF, Osama HA, Sayed MS Ali, El Hamd MA (2010) Spectrophotometric and spectrofluorimetric determination of 1,4-dihydropyridine drugs using potassium permanganate and cerium (iv) ammonium sulphate. Bull PharmSci33: 201-215.
- Sayed MD, Hassan FA, Abdel-Megeed OH, El Hamd MA (2012) Spectrophotometric determination of amlodipine and nicardipine in pharmaceutical formulations via binary complex formation with eosin Y. Journal of Applied Pharmaceutical Science 2: 84-89.
- El Hamd MA, Sayed MD, Osama HA, Hassan FA ( 2013) Spectrophotometric method for determination of five 1,4-dihydropyridine drugs using N-bromosuccinimide and indigo carmine dye. International Journal of Spectroscopy 1: 1-7.
- El Hamd MA, Sayed MD, Osama HA, Hassan FA ( 2013) Colorimetric method for determination of some 1,4-dihydropyridine drugs in their tablets and capsules. Journal of Advances in Chemistry 4: 278-287.
- El Hamd MA, Sayed MD, Osama HA, Hassan FA (2009) Spectrofluorimetric determination of amlodipine. Mansoura J of PharmScien 25: 31-38.
- Ahadbavili T (2007) A new spectrofluorimetric method for determination of nifedipine in pharmaceutical formulations. Chemiaanalityczna 52: 635-643.
- Walash MI, Belal F, El-Enany N, Abdelal AA (2009) Kinetic spectrofluorometric determination of certain calcium channel blockers via oxidation with cerium(IV) in pharmaceutical preparations. Int J BiomedSci5: 146-157.
- Al-GhannamSM, Al-OlyanAM (2008) Spectrofluorometric determination of nicardipine, nifedipine and isradipine in pharmaceutical preparations and biological fluids. Central Eurpean Journal of Chemistry 6: 222-228.
- Al-GhannamSM, Al-OlyanAM (2009) Spectrophotometric determination of nicardipine and Iseradepine in pharmaceutical formulations. Chem Indus and ChemEngin Quart 15: 69-76.
- Diez-Caballero RJ, de la Torre LL, Valentin JF, Garcia AA (1989) Adsorptive stripping voltammetry for the determination of nifedipine in human serum. Talanta 36: 501-504.
- Ghoneim MM, Tawfik A, Khashaba PY (2003) Cathodic adsorptive stripping square-wave voltammetric determination of nifedipine drug in bulk, pharmaceutical formulation and human serum. Anal-Bioanal-Chem 375: 369-375.
- Ozaltin N, Yardimci C, Suslu I (2002) Determination of nifedipine in human plasma by square wave adsorptive stripping voltammetry. J Pharm Biomed Anal 30: 573-582.
- Vertzoni MV, Reppas C, Archontaki HA (2006) Sensitive and simple liquid chromatographic method with ultraviolet detection for the determination of nifedipine in canine plasma. AnalyticaChimicaActa573-574: 298-304.
- Wang XD, Li JL, Lu Y, Chen X, Huang M, et al.(2007) Rapid and simultaneous determination of nifedipine and dehydronifedipine in human plasma by liquid chromatography-tandem mass spectrometry: Application to a clinical herb-drug interaction study. J Chromatogr B AnalytTechnol Biomed Life Sci852: 534-544.
- Abou-Auda HS, Najjar TA, Al-Khamis KI, Al-Hadiya BM, Ghilzai NM, et al. (2000) Liquid chromatographic assay of nifedipine in human plasma and its application to pharmacokinetic studies. J Pharm Biomed Anal 22: 241-249.
- Rosseel MT, Bogaert MG (1983) Determination of nifedipine in human plasma by capillary gas chromatography with nitrogen detection. J Chromatogr279: 675-680.
- Martens J, Banditt P, Meyer FP (1994) Determination of nifedipine in human serum by gas chromatography-mass spectrometry: validation of the method and its use in bioavailability studies. J Chromatogr B Biomed Appl660: 297-302.
- Wu AT, Massey IJ,Kushinsky S (1987) Capillary column gas chromatographic method using electron capture detection for the simultaneous determination of nicardipine and its pyridine metabolite II in plasma. Journal of Chromatography B: Biomedical Sciences and Application 59 :65-73.
- Christian GD (2004) Analytical Chemistry, Spectrochemical analysis. 6th edn. John willy and Sons Inc.
- Katori N, Aoyagi N, Kojima S (2001) The study of the applicability of content uniformity and weight variation test--the state of commercial tablets and capsules in Japan. Chem Pharm Bull (Tokyo) 49: 1412-1419.
- Shikifumi K, Ikuo J, Hideo O, Atsusho M, Ichiro M (1979) A study on the weight variation test of tablets. YakugakuZasshi99:1168-1175.
- Yamamoto K, Suzuki N, Wada T, Okada T, Yoshida H, et al. (2008) Human HRD1 promoter carries a functional unfolded protein response element to which XBP1 but notATF6 directly binds. J Biochem144: 477-486.
- Ali SL (2000) Analytical Profiles of Drug Substances, Excipients and Related Methodologies “For nifedipine”. Volume 8.
- Job P (1936) Analytical Chemistry, advanced physicochemical experiments. 2nd edn. Volume 16.Oliner and Boyd, Edinburgh, UK.
- Adegoke OA, Nwoke CE (2008) Spectrophotometric Determination of Hydralazine Using p-Dimethylaminobenzaldehyde. J Iran ChemSoc5: 316-323.
- Huang H, Li H (1990) Ultra-Violet spectrophotometric determination of the content of nicardipine preparations. YaowuFenxiZazhi 10: 359-360.
Relevant Topics
Recommended Journals
Article Tools
Article Usage
- Total views: 17531
- [From(publication date):
October-2015 - Apr 04, 2025] - Breakdown by view type
- HTML page views : 12755
- PDF downloads : 4776
