Spectrophotometric Determination of Mometasone Furoate and Tolnaftate via Ion-Pair Complex Formation Using EBT, MO, and CRS Either in Authentic or Pharmaceutical Dosage Forms
Received: 18-May-2020 / Accepted Date: 20-Aug-2020 / Published Date: 27-Aug-2020 DOI: 10.4172/2167-065X.1000203
Abstract
Where simple, accurate, precise and rapid spectrophotometric method was developed for the assessment of mometasone furoate (MF) and tolnaftate (TF) in pure form and pharmaceutical preparations. These methods depend on the interaction between cited drugs with eriochrome black T (EBT), methyl orange (MO) and Chrome azurol S (CRS) in acidic buffers forming ion-pair complexes, after extracting in chloroform and measured quantitatively with maximum absorption at 510, 440 and 530 nm for MF with EBT, MO and, CRS, respectively, and at 550, 482 and 499 nm for TF with EBT, MO and, CRS, respectively. The extracts are colored and stable for 30 minute at room temperature. The linearity ranges of the methods were 3-15 μg/mL for MF with EBT, MO, and CRS and 1-5 μg/mL for TF with EBT, MO, and CRS. The stoichiometry of the complexes was found to be 1:1 in all cases except of (CRS:TF) it was found (1:2). The analytical parameters were evaluated and the obtained results were statistically compared with that of reported methods. Comparisons were starting to show that there is no significant difference regarding both accuracy and precision. The proposed methods can be suggested for routine analysis and quality control where time and cost effectiveness of analytical approaches are critical.
Keywords: Mometasone furoate; Tolnaftate; Eriochrome black T, Methyl orange; Chrome Azurol S; Ion-pair complex
Introduction
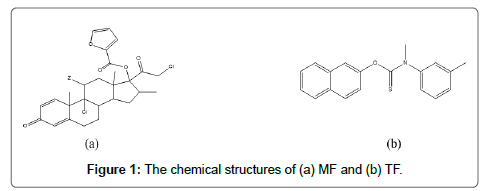
Mometasone furoate (MF) (9,21-Dichloro-11b-hydroxy-16amethyl- 3,20-dioxopregna-1,4-dien-17-yl furan-2- carboxylate [1], (Figure 1) is a glucocorticoid or corticosteroid used topically to reduce inflammation of the skin or in the airways [2]. Tolnaftate (TF) (O-Naphthalen-2-yl methyl (3-methylphenyl) carbamothioate [1], (Figure 1) is a synthetic over-the-counter anti-fungal agent. It is used to treat jock itch, athlete's foot and ringworm [2].
A review of the literature showed that methods reported for the determination of (MF) alone or in combinations were spectrophotometry [3-5], HPLC [6-17], HPTLC [9,18-20], electrochemical method [21], and LC [22]. Several methods were reported for (TF) alone or in combinations as spectrophotometry [23], spectrofluorometry [24], HPLC [25] and HPTLC [26] spectrophotometry [27-29], spectrofluorometry [24,29-31], HPLC [32], and HPTLC [33].
Eriochrome black T is (sodium;3-hydroxy-4-{(1- hydroxynaphthalen-2-yl) diazenyl}-7-nitronaphthalene-1-sulfonate), (C20H12N3NaO7S) with MW of 461.38. It is a complexometric indicator. Eriochrome black T is also known as Mordant Black 11. It is used to detect the presence of rare earth metals [34]. Several drugs are determined spectrophotometrically through ion-pair complex formation with EBT as, (sulpiride, olanzapine, clozapine, and aripiprazole) [35], (bisoprolol fumarate, propranolol hydrochloride, and timolol maleate) [36], (gatifloxacin and cefotaxime sodium) [37], (haloperidol) [38], (diphenhydramine hydrochloride) [39], and (nifedipine) [40]. Methyl orange is (sodium; 4{4-(dimethyl amino) phenyl diazenyl} benzenesulf--onate), (C14H14N3NaO3S) with MW of 327.33 is a pH indicator. Methyl orange is also known as Acid Orange 52, Helianthin, and Orange III with Color Index 13025. Several drugs can be analyzed by forming ion-pair complex with MO as, (bisoprolol fumarate, propranolol hydrochloride, and timolol maleate) [36], (tropicamide) [41], (diphenhydramine hydrochloride) [39], (benzydamine HCl, levamisole HCl, and mebeverine HCl) [42], (terbinafine) [43], (oxiconazole) [44], and (enrofloxacin and pefloxacin) [45]. Chrome azurol S is (trisodium;5-{(E)-(3-carboxy-5-methyl-4- oxocyclohexa-2,5-dien-1-ylidene) -(2,6-dichloro-3-sulfonatophenyl) methyl}-3-methyl-2oxidobe--nzoate), (C23H11Cl2Na3O9S) with M.W. of 605.29 which is belongs to sulfonephthalein compounds. Chrome azurol S is also known as Color Index 43825. It is used for determination of cationic surfactant, copper, aluminum, beryllium, uranium, and other metals [46]. Various drugs can be also determined thought ion-pair formation with CRS as, (pipazethate HCl) [47], (iron and aluminium) [48], (vanadium (IV)) [49], (imipramine) [50], and (fluoxetine and fluvoxamine) [51].
The proposed methods are depending on the formation of ionpair complexes between the cited drugs, namely, MF and TF with eriochrome black T (EBT), methyl orange (MO) and Chrome azurol S (CRS) reagents in acidic buffers. Various factors altering these complexes formation are studied then Beer’s law is performed. These methods are rapid, simple and inexpensive matching other approaches.
Experimental
Apparatus and software
• All the absorbance spectral measurements were made using Ultraviolet/Visible spectrophotometer (Spectronic Genesys® with WINPEC® application software) with1 cm quartz cell, Spectronic, (USA). HANNA model HI 98127-pH meter used for pH measurements.
• The centrifugation system: Laboratory Centrifuge, Sigma 2-16KL, Sigma 2-16KHL, with order number 10350, 10353.
• Sonicated water bath BranSonic 220, (Zurich, Switzerland).
• All calculations and statistics were carried out on computer using MATLAB® program version 7.9.
Chemicals and reagents
Standard mometasone furoate (MF) and tolnaftate (TF) were kindly donated by SIGMA Pharma Co., Quesna, Egypt. The purity was found to be 100.08% ± 0.39 [4] and 99.30% ± 0.55 [52] according to reported methods, respectively. The studied market dosage forms, Elcon® cream (SEDICO Co., 6 October city, Egypt), were assigned to contain 1 mg/g MF (batch No.1016335) and Tinea cure® cream (KAHIRA PHARM. & CHEM. IND. CO. – EGYPT), were assigned to contain 1% TF (batch No.1670292). All of the chemicals used were of analytical or pharmaceutical grade and used without further purification as methanol and chloroform (Analar grade).
Standard solutions
Stock solutions: Pure MF and TF were prepared separately by dissolving 6 mg and 2 mg of drugs in a 100 mL volumetric flask, respectively. Working solutions were freshly prepared by appropriate dilution with methanol to obtain working standard solutions covering the range of 1-15 μg/mL for MF and TF.
Reagents: A6 × 10–4 M EBT (sodium;3-hydroxy-4-[(1- hydroxynaphthalen-2-yl) diazenyl]-7-nitronaphthalene-1-sulfonate) and 6 × 10⁻⁴ M MO (sodium;4-[[4-(dimethyl amino) phenyl]diazenyl] benzenesulfonate) and 2 × 10⁻³ M CRS (trisodium;5-[(E)-(3-carboxy- 5-methyl-4-oxocyclohexa-2,5-dien-1-ylidene)-(2,6-dichloro-3- sulfonatophenyl)methyl]-3-methyl-2-oxidobenzoate) stock solutions were prepared by dissolving 27.68 mg, 19.64 mg and 121 mg of EBT, MO, and CRS, respectively in a 100 mL volumetric flask with methanol. Series of buffer solutions: Of acetate buffer (pH 3.5 and 5.5) and citrate buffer (pH 4.5) were prepared by standard methods.
General recommended procedure
Procedure for calibration curve: Aliquot volumes (3-15 μg/mL) of MF and (1-5 μg/mL) of TF (as shown in Table 1) were separately transferred into a series of separating funnels, and then 1 mL of 6 × 10⁻⁴ M of EBT, 0.3 mL of 6 × 10⁻⁴ M of MO, and 0.1 mL of 2 × 10⁻³ M of CRS was added, and 1.0 mL of acetate buffer of pH 3.5 or 5.5 in the case of EBT and MO, respectively, and 1.0 mL of citrate buffer of pH 4.5 in the case of CRS, then the solutions were diluted to 10 mL with water. The ion-pairs complexes were extracted with 10 mL of chloroform by shaking for 2.0 min and then, the combined chloroform extracts were dried over anhydrous sodium sulphate. The absorbance of colored ion-pair complexes was measured within 5.0 min of extraction against the blank prepared in the same manner without addition of drugs.
| Parameters | MF | TF | ||||
|---|---|---|---|---|---|---|
| EBT | MO | CRS | EBT | MO | CRS | |
| Concentration range (μg mL-1) | 3-15 | 3-15 | 3-15 | 1-5 | 1-5 | 1-5 |
| Molar absorptivity, (L/mol.cm) | 5.49 × 10⁴ | 5.79 × 10⁴ | 2.17 × 10⁴ | 7.44 × 10⁴ | 6.82 × 10⁴ | 5.44 × 10⁴ |
| Correlation coefficient (r) | 0.9997 | 0.9998 | 0.9994 | 0.9998 | 0.9997 | 0.9999 |
| Intercept (a) | -0.0932 | 0.2365 | 0.0243 | 0.1092 | 0.1373 | 0.0843 |
| Slope (b) | 0.1105 | 0.0334 | 0.0333 | 0.1316 | 0.0827 | 0.0929 |
| S.D. of the residuals Sy/x | 0.0145 | 0.0036 | 0.0063 | 0.0039 | 0.0037 | 0.0014 |
| S.D. of slope Sb | 0.0015 | 0.0004 | 0.0007 | 0.0012 | 0.0012 | 0.0004 |
| S.D. of intercept Sa | 0.0152 | 0.0038 | 0.0066 | 0.0041 | 0.0038 | 0.0015 |
| LOD, μg/mL | 0.4539 | 0.3754 | 0.6541 | 0.1028 | 0.1516 | 0.0533 |
| LOQ, μg/mL | 1.3756 | 1.1377 | 1.9820 | 0.3116 | 0.4595 | 0.1615 |
Table 1: Analytical characteristics of the proposed methods using EBT, MO, and CRS reagents with MF and TF.
Procedure for cream- Elcon® cream: A two-gram portion of the cream was transferred to a 50 mL volumetric flask, taking care to avoid sticking cream to the walls of the volumetric flask. A 35 mL of methanol was added to the flask, and the cream was allowed to melt by warming at 60°C in a water bath with constant shaking. The solution was allowed to cool to room temperature. The volume was made up to the mark with methanol and mixed. The solution was centrifuged at 10000 rpm for 10 min, and the clear supernatant solution was obtained. A portion of the supernatant was diluted quantitatively with methanol to obtain a final concentration of 20 μg/mL.
TINEA CURE® cream: A one-gram portion of the cream was transferred to a 50 mL volumetric flask, then the procedure was completed as mentioned in section 4.4.2.
Results and Discussions
Absorption spectra
The absorption spectra of the ion-pair complexes were measured in the range 400-610 nm against blank (chloroform, dyes and buffers). MF was found to react with EBT, MO and CRS dye anions in acidic buffer donating an intense color with a maximum absorption at 510, 440, and 530 nm for EBT, MO and CRS, respectively, Figure 2. So, all the measurements are achieved at 510, 440, and 530 nm (EBT, MO, and CRS) for MF and at 550, 482, and 499 nm (EBT, MO, and CRS) for TF against blank. The influence of the dye concentrations, stability of formed complexes, extractive organic solvents, effect of pH, and effect of interferences were checked via monitoring experiment parameters. The optimum conditions were assured by changing one variable and watching its influence on the absorbance of the colored complex.
Effect of dyes volume
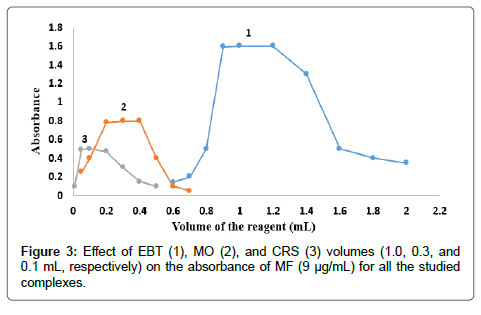
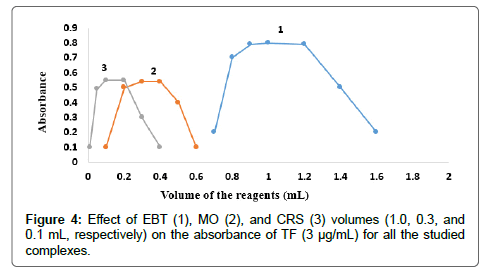
The effect of dyes volume on the intensity of the color developed and the absorbance at the selected wavelength using constant drugs concentrations was checked using different volumes of EBT solution 0.03 % (w/v), MO solution 0.02 % (w/v) and CRS solution 0.12 % (w/v). The results indicated the maximum absorbance for EBT, MO, and CRS; for both MF and TF as shown in Figures 3 and 4. Thus 1, 0.3 and 0.1 mL of EBT, MO and CRS were used, respectively, for both MF and TF.
Stability of the Ion-pair complexes
The stability of the complex after extraction with the chloroform was studied. It was found that the absorbance remained constant up to 30 min.
Choice of organic solvent
Various organic solvents as chloroform, dichloromethane, and ether were checked as extractive solvents for the proposed methods. Chloroform was favored to other solvents because it obtained highest absorbance. A one extraction was satisfactory to have a quantitative recovery of the complexes. Shaking time of 0.5-5 min afforded constant absorbance and the 2.0 min was the optimum shaking time.
Effect of pH
The effect of pH on the formed complexes of MF and TF with the three dyes has been checked using various types of buffers of various media. The best buffer related with the maximum color intensity and maximum absorbance is sodium acetate buffer of pH 3.5 in case of the EBT and pH 5.5 in case of MO and sodium citrate buffer of pH 4.5 in case of CRS. The volume of the used buffers was detected by applying the same procedure and changing the volume orderly (0.5-3.0 mL). The highest absorbance was achieved by using 1.0 mL of buffer solutions.
Composition of the Ion-pair complexes
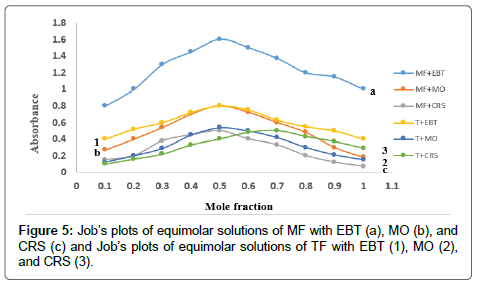
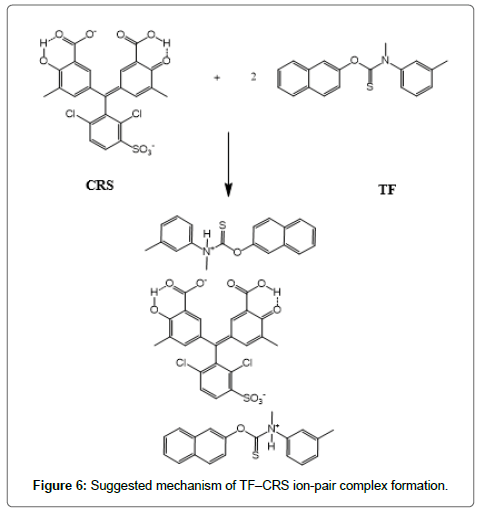
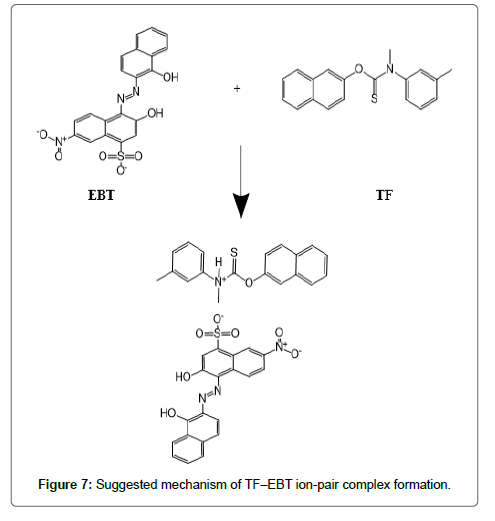
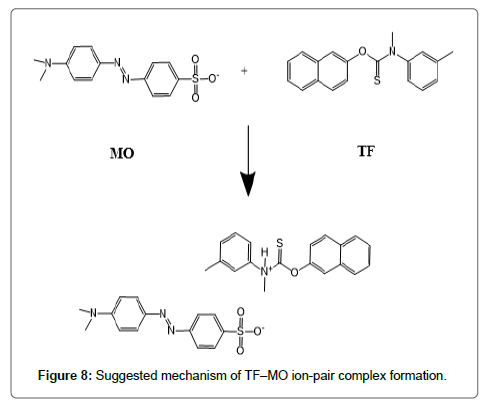
The formed ion-pair complexes between MF and TF and the three dyes; (EBT, MO, and CRS) were determined by Job’s method [53]. A series of solutions were arranged with total volume of the drugs and reagent (5.0 mL) and complete the procedures as described under general procedures. Plot the absorbance of each reading against mole fraction of drug. The plot attained to the maximum value at a mole fraction of 0.5 in case of MF and the three reagents, which determined that a 1:1 (drug: dye) ion-pair are formed through the electrostatic attraction between dyes anions and positive protons of drugs in all cases, Figure 5. In case of TF with EBT and MO the maximum value was found also at a mole fraction of 0.5 where the ratio is (1:1) except in (TF:CRS) case where the ratio is (2:1), Figure 5. The suggested mechanism for the reaction product of TF-CRS, TF-EBT and TF-MO ion-pair complex formation for example, is given in Figures 6-8.
Validation of the Proposed Methods
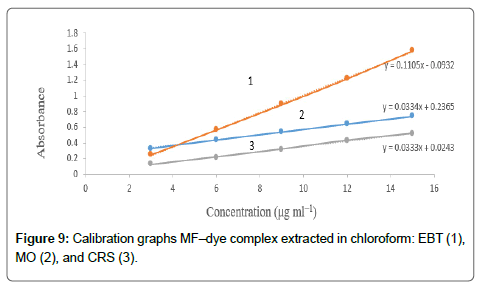
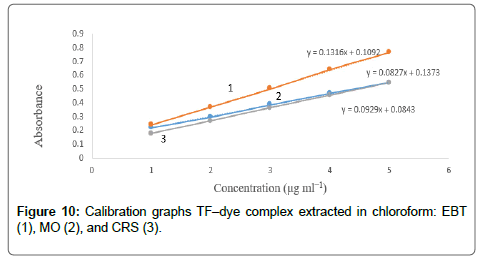
The calibration graphs were constructed for the considered drugs Figures 9 and 10, with the optimum conditions detailed before. The concentration range, molar absorptivity, correlation coefficient, the limit of detection (LOD) and limit of quantitation (LOQ) for each drug are listed in Table 1. A linear relationship was constructed between the absorbance and the concentration of the investigated drugs within the range 1-15 μg/mL.
Regression analysis of Beer’s law plotted at λmax reveals a good correlation (r2=0.9988-0.9999). The graphs displayed a negligible intercept, which was determined from the regression equations, A=a+bC (where A is the absorbance of 1.0 cm layer, b is the slope, a is the intercept and C is the concentration of the studied solution in μg/ mL [54].
The high molar absorptivities of the formed complexes indicated high sensitivity of the methods (2.17 × 10⁴ 7.44 × 10⁴). The TF–EBT method was found to be the most sensitive of all methods with high molar absorptivity value.
Assay precision and accuracy
The inter-day and intra-day precision (intermediate precision) of the proposed method were determined by the analysis of different concentrations of studied drugs, within the linearity range, by three replicate analyses on a single day and three consecutive days, for the intra-day and inter-day precisions, respectively. The results expressed as percentage recoveries and RSD is illustrated in Table 2.
| MF | TF | |||||||||||||
|---|---|---|---|---|---|---|---|---|---|---|---|---|---|---|
| Dye | Taken (μg mL-1) | Intra-day | Inter-day | Taken (μg mL-1) | Intra-day | Inter-day | ||||||||
| Found (μg mL-1) | Recovery % | RSD | Found (μg mL-1) | Recovery % | RSD | Found (μg mL-1) | Recovery % | RSD | Found (μg mL-1) | Recovery % | RSD | |||
| EBT | 6 | 5.97 | 99.50 | 1.52 | 6.00 | 100.00 | 1.51 | 2 | 1.98 | 99.00 | 0.66 | 2.02 | 101.00 | 1.04 |
| 9 | 8.86 | 98.41 | 0.80 | 8.90 | 98.89 | 0.98 | 3 | 2.99 | 99.53 | 0.71 | 3.02 | 100.67 | 0.84 | |
| 12 | 11.70 | 97.50 | 0.90 | 4 | 4.11 | 102.75 | 1.02 | |||||||
| MO | 6 | 6.04 | 100.59 | 1.04 | 5.82 | 97.05 | 1.08 | 2 | 1.96 | 97.99 | 0.36 | 1.97 | 98.50 | 0.52 |
| 9 | 9.09 | 101.00 | 0.58 | 8.85 | 98.33 | 0.80 | 3 | 3.03 | 101.00 | 0.78 | 3.06 | 102.00 | 0.77 | |
| 12 | 12.08 | 100.67 | 0.97 | 4 | 4.08 | 102.00 | 0.53 | |||||||
| CRS | 6 | 5.94 | 99.00 | 0.76 | 5.88 | 97.99 | 0.97 | 2 | 1.98 | 99.00 | 0.92 | 1.97 | 98.51 | 0.56 |
| 9 | 8.94 | 99.33 | 1.06 | 9.00 | 100.05 | 0.95 | 3 | 3.05 | 101.67 | 0.88 | 2.99 | 99.67 | 0.75 | |
| 12 | 12.27 | 102.25 | 1.09 | 6.00 | 100.00 | 1.51 | 4 | 4.08 | 102.11 | 1.49 | ||||
Table 2: Evaluation of intra-day and inter-day precision for the determination of MF and TF by the proposed methods using EBT, MO, and CRS reagents.
To study the accuracy of the proposed method, repeated analysis (three times) of different concentrations of MF and TF with the three reagents within the linearity range were performed.
Selectivity
To confirm the absence of interference of excipients in the analysis of the standard drugs by the proposed methods, standard addition technique was applied. The attained results exhibit the accuracy of the proposed methods for the detection of drugs in creams without any interference of the excipients as shown in Table 3.
| Dye | MF (6 μg mL-1) | TF (2 μg mL-1) | ||||||
|---|---|---|---|---|---|---|---|---|
| Elcon® cream | Tinea cure® cream | |||||||
| Added (μg mL-1) | Found (μg mL-1) | Recovery% ± SD | RSD | Added (μg mL-1) | Found (μg mL-1) | Recovery% ± SD | RSD | |
| EBT | 3 | 2.93 | 97.51 ± 0.94 | 0.96 | 1 | 0.99 | 99.00 ± 0.94 | 0.95 |
| 6 | 5.95 | 99.11 ± 1.51 | 1.52 | 2 | 1.98 | 99.00 ± 1.05 | 1.06 | |
| 9 | 9.00 | 99.95 ± 0.87 | 0.87 | 3 | 3.05 | 101.54 ± 0.93 | 0.92 | |
| MO | 3 | 2.93 | 97.54 ± 0.75 | 0.77 | 1 | 0.98 | 97.95 ± 0.75 | 0.77 |
| 6 | 5.99 | 99.91 ± 0.75 | 0.75 | 2 | 1.97 | 98.50 ± 0.69 | 0.70 | |
| 9 | 9.05 | 100.51 ± 0.91 | 0.91 | 3 | 3.05 | 101.54 ± 0.71 | 0.70 | |
| CRS | 3 | 3.00 | 99.85 ± 0.54 | 0.54 | 1 | 1.01 | 100.70 ± 0.91 | 0.90 |
| 6 | 5.88 | 98.00 ± 0.78 | 0.80 | 2 | 1.99 | 99.51 ± 1.01 | 1.01 | |
| 9 | 9.07 | 100.75 ± 0.91 | 0.90 | 3 | 2.99 | 99.76 ± 1.11 | 1.11 | |
Table 3: Application of standard addition technique for the determination of MF and TF in pharmaceutical formulations using EBT, MO, and CRS reagents.
Analysis of pharmaceutical formulations
The dosage forms were analyzed by the proposed and reported methods in three replicate determinations. The results of the proposed methods were compared with well-established reported methods by means of t-test and F-test at 95% confidence level. The results are listed in Table 4. It was found that, there was no significant difference between results obtained by the proposed and reported methods, indicating good accuracy and precision.
| Parameter | Reported method | MF | Reported method | TF | ||||
|---|---|---|---|---|---|---|---|---|
| EBT | MO | CRS | EBT | MO | CRS | |||
| Proposed method | Proposed method | Proposed method | Proposed method | Proposed method | Proposed method | |||
| Mean | 100.08 | 100.32 | 99.59 | 100.01 | 99.30 | 100.05 | 100.12 | 99.96 |
| Standard deviation, ± SD | ± 0.39 | ± 1.39 | ± 1.41 | ± 1.22 | ± 0.55 | ± 0.73 | ± 1.42 | ± 0.34 |
| N | 3 | 5 | 5 | 5 | 3 | 5 | 5 | 5 |
| Variance | 0.15 | 1.93 | 1.99 | 1.49 | 0.30 | 0.53 | 2.02 | 0.12 |
| Student, t (2.365) | 0.36 | 0.73 | 0.12 | 1.65 | 1.16 | 1.87 | ||
| F (19.2) | 12.87 | 13.27 | 9.93 | 1.77 | 6.73 | 2.5 | ||
Table 4: Statistical comparison between the results obtained by the proposed method and the reported methods for the determination of MF and TF in pure powder form.
References
- https://www.worldcat.org/title/british-pharmacopoeia-2013/oclc/809536883
- Goodman LS, Gilman AM, Brunton LL (2008) Goodman & Gilman's manual of pharmacology and therapeutics. New York: McGraw-Hill Medical 9: 1219.
- Merey HA, El-Mosallamy SS, Hassan NY, El-Zeany BA (2016) Spectrophotometric and Chemometric Study for the Simultaneous Determination of Mometasone Furoate and Miconazole Nitrate in the presence of Pharmaceutical Dosage Form Additive. gfv 6: 70-85.
- Patel H, Patel MM (2013) Development and validation of UV spectrophotometric method for simultaneous estimation of terbinafine hydrochloride and mometasone furoate in combined dosage form. Asian J Research Chem 6: 5.
- Ramzia I, Marwa A, Manal A, Enas H (2013) Derivative, derivative of the ratio spectrophotometric and stability-indicating RP-HPLC methods for the determination of mometasonefuroate and miconazole nitrate in cream. J Chem Pharm Res 5: 368.
- Arintowibowo AG, Sumiyani R, Hendrajaya K (2019) Validation of Mometasone furoate and CIP100 Residue Analysis Methods After Cleaning of Production Equipment in the “XYZ†Pharmaceutical Industry. Jurnal Kimia Sains dan Aplikasi 22: 150-156.
- Coelho AS, Arribada RG, Lages E (2019) Cleaning validation for residual estimation of mometasone furoate on stainless steel surface of pharmaceutical manufacturing equipment using a UHPLC-UV method. J Pharma Sci Tech 73.
- El-Bagary RI, Fouad MA, Manal A, Tolba EH (2016) Forced degradation of mometasone furoate and development of two RP-HPLC methods for its determination with formoterol fumarate or salicylic acid. Arabian J Chem 9: 493-505.
- Merey HA, El-Mosallamy SS, Hassan NY, El-Zeany BA (2016) Validated chromatographic methods for the simultaneous determination of Mometasone furoate and Formoterol fumarate dihydrate in a combined dosage form. Bulletin of Faculty of Pharmacy, Cairo University 54: 99-106.
- Modi PB, Shah NJ (2014) DoE Approach: A Stability Indicating RP-HPLC Method for Simultaneous Estimation of Methylparaben, Mometasone furoate and Eberconazole nitrate in Topical Formulations. J Appl Pharm Sci 4: 20-25.
- Roy C, Chakrabarty J (2013) Stability-indicating validated novel RP-HPLC method for simultaneous estimation of methylparaben, ketoconazole, and mometasone furoate in topical pharmaceutical dosage formulation. Analytic Chem 2013: 1-9.
- Roy C, Chakrabarty J (2013) Development and validation of a stability-indicating RP-HPLC method for the simultaneous determination of phenoxyethanol, methylparaben, propylparaben, mometasone furoate, and tazarotene in topical pharmaceutical dosage formulation. Scientia pharmaceutica 81: 951-968.
- Shaikh KA, Patil AT (2013) Stability-indicating HPLC method for the determination of mometasone furoate, oxymetazoline, phenyl ethanol and benzalkonium chloride in nasal spray solution. J Trace Analysis Food Drugs 1: 14-21.
- El-Bagary RI, Elkady EF, Tammam MH, Elmaaty AA (2012) Simultaneous determination of miconazole and hydrocortisone or mometasone using reversed phase liquid chromatography. Eur J Chem 3: 421-425.
- Srinivasarao K, Gorule V, Chvenkata R (2012) Validated method development for estimation of formoterol fumarate and mometasone furoate in metered dose inhalation form by high performance liquid chromatography. Pharmacophore 3: 301-306.
- Shaikh S, Muneera M, Thusleem O, Tahir M, Kondaguli AV (2009) A simple RP-HPLC method for the simultaneous quantitation of chlorocresol, mometasone furoate, and fusidic acid in creams. J chromatographic Sci 47: 178-183.
- Teng XW, Foe K, Brown KF, Cutler DJ, Davies NM (2001) High-performance liquid chromatographic analysis of mometasone furoate and its degradation products: Application to in vitro degradation studies. J Pharma Biomedical Analysis 26: 313-319.
- Vichare V, Choudhari VP, Reddy MV (2019) Study of Intrinsic Stability of Mometasone Furoate in Presence of Salicylic Acid by HPTLC and Characterization, Cytotoxicity Testing of Major Degradation Product of Mometasone Furoate. Current Pharma Analysis 15: 592-603.
- Patel KG, Shah PM, Shah PA, Gandhi TR (2016) Validated high-performance thin-layer chromatographic (HPTLC) method for simultaneous determination of nadifloxacin, mometasone furoate, and miconazole nitrate cream using fractional factorial design. J Food Drug Analysis 24: 610-619.
- Shah KA, Dave JB (2015) Development And Validation of RP-HPLC And Hptlc Methods For Simultaneous Estimation of Mometason Furoate And Miconazole Nitrate In Cream Formulation. World J Pharmacy Pharma Sci 4: 1156-1172.
- Goyal RN, Kaur D, Agrawal B, Yadav SK (2013) Electrochemical investigations of mometasone furoate, a topical corticosteroid, in micellar medium. J Electroanalytical Chem 695: 17-23.
- Wu S, Jia A, Daniels KD, Park M, Snyder SA (2019) Trace analysis of corticosteroids (CSs) in environmental waters by liquid chromatography–tandem mass spectrometry. Talanta 195: 830-840.
- Emam RA, Abdelrahman MM, Abdelaleem EA, Ali NW (2019) Novel spectral manipulations for determinations of Tolnaftate along with related toxic compounds: Drug profiling and a comparative study. Spectrochim Acta A Mol Biomol Spectrosc 223: 117290.
- Alarfaj NA, El-Tohamy MF (2016) Eu (III)-Sensitized Luminescence Probe for Determination of Tolnaftate in Pharmaceuticals and Biological Fluids. J AOAC Int 99: 380-385.
- Abdelaleem EA, Abdelrahman MM, Ali NW, Emam RA (2019) Two validated chromatographic determinations of an antifungal drug, its toxic impurities and degradation product: A comparative study. Biomed Chromatography, p: 4547.
- Abdelaleem EA, Abdelrahman MM, Ali NW, Emam RA (2019) Two Validated Chromatographic Determinations of an Antiâ€fungal Drug, its Toxic Impurities and Degradation Product: A comparative Study. Biomed Chromatography p. e4547.
- Bhoyar N, Giri TK, Alexander A, Tripathi DK (2012) Development of UV Spectrophotometric Method for Qualitative and Quantitative Estimation of Tolnaftate in Different Formulations. Res J Pharmacy Tech 5: 207.
- Tahssen T, Ahmed NR (2009) Indirect Spectrophotometric Determination of Tolnaftate in Pharmaceutical Preparations. J Edu Sci 22: 9-18.
- Khashaba P, El-Shabouri S, Emara K, Mohamed A (2000) Analysis of some antifungal drugs by spectrophotometric and spectrofluorimetric methods in different pharmaceutical dosage forms. J Pharma Biomed Analysis 22: 363-376.
- Wagner BD (2007) Recent applications of host-guest inclusion in fluorescence-based trace analysis. Current Anal Chem 3: 183-195.
- Patil ST, Bhoir IC, Bhagwat A, Sundaresan M (2000) Assay of tolnaftate and related impurities by isocratic supercritical fluid chromatography. Fresenius' J Anal Chem 367: 91-93.
- Saha CN, Bhattacharya S (2009) A validated simultaneous RP-HPLC method for determination of betamethasone dipropionate and tolnaftate in combined semisolid formulation. Int J Chem Tech Res 1: 671-674.
- Meshram D, Bagade S, Tajne M (2018) A simple HPTLC determination of tolnaftate in topical solution. J Planar Chromatography-Modern TLC 21: 283-287.
- Dubenskaya L, Levitskaya G (1999) Use of Eriochrome Black T for the polarographic determination of rare earth metals. Zhurnal Analiticheskoj Khimii 54: 742-744.
- El-Didamony AM, Hafeez SM, Ali I (2015) Extractive spectrophotometric method for the determination of some antipsychotic drugs using eriochrome black T. J Appl Pharma Sci 5: 26-33.
- El-Didamony A, Shehata A (2014) Spectrophotometric determination of β-adrenergic antagonists drugs via ion-pair complex formation using MO and EBT. Optics and Spectroscopy 117: 492-499.
- Sayed RA, Hassan WS, El-Mammli MY, Shalaby AA (2012) A new extractive spectrophotometric method for the determination of gatifloxacin and cefotaxime sodium in pure and pharmaceutical dosage forms. Oriental J Chem 28: 639.
- Rahman N, Khatoon A, Rahman H (2012) Studies on the development of spectrophotometric method for the determination of haloperidol in pharmaceutical preparations. QuÃmica Nova 35: 392-397.
- El-Didamony AM, Moustafa MA (2010) Spectrophotometric determination of diphenhydramine hydrochloride in pharmaceutical preparations and biological fluids via ion-pair formation. Arab J Chem 3: 265-270.
- Rahman N, Khan NA, Azmi SNH (2004) Extractive spectrophotometric methods for the determination of nifedipine in pharmaceutical formulations using bromocresol green, bromophenol blue, bromothymol blue and eriochrome black T. Il Farmaco 59: 47-54.
- Shoaibi Z, Gouda A (2012) Extractive spectrophotometric method for the determination of tropicamide. J Young Pharmacist 4: 42-48.
- El-Didamony AM (2008) Spectrophotometric determination of benzydamine HCl, levamisole HCl and mebeverine HCl through ion-pair complex formation with methyl orange. Spectrochim Acta A Mol Biomol Spectrosc 69: 770-775.
- Florea M, Monciu CM (2008) Spectrophotometric determination of terbinafine through ion-pair complex formation with methyl orange. Farmacia 56: 393-401.
- Milano J, Cardoso SG (2005) Spectrophotometric determination of oxiconazole in topical lotion using methyl orange. J Pharma Biomed Analysis 37: 639-642.
- Mostafa S, El-Sadek M, Alla EA (2002) Spectrophotometric determination of enrofloxacin and pefloxacin through ion-pair complex formation. J Pharma Biomed Analysis 28: 173-180.
- Andre L, Angel M, Miguel D (2007) A multicommuted stop-flow system employing LEDs-based photometer for the sequential determination of anionic and cationic surfactants in water. Anal Chim Acta 600: 58-65.
- Hosny MM (2013) Extractive colourimetric determination of pipazethate HCl by ion-pair complex formation in pure form, dosage form, urine and in presence of its degradation products. Int J Instrumentation Sci 2: 8-14.
- Ni Y, Huang C, Kokot S (2007) Simultaneous determination of iron and aluminium by differential kinetic spectrophotometric method and chemometrics. Anal Chim Acta 599: 209-218.
- Starczewska B (2002) Spectrophotometric determination of vanadium (IV) by ternary complexes of chrome azurol S with imipramine and chlorprothixene. J Trace Microprobe Tech 20: 377-384.
- Starczewska B, Hałaburda P, Kojlo A (2002) Studies and analytical application of reaction of imipramine with chrome azurol S. J Pharma Biomed Analysis 30: 553-560.
- Starczewska B, Mielech K (2000) Application of chrome azurol S for the extractive spectrophotometric determination of fluoxetine and fluvoxamine. J Pharma Biomed Analysis 23: 243-247.
- Sastry C, Sastry B, Rao JV, Krishna RR (1993) Spectrophotometric methods for the determination of tolnaftate. Talanta 40: 571-576.
- https://pubs.rsc.org/en/content/articlelanding/1988/an/an9881301351/unauth#!divAbstract
Citation: Abdelaziz A (2020) Spectrophotometric Determination of Mometasone Furoate and Tolnaftate via Ion-Pair Complex Formation Using EBT, MO, and CRS Either in Authentic or Pharmaceutical Dosage Forms. Clin Pharmacol Biopharm 9: 203. DOI: 10.4172/2167-065X.1000203
Copyright: © 2020 Abdelaziz T. This is an open-access article distributed under the terms of the Creative Commons Attribution License, which permits unrestricted use, distribution, and reproduction in any medium, provided the original author and source are credited.
Select your language of interest to view the total content in your interested language
Share This Article
Recommended Journals
Open Access Journals
Article Tools
Article Usage
- Total views: 3830
- [From(publication date): 0-2020 - Nov 26, 2025]
- Breakdown by view type
- HTML page views: 2933
- PDF downloads: 897
