Research Article Open Access
Speciation of Intracellular Zn, Fe and Cu within both iPS Cells and Differentiated Cells Using HPLC Coupled to ICP-MS
Akihiro Arakawa1, Nobuaki Shiraki2, Tomonori Tsuyama3, Shoen Kume2, Daigo Iwahata1* and Naoyuki Yamada1
1Institute for Innovation, Ajinomoto Co. Inc., Kanagawa, Japan
2Department of Biological Information, Graduate School of Bioscience and Biotechnology, Tokyo Institute of Technology, Kanagawa, Japan
3Divisions of Stem Cell Biology, Institute of Molecular Embryology and Genetics, Kumamoto University, Kumamoto, Japan
- *Corresponding Author:
- Daigo Iwahata
Institute for Innovation
Ajinomoto Co. Inc., Kanagawa, Japan
Tel: +81442444428
Fax: +81442117609
E-mail: daigo_iwahata@ajinomoto.com
Received Date: December 17, 2015; Accepted Date: December 28, 2015; Published Date: January 04, 2016
Citation: Arakawa A, Shiraki N, Tsuyama T, Kume S, Iwahata D, et al. (2016) Speciation of Intracellular Zn, Fe and Cu within both iPS Cells and Differentiated Cells Using HPLC Coupled to ICP-MS. J Anal Bioanal Tech 7:295. doi:10.4172/2155-9872.1000295
Copyright: © 2016 Arakawa A, et al. This is an open-access article distributed under the terms of the Creative Commons Attribution License, which permits unrestricted use, distribution, and reproduction in any medium, provided the original author and source are credited.
Visit for more related articles at Journal of Analytical & Bioanalytical Techniques
Abstract
Zinc, iron and copper are essential mineral nutrients for the human body to function. It is also known that there are biological processes which relate to metals in the body including cells. Therefore, understanding about intracellular metals is important for the regeneration medicine. Intracellular metals were thought to be able to be divided into two forms by function: i) protein binding metals and ii) labile metals. However, it is difficult to quantify the concentration in both intracellular metal forms. In this study, the analytical method including the pre-treatment and HPLC coupled to ICP-MS (HPLC-ICP-MS) techniques was developed. Our method is able to fractionate two forms of intracellular metals and quantify each concentration, simultaneously. Finally, the presented method was applied to analysis of several cell states. As a result, dynamic changes of intracellular metal concentration were demonstrated during cell differentiation from iPS cells to pancreatic β cells.
Keywords
Intracellular metal; HPLC-ICP-MS; iPS cell; Speciation; Zinc; Cell differentiation
Introduction
Zinc, iron and copper which are known as essential nutrient metals for the human body are widely found in each tissue and cell. Within the cell, they function as cofactors for some biological processes. In the case of zinc, there are over 300 related enzymes, such as DNA polymerase and hydrolase [1]. The intracellular “total” zinc concentration is tightly regulated at a few hundred micro-molar in human cell [2]. Some reports have shown the labile zinc (e.g., Zn ion) having a role as a signal transferring molecule [3,4] controlled at the pico-molar range in the cell [5]. Thus, functions of intracellular metal can be divided into two forms: i) protein binding metal-contributes to maintaining the structure and activity of the enzymes, ii) labile metal-non-binding to proteins, having a function as a signal transferring molecule [6-8]. For regulating the balance of both intracellular metal forms, metallothionein-that is one of the metalloprotein-is suggested to play a key role [2,8-10]. Intracellular zinc concentration is controlled by several transporters including divalent cation transporter (DCT [11]) and zinc transporters (SLC30A family, SLC39A family) residing at the cell membrane. Moreover, it has been suggested that zinc and transporters are related to specific diseases [12,13]. On the other hand, little is known about the details of the function of iron and copper in biological processes compared with zinc. However, a lack of iron and copper in the body will cause symptoms of deficiency is already revealed [14,15]. Recently, there has been researches using cells, including embryonic stem (ES) cells and induced pluripotent stem (iPS) cells, for pharmaceutical and regenerative medical applications. Several metals are also considered essential components in media as well as the human body [16,17]. Eagle’s minimal essential medium (EMEM) is one of the most traditional and widely used synthetic medium containing 5 to 10% serum [18]. Today, there are wide variety media that are modified versions of the traditional medium; which are provided metals from raw materials such as bovine serum [19]. Typical prerequisites for these purposes are “Serum free” and “Chemically defined” medium to prevent infection risk by external factors such as mycoplasma, viruses [20] and to stabilize medium performance (i.e., to minimalize the difference of variation from lot-to-lot). These are particularly imperative for cell therapy using tissues produced by culturing cells. Generally, such media replace the metals-provided from raw materials-with inorganic metals (e.g., nitrate, sulphate) [19,21]. However, there is a report that LC50 of zinc toxicity with a medium containing 1% serum is lower than a medium containing 10% serum [22]. We thought that it relates with forming a complex of zinc-serum protein in either extracellular or intracellular. Thus, we also thought that it is essential to understand about these forms on media development. There are many reports that the intracellular “total” zinc concentration varies with the several tissues [23-25]. In addition, the intracellular metal relates cell proliferation and differentiation [8,10,23]. However, it has not been quantified the concentration in the both intracellular metal forms during the process of cell differentiation. The reason is because adequate method to be able to quantify both forms of intracellular metal is nothing. It is meaningful to reveal dynamic changes of intracellular metal concentration between both forms during cell differentiation.
However, there are challenges to analyze these. Generally, there are already established, widely used methods to quantify intracellular proteins, such as western blotting, and ELISA. But, these methods are not able to acquire information about metal concentration. Moreover, these methods require a pre-treatment procedure using denaturants, such as surfactants and urea. As a result, protein binding metals may be dissociated from binding proteins. When quantifying intracellular metals, it is necessary to use an analyte under denaturant conditions. In addition, there is a need to fractionate both forms of intracellular metals, because each has different functions in the cell, as previously mentioned. An inductively coupled plasma -atomic emission spectrometry (ICP-AES) and -mass spectrometry (ICP-MS) are used to quantify intracellular “total” metal concentration [22,26]. ICP-MS is able to detect ultra-trace amount of metals (below parts per trillion) having a wide dynamic range (no less than five orders). However, it is impossible to fractionate both metal forms when used as an ICP instrument only. Spectrophotometry using fluorescent probes is used for the imaging of intracellular metal [22,27]. But, it is insufficient to analyze dynamic changes of both intracellular metal forms. It is not able to detect the only free metal ion. The methodology is dependent on the stability constant between probes and metal spices. Thus, it is almost contained the weakly-bound metal with protein. In this study, we tried to develop the analytical method that is able to fractionate and quantify two forms of metals: i) protein binding metals, and ii) labile metals, focusing on HPLC-ICP-MS being a suitable for this purpose. HPLC-ICP-MS is a hyphenated technique connecting high performance liquid chromatography (HPLC) with ICPMS. We thought that using a size exclusion chromatography on HPLC was able to fractionate both forms of metal. The following experimental procedures were attempted. First, an appropriate column was selected that was able to fractionate both forms of metal. Thereafter the analytical performance was estimated for both forms of the intracellular metal. Finally, the our method was extended to cell extracts in different states including iPS cells and differentiated cells for the quantification of the both intracellular metal forms during cell differentiation.
Experimental
Chemicals and standards
Analytical-reagent grade chemicals were used without further purification. Purified water (18.2 MΩ) from a Milli-Q water purification system (Millipore, Billerica, MA, USA) was used throughout the experiments. Ammonium acetate was purchased from Wako Pure Chemical Industries, Ltd. (Osaka, Japan). Tris (hydroxymethyl) aminomethane (Tris) was purchased from MP Biomedicals, LLC (Santa Ana, CA, USA). Hydrochloric acid (ultrapure grade) and nitric acid (ultrapure grade) were purchased from Kanto Chemical Co., Inc. (Tokyo, Japan). Metallothionein (MT) and holo-transferrin (Tf) were purchased from Sigma-Aldrich Co., LLC. (St. Louis, MO, USA). EDTAZn( II), EDTA-Fe(III) and EDTA-Cu(II) were purchased from Dojindo Laboratories (Kumamoto, Japan). Dulbecco’s phosphate buffered (no trace calcium and magnesium) and TrypLE™ Select were purchased from Thermo Fisher Scientific Inc. (Waltham, MA, USA). Otsuka normal saline (saline) was purchased from Otsuka Pharmaceutical Factory (Tokushima, Japan).
Instruments
High performance liquid chromatography (HPLC): HPLC experiments were performed using a bio compatible (stainless steel-free to prevent a contamination and a sample adsorption) high performance liquid chromatograph (Ultimate3000, Thermo Fisher Scientific Inc.) equipped with a diode array detector. Separation columns were performed on Superdex peptide PC 3.2/300 (13 μm, 3.2 mm i.d. × 300 mm; exclusion limit is 2 ×10⁴ Da.), Superdex 75 PC 3.2/300 (13 μm, 3.2 mm i.d. × 300 mm; exclusion limit at 1 × 10⁵ Da.), Superdex 200 (13 μm, 3.2 mm i.d. × 300 mm; exclusion limit at 1.3 × 10⁶ Da.) and purchased from GE healthcare (Buckinghamshire, UK). The mobile phase was 10 mM Tris-HCl buffer solution (pH 7.0) containing 200 mM ammonium acetate. The flow rate of the mobile phase was set at 0.1 mL min-1. The column temperature was maintained at 25°C. The sample tubes were maintained at 4°C. The injection volume was 10 μL aliquots of either a sample solution or a standard solution. The UV detector wavelength was set at 280 nm. Column performance on the sample elution was estimated using molecular weight standards; Mw marker (Oriental Yeast Co. Ltd., Tokyo, Japan) and tyrosine (Mw=181). Mw marker was composed of five components: glutamate dehydrogenase (Mw=290 kDa), lactate dehydrogenase (Mw=142 kDa), enolase (Mw=67 kDa), myokinase (Mw=32 kDa) and cytochrome C (Mw=12.4 kDa).
Inductively coupled plasma mass spectrometry (ICP-MS): ICP-MS experiment was carried out using an ICP-MS 7700x (Agilent Technologies, Inc., Santa Clara, CA, USA). The plasma gas flow, cool gas flow and the carrier gas flow were set at 15.0 L min-1, 1.0 L min-1, 0.9 L min-1, respectively. The collision gas (He) flow was 4.3 L min-1. The radio frequency (RF) power was maintained at 1590 W. ICP-MS parameters were optimized for each experiment to achieve the best signal to noise ratio, using standard solutions containing 10 ppb each of Li (m/z 7), Y (m/z 89) and Tl (m/z 205). Detection of both standards and samples were performed with Zn (m/z 64), Fe (m/z 54) and Cu (m/z 63).
Analysis using HPLC-ICP-MS: Eluents from HPLC were directly inserted into a perfluoroalkoxy alkane nebulizer (PFA- 100, IAS Inc., Tokyo, Japan) via a poly ethyl ether ketone (PEEK) tubing (0.13 mm, i.d.) with the nebulizer connected to the ICPMS apparatus.
Differentiation of human iPS cells into pancreatic β cells: Pancreatic differentiation followed the 5-stage β cell differentiation protocol reported by Shahjalal et al. [28] with minor modifications. Undifferentiated cells were dissociated and plated on Synthemax II (Corning, corning, NY, USA) -coated 6 well plates at 500,000 cells per well in a medium (StemFit®AK03N, Ajinomoto Co., Inc., Tokyo, Japan) contained 10 μM Y27632 (Wako Pure Chemical Industries, Ltd.) at day -2. On day 0, differentiation was initiated by replacing the culture with Medium 1, consisting of DMEM (Life Technologies, Carlsbad, CA, USA) with 4,500 mg/L glucose supplemented with 3 μM CHIR99021 (Merck KGaA, Darmstadt, Germany), 100 ng/mL recombinant human Activin-A (R&D systems, Minneapolis, MN, USA), and 2% B27 supplement (Life Technologies). On days 1 and 2, the media was replaced with medium 1 without CHIR99021. On day 3, cells were passaged and seeded on Synthemax II-coated 96 well plates at 100,000 cells per well in Medium 2: RPMI (Life Technologies) supplemented with 0.25 μM SANT-1 (Wako Pure Chemical Industries, Ltd.), 50 ng/mL recombinant human FGF10 (Peprotech, Rocky Hill, NJ, USA), and 2% B27 supplement. From day 5, the cells were cultured in Medium 3, consisting of DMEM with 4,500 mg/L glucose supplemented with 0.25 μM SANT-1, 0.1 μM LDN193189 (Wako Pure Chemical Industries, Ltd.), 10 μM SB431542 (Merck kGaA), 2 μM retinoic acid (Stemgent, Lexington, MA, USA), and 1% B27 supplement. From day 11 on, the media was changed to Medium 4, consisting of DMEM with 4,500 mg/L glucose supplemented with 0.1 μM LDN193189, 5 μM TGF-β type I receptor kinase inhibitor II (Merck KGaA), 0.3 μM (-)-indolactam V (R&D systems), and 1% B27 supplement. Finally, from day 13 to 29, cells were cultured in Medium 5, which was composed of Knockout DMEM/F-12 (Life Technologies) supplemented with 50 ng/mL exendin-4 (AnaSpec, Inc., Fremont, CA, USA), 10 mM nicotinamide (Sigma-Aldrich), and 1% B27 supplement. Each medium composition is tabulated in Table 1.
| Day | -2-0 | 0-1 | 1-3 | 3-5 | 5-11 | 11-13 | 13-29 |
|---|---|---|---|---|---|---|---|
| Medium | StemFit® AK03N | DMEM | DMEM | RPMI | DMEM | DMEM | DMEM/F12 |
| Supplement | B27 | B27 | B27 | B27 | B27 | B27 | |
| Additive | Y27632 | CHIR99021, Activin-A | Activin-A | SANT-1, LDN193189, SB431542, retinoic acid | SANT-1, LDN193189, SB431542, retinoic acid | LDN193189, (-)-indolactam V, TGF-β type I receptor kinase inhibitor II | Exendin-4, nicotinamide |
| Medium 1 | Medium 1 without CHIR99021 | Medium 2 | Medium 3 | Medium 4 | Medium 5 |
Table 1: Scheme of the differentiation from iPS cells into pancreatic cells.
Real-time PCR analysis: Total RNA was extracted from the cells using RNeasy mini kits (Qiagen, Hilden, Germany). Complementary DNA was synthesized using ReverTraAce (Toyobo Co., Ltd., Osaka, Japan). Gene expression levels were quantified by real-time PCR assay with THUNDERBIRD SYBR qPCR Mix (Toyobo Co., Ltd.) on a StepOne realtime PCR System (Life Technologies). Actual experiments were operated in accordance with the instruction manual (n=3). Each mRNA level was determined by standard curve method. The level of each gene expression was normalized to that of GAPDH. Primer sequences are shown in the Supplementary Table S1.
Immunocytochemistry: Cells were fixed with 4% paraformaldehyde for 30 min. Antibody information are shown in the Supplementary Table S2. In quantitative analysis, positive cells versus total cells (DAPI-positive cells) were quantified using ImageXpress Micro cellular imaging system (Molecular Devices, LLC., Sunnyvale, CA, USA) (n=3).
Cell extraction: Medium solution was removed from cultured dishes using an aspirator. Residual media were washed with 1 mL saline and thereafter the supernatant removed using an aspirator. This procedure was repeated twice. Subsequently, a second 1 mL saline aliquot was added into the dish and the cultured cells collected into a 1.5 mL tube by scraping and pipetting. Cell number was counted using a cell counter system by taking an aliquot of the cell suspension. Saline was added into the tube to adjust the cell concentration to 1.0 × 10⁷ cells mL-1 for each sample tube. Procedures for cell extraction were performed using a centrifuge (Centrifuge 5417R, Eppendorf, Hamburg, Germany). Under operational conditions the centrifugal force and temperature were 20,000 × g and 4°C, respectively. Cell suspensions were centrifuged under the above-mentioned conditions for 10 min. After, the centrifuged cell pellet was re-suspended by pipetting prior to the cell suspension being centrifuged once again under the same conditions. Finally, the supernatant was collected into a separate sample tube and stored in a container at 4 °C until ready for injection into the HPLC-ICP-MS.
Extracted protein quantification: The amounts of the extracted protein in samples were quantified using a Qubit® Protein Assay Kit by Qubit® 2.0 Fluorometer (Life Technologies) according to the manufacturer’s protocol. This analytical method has a quantification range from 0.25 to 5.0 μg protein for the sample.
Results and Discussion
Column selection
Complete isolation of intracellular metal species is extremely difficult because of the extent-no less than 300 metalloenzymes-of their presence [1]. Our approach adopted a method to distinguish intracellular metals based on the following functionality: i) protein binding metals-contributes to maintaining structure and activity of enzymes, ii) labile metals-non-binding protein metals, and having a function as a signal transferring molecule [6-8,10]. This study aimed to quantify the concentration in both intracellular metal forms during cell differentiation. Size exclusion chromatography was thought that was suitable for our approach. Three columns having varying characteristics were tested. Typical chromatograms of mw markers for each size exclusion column are shown in Figure 1. The results show that when using Superdex 200, mw marker standards were clearly separated into six peaks. Although at first glance the results look promising, there may be insufficient separation to isolate all intracellular components. For the same reason, Superdex 75 was also inappropriate for our purpose. Regarding the Superdex peptide column, it is evident that the elution peaks of mw markers without tyrosine eluted in the same vicinity and therefore seemed to be able to distinguish between large molecular weight components, such as metalloproteins and small molecular weight components, such as labile metals. Additionally, the resolution between cytochrome C and tyrosine is 17.4 estimated by equation (1).

Figure 1: Chromatograms of mw markers for each size exclusion column at UV 280 nm. (i) Superdex 200, (ii) Superdex 75 and (iii) Superdex peptide. (a) glutamate dehydrogenase; 290 kDa, (b) lactate dehydrogenase; 142 kDa, (c) enolase; 67 kDa, (d) myokinase; 32 kDa, (e) cytochrome C; 12.4 kDa and (f) tyrosine; 181 Da.
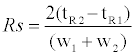
Where,
Rs - is the resolution
tR1 and tR2 - are the elution time of cytochrome C and tyrosine respectively.
w1 and w2 - are the half width of cytochrome C and tyrosine respectively.
Result mentioned above suggested the feasibility to quantify intracellular metal concentrations of both types, inclusively. Therefore, the Superdex peptide column was selected for this study. We defined both peaks as a range of elution time; i) protein binding metals were defined as a fraction of 8-18 min as elution time, ii) labile metals were defined as a fraction of 18-20 min as elution time.
Analytical performance evaluation
Although ICP-MS is the widely used to quantify ultra-trace metals, it doesn’t have a separation function. Thus, we employed HPLC-ICP-MS for separating intracellular metals in this study. However, this technique may cause several interferences (e.g., adsorption to instrument’s pathway, and contamination from materials of the analytical column). To prevent such interferences, an acidic solution is generally used for ICP-MS experiments. But, it is not possible to use acidic solutions with this study through limitation of the sample nature and column capability. Therefore, we used EDTA-metal complexes with neutral (pH 7) aqueous solution for calibration standards on HPLC-ICP-MS analysis because of its remarkable stability properties (e.g., log KML 16.5; Zn2+, 25.4; Fe3+, 18.8; Cu2+). First, we confirmed the presence (or absence) of any adsorption to the analytical column. We compared three conditions using the EDTA-metal complex standard; (1) an acidic (pH 1) condition without column (i.e., flow injection ICP-MS), (2) a neutral (pH 7) condition without the column (i.e., flow injection ICP-MS), and (3) a neutral (pH 7) condition with column (i.e., HPLC-ICP-MS; the present method). The results indicated that signal intensities of each condition were almost identical (Figure 2). Hence, we propose that this HPLC-ICP-MS method has no interference (e.g., adsorption and contamination) and thus has potential to acquire results equal to the well-established ICP-MS method. Thereafter, the repeatability of the method was established by continuous analysis (n=5) of the EDTA-metal standard solutions. Calibration curves were obtained showing good linearity (Figure 3) in the range from 0.1 to 3.0 ng (zinc and iron) and from 0.01 to 3.0 ng (copper) on the presented method. Furthermore, the results presented good repeatability and trueness (the data also shows in Figure 3). Detection limits (evaluated as 3σ) of zinc, iron and copper were 0.052, 0.036, 0.0032 ng per injection, respectively.

Figure 2: Comparison of signal intensities from analyzed EDTA-metal standards (n=5). (1) shows the results detected at acidic (pH 1) conditions without the column. (2) shows the results detected at neutral (pH 7) conditions without the column. (3) shows the results detected at neutral conditions (pH 7) with the column.

Figure 3: Analytical performance for individual metals (n=5). (A) Calibration curves for the quantification of metal concentrations by HPLC-ICP-MS. Upper left; Zn (m/z 64) in the range from 0.1 to 3.0 ng. Upper right; Fe (m/z 54) in the range from 0.1 to 3.0 ng. Lower left; Cu (m/z 63) in the range from 0.01 to 3.0 ng. Lower right; Cu (m/z 63) in the range from 0.01 to 0.1 ng. (B) Actual numerical data including a repeatability, trueness and detection limit. Top shows the result of Zn. Middle shows the result of Fe. Bottom shows the result of Cu.
Metalloprotein analysis
To keep the cell extract intracellular condition (i.e., pH and ion strength) is important to acquire intracellular information. Therefore, all procedures were performed using solvent conditions at pH neutral with salt concentration adjusted similar to saline. In this study, we analyzed metallothionein (hereafter referred to as MT) standards and holo-transferrin (hereafter referred to as Tf) standards. Results are shown in Figure 4. There are no signal in the MT-Fe, Tf-Zn and Tf-Cu samples. These mean that the metal is absence within the protein. Plot curves for MT (0.01, 0.05, 0.1, 0.3, 0.5, 0.7, 1.0 μg per injection) and Tf (0.1, 0.3, 0.5, 0.7, 1.0 μg per injection) presented good linearity. Thereafter, we demonstrated the fractionation of a mixed metallothionein and EDTA-Zn sample (the typical chromatogram is shown in Figure 5). It is evident from the chromatogram that the present method is able to fractionate MT-Zn (protein binding zinc) and EDTA-Zn (Labile Zn), completely, thus allowing comparison of intracellular metal extracts with the present method.

Figure 4: Plotted curves were obtained by each signal (n=3) of metalloproteins prepared at several concentrations. (a) Zinc binding to metallothionein. (b) Iron binding to metallothionein. (c) Copper binding to metallothionein. (d) Zinc binding to transferrin. (e) Iron binding to transferrin and (f) Copper binding to transferrin.

Figure 5: Chromatogram of a metallothionein and EDTA-Zn chelate mixture. (1) Metallothionein peak meaning “Protein binding zinc”. (2) EDTA-Zn peak meaning “Labile zinc”.
Reproducibility of the extraction procedure as a function of extracted protein concentration
Generally, a proteomics study uses a surfactant as a solubilizing agent for an investigation of cellular protein. However, this method is not able to apply to the application which acquires the information on metalloprotein with respect to the binding metal species and their concentration. Surfactants used during pre-treatment, will alter the native state of the metalloprotein by changes in their conformation and therefore a method for the study of intracellular metals is required that uses no surfactant and no denaturant. In this study, a method was adopted to use a saline buffer containing no other chemical throughout the entire procedure (such as washing, suspension and crushing). The reproducibility of the present method was confirmed on the extracted protein within a 1-day period; n=3, or over an extended period (number of days); n=3 using a Qubit® 2.0 Fluorometer. Experiments were performed using cell pool samples divided into respective tubes (1 × 10⁷ cells/ mL), storing each at -80°C until required. Experimental results are shown in Table 2, obtaining good reproducibility; coefficient of variation for each of the daily experiments is less than 3.7% (1.8-3.7%). Daily precision between experiments gave a coefficient variation of 4.9%. These results show that the present method is able to stably-extract intracellular protein.
| Day no. | Extracted protein (μg/ml) | Zn; ng/106 cells | Fe; ng/106 cells | Cu; ng/106 cells | |||
|---|---|---|---|---|---|---|---|
| (1) | (2) | (1) | (2) | (1) | (2) | ||
| 1 | 62.5 ± 1.2 | 39 ± 1.0 | 1.3 ± 0.1 | 34 ± 1.4 | 6.1 ± 1.3 | 2.9 ± 0.1 | <0.1 |
| 2 | 67.3 ± 2.2 | 39 ± 0.8 | 1.0 ± 0.3 | 34 ± 1.1 | 7.0 ± 0.6 | 2.9 ± 0.1 | <0.1 |
| 3 | 61.7 ± 20.3 | 38 ± 2.1 | 1.2 ± 0.2 | 34 ± 1.5 | 4.5 ± 0.1 | 3.1 ± 0.1 | <0.1 |
| Daily precision | 63.9 ± 3.1 | 39 ± 1.3 | 1.2 ± 0.2 | 34 ± 1.3 | 5.9 ± 0.7 | 3.0 ± 0.1 | <0.1 |
(Mean ± SD; n=3)
Table 2: Experimental reproducibility on quantifications of extracted proteins and each metal in cell pool samples (n=3). (1) shows the result of protein binding metal. (2) shows the result of labile metal.
Analytical reproducibility for iPS cell extracts by HPLC-ICPMS
iPS cell extracts were analyzed by HPLC-ICP-MS using the same method as the above-mentioned experiments for the quantification of intracellular metals. Analytical results are also shown in Table 2. The resulting quantitative value for each individual metal form showed that the present method gave good reproducibility. Furthermore, HPLC-ICP-MS has the potential to detect the almost every element simultaneously. We propose that the present method is suitable to quantify the concentration of both intracellular metal forms.
Analytical results by real-time PCR and immunocytochemistry
Analytical results of each gene expression analyzed by realtime PCR were shown in Figure 6. OCT3/4, SOX17, PDX1 and INS were employed as each marker gene of iPS, DE, PP cells and ECs, and were shown as major expressed genes on each cell state, respectively. Analytical results by immunocytochemistry are also shown in Figure 6. Results show that over 97% of the population of the iPS cell sample are OCT3/4 positive cells, 94% of the DE cell sample population are SOX17 positive cells, over 81% population the PP cell sample are PDX1 positive cells, and over 18% population of the EC are C-pep positive cells. In experimental results, trends to previous studies show similarities. These results show that each sample is in different cell states.

Figure 6: In vitro differentiation of iPS cells into DE (definitive endoderm), PP (pancreatic progenitor) cells and ECs (endocrine cells). (A) Schematic of the differentiation procedure into DE cells, PP cells and ECs. (B) Analytical results of real-time PCR. OCT3/4, SOX17, PDX1 and INS genes were used as undifferentiated cells, DE cells, PP cells and ECs marker, respectively. Error bar shows the standard deviation of the mean (n=3). (C) Results of each protein expression analyzed by fluorescence micro-scope (Mean ± SD, n=3). C-pep was employed as an indicator of de novo insulin synthesis. Scale bar=100 μm.
Analytical application for cell extracts of iPS and differentiated state cells
In this study, we applied our method to analyses of iPS cells and their differentiated cells into endoderm, pancreatic progenitor and endocrine cells. These cells had different characters, such as gene and protein expressions (Figure 6). Quantitative results of extracted protein amount are shown in Figure 7. Extracted protein from iPS cells was the highest amount in other cell states. Extracted protein amount might relate to cell proliferation performance (e.g., up-regulating protein syntheses including the expression of DNA polymerase for cell division). Thus, we thought that these cells also have differences in their metal requirement from media. Analytical results by HPLC-ICP-MS were shown in Figure 8. These results were demonstrated good repeatability for analyses of intracellular metals when adopting the present method, and were shown differences on each intracellular metal amount. iPS cells contained the highest amount of protein binding zinc, iron and copper of all cell states as well as the extracted protein. It was suggested that iPS cells required much amount of metals as protein binding form from the medium for the cell division. Interestingly, labile zinc on endocrine cells was shown the highest amount of other states. In the other report, zinc ion has a role as essential factor to excrete insulin from pancreas in vivo [29]. Altogether, endocrine cells were up-regulated uptake of zinc ion from media, and might be keeping labile form (e.g., Zn2+) without binding to protein. Considering on the basis of this information, increasing zinc ion content might cause to improve the differentiation efficiency into the endocrine cell and/or the excretion efficiency of insulin. As a result, the presented method might be able to reveal metal requirements as nutrients for culturing cells, and have a potential as a powerful tool to investigate the metabolism relating intracellular metal.

Figure 7: Comparison of extracted protein concentration. (a); Induced pluripotent stem (iPS; undifferentiated) cell, (b); Definitive Endoderm cell, (c); Pancreatic progenitor cell and (d); Endocrine cell. Error bar shows the standard deviation of the mean (n=3).

Figure 8: Comparison of both metal form concentrations quantified by the present method. (A); Protein binding Zn (B); Labile Zn (C); Protein binding Fe (D); Labile Fe (E); Protein binding Cu (F); Labile Cu. (a); induced pluripotent stem (iPS; undifferentiated) cell, (b); Definitive endoderm cell, (c); Pancreatic progenitor cell, (d); Endocrine cell. Error bar shows the standard deviation of the mean (n=3).
Conclusion
A new analytical method has been developed to fractionate and quantify two metal forms; the protein binding metal and the labile metal. Our method has several advantages compared with the existing methods on the analysis of intracellular metal (e.g., separation and quantification performance). We have finally achieved the objective of analyzing the intracellular metal concentration in the various cells. They are contained the iPS cells and several differentiated cells. Our analytical result has revealed that the intracellular metal concentration change dynamically during cell differentiation. It may indicate the metal requirement from the media. In a recent report, changing the medium composition increases the potential of cell differentiation [30]. We expect that our method is used to provide the new important knowledge about the relationship between the intracellular metal and the metabolic reaction.
Acknowledgement
We thank Ms. Nao Furuta for technical assistance and discussion.
References
- Vallee BL, Falchuk KH (1993) The biochemical basis of zinc physiology. Physiol Rev 73: 79-118.
- Maret W (2009) Molecular aspects of human cellular zinc homeostasis: redox control of zinc potentials and zinc signals. Biometals 22: 149-157.
- Fukada T, Yamasaki S, Nishida K, Murakami M, Hirano T (2011) Zinc homeostasis and signaling in health and diseases: Zinc signaling. J Biol Inorg Chem 16: 1123-1134.
- Haase H, Rink L (2014) Zinc signals and immune function. Biofactors 40: 27-40.
- Colvin RA, Holmes WR, Fontaine CP, Maret W (2010) Cytosolic zinc buffering and muffling: their role in intracellular zinc homeostasis. Metallomics 2: 306-317.
- Kaltenberg J, Plum LM, Ober-Blöbaum JL, Hönscheid A, Rink L, et al. (2010) Zinc signals promote IL-2-dependent proliferation of T cells. Eur J Immunol 40: 1496-1503.
- Taylor KM, Hiscox S, Nicholson RI, Hogstrand C, Kille P (2012) Protein kinase CK2 triggers cytosolic zinc signaling pathways by phosphorylation of zinc channel ZIP7. Sci Signal 5: ra11.
- Krezel A, Hao Q, Maret W (2007) The zinc/thiolate redox biochemistry of metallothionein and the control of zinc ion fluctuations in cell signaling. Arch Biochem Biophys 463: 188-200.
- Jin R, Chow VT, Tan PH, Dheen ST, Duan W, et al. (2002) Metallothionein 2A expression is associated with cell proliferation in breast cancer. Carcinogenesis 23: 81-86.
- Andrews GK (2000) Regulation of metallothionein gene expression by oxidative stress and metal ions. Biochem Pharmacol 59: 95-104.
- Gunshin H, Mackenzie B, Berger UV, Gunshin Y, Romero MF, et al. (1997) Cloning and characterization of a mammalian proton-coupled metal-ion transporter. Nature 388: 482-488.
- Adlard PA, Parncutt JM, Finkelstein DI, Bush AI (2010) Cognitive loss in zinc transporter-3 knock-out mice: a phenocopy for the synaptic and memory deficits of Alzheimer's disease? J Neurosci 30: 1631-1636.
- Sehgal VN, Jain S (2000) Acrodermatitis enteropathica. Clin Dermatol 18: 745-748.
- Killip S, Bennett JM, Chambers MD (2007) Iron deficiency anemia. Am Fam Physician 75: 671-678.
- Kim BE, Smith K, Meagher CK, Petris MJ (2002) A conditional mutation affecting localization of the Menkes disease copper ATPase. Suppression by copper supplementation. J Biol Chem 277: 44079-44084.
- Keen MJ, Rapson NT (1995) Development of a serum-free culture medium for the large scale production of recombinant protein from a Chinese hamster ovary cell line. Cytotechnology 17: 153-163.
- Martin SJ, Mazdai G, Strain JJ, Cotter TG, Hannigan BM (1991) Programmed cell death (apoptosis) in lymphoid and myeloid cell lines during zinc deficiency. Clin Exp Immunol 83: 338-343.
- Eagle H (1959) Amino acid metabolism in mammalian cell cultures. Science 130: 432-437.
- Knöspel F, Schindler RK, Lübberstedt M, Petzolt S, Gerlach JC, et al. (2010) Optimization of a serum-free culture medium for mouse embryonic stem cells using design of experiments (DoE) methodology. Cytotechnology 62: 557-571.
- Keenan J, Pearson D, Clynes M (2006) The role of recombinant proteins in the development of serum-free media. Cytotechnology 50: 49-56.
- Zhang J, Robinson D (2005) Development of Animal-free, Protein-Free and Chemically-Defined Media for NS0 Cell Culture. Cytotechnology 48: 59-74.
- Haase H, Hebel S, Engelhardt G, Rink L (2015) The biochemical effects of extracellular Zn(2+) and other metal ions are severely affected by their speciation in cell culture media. Metallomics 7: 102-111.
- Muzzioli M, Stecconi R, Donnini A, Re F, Provinciali M (2007) Zinc improves the development of human CD34+ cell progenitors towards Natural Killer cells and induces the expression of GATA-3 transcription factor. Int J Biochem Cell Biol 39: 955-965.
- Wijesekara N, Chimienti F, Wheeler MB (2009) Zinc, a regulator of islet function and glucose homeostasis. Diabetes Obes Metab 11 Suppl 4: 202-214.
- Takeda T, Kimura M, Yokoi K, Itokawa Y (1996) Effect of age and dietary protein level on tissue mineral levels in female rats. Biol Trace Elem Res 54: 55-74.
- Noël L, Huynh-Delerme C, Guérin T, Huet H, Frémy JM, et al. (2006) Cadmium accumulation and interactions with zinc, copper, and manganese, analysed by ICP-MS in a long-term Caco-2 TC7 cell model. Biometals 19: 473-481.
- Thompson RB (2005) Studying zinc biology with fluorescence: ain't we got fun? Curr Opin Chem Biol 9: 526-532.
- Shahjalal HM, Shiraki N, Sakano D, Kikawa K, Ogaki S, et al. (2014) Generation of insulin-producing β-like cells from human iPS cells in a defined and completely xeno-free culture system. J Mol Cell Biol 6: 394-408.
- Tamaki M, Fujitani Y, Hara A, Uchida T, Tamura Y, et al. (2013) The diabetes-susceptible gene SLC30A8/ZnT8 regulates hepatic insulin clearance. J Clin Invest 123: 4513-4524.
- Shiraki N, Shiraki Y, Tsuyama T, Obata F, Miura M, et al. (2014) Methionine metabolism regulates maintenance and differentiation of human pluripotent stem cells. Cell Metab 19: 780-794.
Relevant Topics
Recommended Journals
Article Tools
Article Usage
- Total views: 12113
- [From(publication date):
specialissue-2016 - Jul 04, 2025] - Breakdown by view type
- HTML page views : 11101
- PDF downloads : 1012