Research Article Open Access
Sorption Study of Cd(II) from Aqueous Solution Using Activated Carbon Prepared from Vitellaria paradoxa Shell
| Jimoh AA1*, Adebayo GB2, Otun KO1, Ajiboye AT1, Bale AT1, Jamiu W2 and Alao FO2 | |
| 1Department of Chemical, Geological and Physical Sciences, Kwara state University Malete, PMB 1530 Ilorin, Nigeria | |
| 2Department of Chemistry, Faculty of Science, University of Ilorin, PMB 1515, Ilorin, Nigeria | |
| Corresponding Author : | Jimoh AA Department of Chemical Geological and Physical Sciences Kwara state University Malete PMB 1530 Ilorin, Nigeria Tel: +2348032422513 E-mail: aquochem@yahoo.com |
| Received January 20, 2015; Accepted March 24, 2015; Published March 27, 2015 | |
| Citation: Jimoh AA, Adebayo GB, Otun KO, Ajiboye AT, Bale AT, et al. (2015) Sorption Study of Cd(II) from Aqueous Solution Using Activated Carbon Prepared from Vitellaria paradoxa Shell. J Bioremed Biodeg 6:288. doi:10.4172/2155-6199.1000288 | |
| Copyright: © 2015 Jimoh AA, et al. This is an open-a ccess article distributed under the terms of the Creative Commons Attribution License, which permits unrestricted use, distribution, and reproduction in any medium, provided the original author and source are credited. | |
Related article at Pubmed Pubmed  Scholar Google Scholar Google |
|
Visit for more related articles at Journal of Bioremediation & Biodegradation
Abstract
Activated carbon prepared from vitellaria paradoxa (shea nut) shell using otho-phosphoric acid has been used for the removal of Cd(II) ion from aqueous solution. The adsorbent sample was characterized by some physicochemical and spectroscopic parameters such as pH, point of zero charge (PZC), moisture content, iodine number, loss on ignition, bulk density, XRF, SEM and TEM. The pH and the PZC of the sample were found to be 4.0 and 5.8 respectively. The adsorbent sample has moisture content of 5.22 ± 0.1%, iodine number of 456.50 ± 59%, loss on ignition 10.71 ± 0.18% bulk density of 0.84 ± 0.09%. The XRF analysis indicated that Ca, Si and Fe were major constituents in the adsorbent sample. The SEM and TEM analysis results indicated good adsorptive characteristics of the adsorbent. Result from the FTIR analysis indicate presence of some important components such as C=O, O-H, C-O N-H, and P-H which responsible for high adsorptive capacity of the adsorbent. The equilibrium adsorption of Cd(II) ion data was well fitted with Langmuir and Freundlich isotherms with correlation coefficient of 0.996 and 0.998 respectively. The kinetic study revealed that pseudo-second order kinetic was better fitted compared to pseudofirst- order kinetic. Thermodynamic experiment indicated that the adsorption process was exothermic with ΔH equals +27.84 KJ/mol and ΔS equals -0.993 KJ/molK.
| Keywords |
| Vitellaria paradoxa; Adsorption; Heavy metals; Kinetics; Thermodynamics |
| Introduction |
| “Heavy metals” is a general term, which applies to the group of metals and metalloids with atomic density greater than 4 g/cm3 or 5 times or more, greater than water [1-6]. However, being a heavy metal has little to do with density but concerns chemical properties. Heavy metals include lead (Pb), cadmium (Cd), zinc (Zn), mercury (Hg), arsenic (As), silver (Ag), chromium (Cr), copper (Cu), iron (Fe), and the platinum group elements. |
| Cadmium is a metallic element belonging to group II B of the Periodic Table (atomic number: 48 and relative atomic mass: 112.41). Cadmium in its elemental form is a soft, silver-white metal. It is not usually present in the environment as a pure metal. Cadmium is most often present in nature as complex oxides, sulphides, and carbonates in zinc, lead, and copper ores. It is rarely present in large quantities as chlorides and sulphates [7]. |
| Cadmium is widely distributed in the Earth’s crust. Cadmium is released by various natural and anthropogenic sources to the atmosphere, aquatic environments (fresh and salt water environments) and terrestrial environments. There are fluxes between these compartments. Cadmium released to the atmosphere can deposit to land and aquatic environments, and some cadmium released to soil over time will be washed out to the aquatic environments [8]. |
| In the environment, cadmium is toxic to plants, animals and microorganisms. Being an element, cadmium is persistent – it cannot be broken down into less toxic substances in the environment. The degree of bioavailability and potential for effects varies depending on the form of cadmium. Cadmium bio accumulates mainly in the kidneys and liver of vertebrates and in aquatic invertebrates and algae [9]. |
| Because of its toxicity and bioaccumulation, Cd(II) is considered as a priority pollutant by the U S Environmental Protection Agency. The permissible limit for Cd(II) as described by WHO is 0.01 mg/dm3. The main anthropogenic pathway through which Cd(II) enters the water bodies is via wastes from industrial processes such as electroplating, plastic manufacturing, metallurgical processes and industries of pigments and Cd/Ni batteries. |
| Adsorption is the separation of a substance from one phase accompanied by its accumulation or concentration at the surface of another. It is the process that takes place when a liquid or most commonly a gas known as the adsorbate accumulates on the surface of a solid adsorbent and forming a molecular film. Adsorption, similar to surface tension, is a consequence of surface energy. In the bulk material, all the bonding requirements, such as ionic, covalent or metallic of the constituent atoms of the material are filled [10]. |
| The adsorption process is being widely used by various researchers for the removal of heavy metals from waste streams, or removal of pollutant from air and activated carbon is used as an adsorbent [11]. Adsorption is considered to be particularly competitive and effective process for the removal of heavy metals at trace quantities [12,13]. |
| The shea tree (Vitellaria paradoxa) is found in areas with 400- 1800 mm rainfall per year. It is a multi-purpose tree daily used by rural African communities. The fruit when very ripe is either eaten as a snack, but it is also a famine food. It can be eaten raw or slightly cooked. The pulp can be processed into juice. According to McAllan et al. [14], the pulp could also be removed by fermentation. The nuts are laid out to dry in the sun. The kernels are extracted usually before the butter making starts, by cracking open the nuts with stones or gently pounding in a mortar and the powder is made into butter. |
| Madhava Rao et al. [15] studied the removal of copper and cadmium from the aqueous solutions by activated carbon derived from Ceiba pentandra hulls. Parameters such as equilibrium time, effect of pH and adsorbent dose on removal were studied. The experimental data was analysed by both Freundlich and Langmuir isotherm models. The maximum adsorption capacity of copper and cadmium was calculated from Langmuir isotherm and found to be 20.8 and 19.5 mg/g, respectively. |
| The sorption kinetics of the copper and cadmium have been analysed by Lagergren pseudo-first-order and pseudo-second-order kinetic models. However, Itodo and Itodo [16] studied Activation chemistry and kinetics of shea nut shell biosorbents for textile waste water treatment. Phosphoric acid (H3PO4) and zinc chloride (ZnCl2) catalyzed Shea nut shells were used for the adsorption processes. Kinetics, mode of diffusion of industrial dye uptake and thermodynamics data was obtained. The result indicates that the sorption of dye spontaneously increases with time and decreases after equilibration was reached. The adsorption follows the pseudo second order kinetic model which gave the least % SSE (0.449-1.348), best linearity (R2=0.998-0.999) and closer agreement between the experimental and calculated qe values (qe exp., 96.985/qe cal., 100.00). Mode of transport deviates from the intraparticle diffusion model. The percentage dye removal coupled with the close proximity of generated data to those reviewed in literatures, is an indication that Shea nut shells could compare, to a good extent with commercial activated carbon for organic dye removal from dyestuff waste water. The aim of this research work is to investigate the kinetic and thermodynamics of the removal of Cd(II) in aqueous solution through adsorption process using adsorbents produced from vitellaria paradoxa shell. Activated carbons have been studied extensively for cadmium removal. However, a few milligrams of metal ions per gram of activated carbon have been removed by many adsorbents. Activated carbon use in developing countries is more problematic due to cost. Therefore, a definite need exists for low-cost adsorbents, which exhibit superior adsorption capacities and local availability. Vitellaria paradoxa shell is a waste material which is locally obtained during the processing of vitellaria paradoxa seed for shea butter production. The shell has been successfully used for adsorption experiments [16] for the removal of dyes from textile effluents. However, the use of this shell for the removal of heavy metal ions has not been reported in recent time. In this study, the shell was used to prepare adsorbents and the adsorbents produced were used to remove cadmium(II) ions from aqueous solution and the data derived were used to determine the sorption isotherm, kinetics and thermodynamics of the adsorbents. |
| Materials and Methods |
| Activated carbon preparation |
| The Shea nut shells (vitellaria paradoxa) were collected from a small scale Shea butter producing factory at Budo oja at Ifelodun L.G.A. area in Kwara state. The sample was washed with plenty of water to remove surface impurities and sundried. Sample was later dried in an oven at 105°C overnight [17-22]. 100 g of pre-treated sample (<2 mm mesh size) was introduced into a clean and pre weighed crucibles and was introduced into a furnace at 500°C for 5 minutes after which was be poured from the crucible into a bath of ice block. The excess water was drained and the sample was sun-dried. This process was repeated until a substantial amount of carbonized sample was obtained. The carbonized sample was washed, using 10% HCl to remove surface ash, followed by hot water wash and rinsing with distilled water to remove residual acid [17,23]. The solids were then dried in the oven at 100°C for one hour [24]. |
| Accurately 3 g weighed carbonized sample was mixed with 2 cm3 of each 1 M activating agent (H3PO4). The sample was introduced into a furnace, heated at 800°C for 15 minutes. The activated sample was cooled with ice cold water. Excess water was drained and sample was allowed to dry at room temperature [25]. |
| Sample preparation |
| An accurate weight of 2.740 g CdSO4 was dissolved in 1 liter of de-ionised water to produce the stock solution. This stock solution was then diluted into the required concentration using de-ionised water whenever necessary. |
| The adsorption of acid activated vitellaria paradoxa was carried out in a batch system. To find the time for the adsorption to equilibrium, 0.1 g of activated vitellaria paradoxa was added to 50 mL of metal solution with a concentration of 200 mg/L. The mixture was shaken (120 rpm) for 2 hours at ambient temperature. The metal concentration was analyzed by using flame atomic absorption spectrophotometer (Analysis 100, Perkin Elmer). |
| The amount of heavy metal adsorption per unit weight of activated vitellaria paradoxa at time t (qt) (mg/g), was calculated by: |
 (1) (1) |
| where Co and Ct are the metal concentrations (mg/L) at the beginning and time t, respectively. V is the volume of the metal solution and m is the mass of adsorbent. |
| Adsorption isotherms of the heavy metals were determined by varying the initial concentration of the metal solutions in range of 10- 200 mg/L at constant and time. |
| Results and Discussion |
| The moisture content of the raw sample and activated sample was 5.22% and 20.20% respectively. Moisture content suggests extensive porosity in the structure of all adsorbents. It has been observed that if the moisture content of adsorbent is high its adsorptive capacity will be reduced [26]. |
| The ash content generally indicates the inorganic constituents associated with carbon. Ash content of adsorbents is believed to increase with higher carbonization temperature as this tends to lower the volatile matter present in the adsorbents. The percentage ash content obtained 30.10% and 10.71% for raw and activated samples respectively. Decrease in ash content of activated sample indicated a decrease in percentage volatile matter which indicates that ash is nonvolatile [27]. |
| The pH of the activated adsorbent after mixing with de-ionised water was 4.0 while that of the raw sample was 7.2. The change in the value of pH of the adsorbent may be attributed to the adsorption of H+ ions from solution on the sorbent surface [28]. |
| The pH of adsorbent depends on the number of factors which include preparation methodology, inorganic matter content, chemically active oxygen groups on its surface as well as the kind of treatment to which the adsorbent was subjected. |
| The result of the iodine number of the raw and activated samples was 204.2 and 256.2 respectively (Table 1). The result indicated that the activated sample prepared by acid activation possesses good adsorptive capacity. Higher iodine number reflects better development of the microporous structure and higher adsorption abilities [29,30]. It was clear that the iodine number of acid activated adsorbents is high due to the phosphoric acid destroying the aliphatic and aromatic species present in plants therefore swiftly removing the volatile matters during the carbonization process as reported by El-Hendawy [31]. |
| Scanning electron microscopy (SEM) |
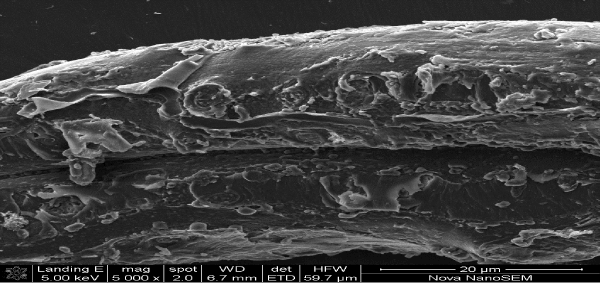
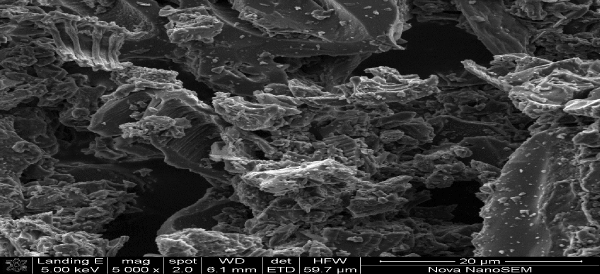
| The surface morphology of the adsorbent was analyzed by scanning electron microscope (SEM). The results of SEM analysis are shown in the micrographs Figures 1-3. The raw sample in Figure 1 showed rough areas of surface of the carbon and very minute micropores. |
| It was generally observed that the pore structure development is influenced by many factors, such as inorganic impurities and the initial structure of the carbon precursor [32]. It can clearly be seen in Figure 2 that chemical activation resulted in a porous structure and the opening of pores on the surface of the activated sample. |
| SEM analysis after adsorption of Cd in Figure 3 however showed a reduced pore sizes as compared to that of the acid activated sample. |
| Transmission electron microscopy (TEM) |
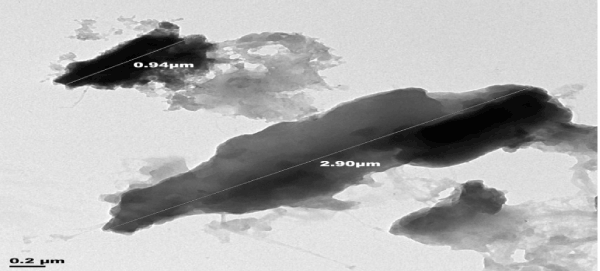
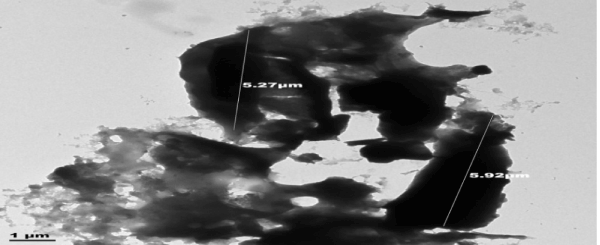
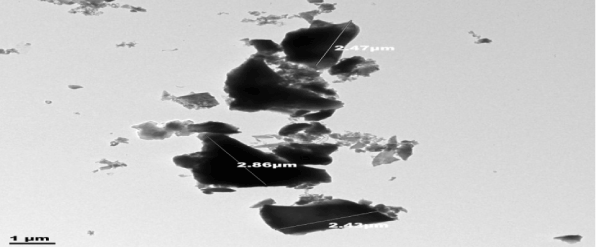
| Transmission electron microscope (TEM) was used to determine the internal morphology of the adsorbent. The results of TEM analysis of the adsorbents, raw sample, activated sample and sample after adsorption are shown in Figures 4-6. |
| The internal pore size of the raw sample Figure 4 was between 0.94-2.90 μm, those of the activated sample Figure 5 ranged between 5.27-5.92 μm. This improvement in pore size of the activated adsorbent could be due to the carbonization in the presence of acid. |
| However, after adsorption, the internal pore size of the Cdembedded adsorbent reduces between 2.43-2.86 μm Figure 6. This observation indicated that the adsorbent effective on Cd adsorption, since the internal pore sizes reduced Cd-embedded adsorbent. This implies that Cd ions occupied spaces in adsorbent. |
| XRF elemental analysis |
| The elemental analysis of the adsorbent as revealed by XRF (Table 2) result showed that Ca, Si and Fe are present as major constituents; Na, Ti and Zn are minor constituents while Mg, Al, P, Mn, Co, Ni, Cu and Cd are in traces. |
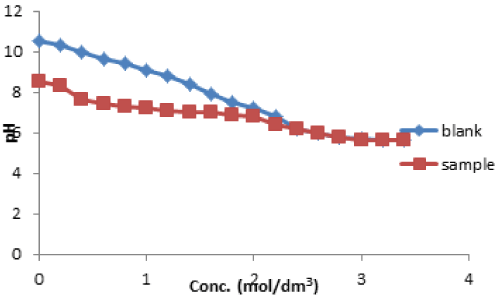
| The point of zero charge of activated sample was determined by potentiometry method. The graph of the pH of sample solution and that of the blank solution were plotted as shown in Figure 7. It could be observed that the pH drop for the sample solution and the blank solution intercepted at pH 5.8, this shows that the pHpzc was found to be 5.8 for vitellaria paradoxa. Cation adsorption becomes enhanced at higher pH than pHpzc, while adsorption of anions equally enhanced at pH less than pHpzc [33]. |
| FTIR Results of the raw sample, activated sample and after adsorption |
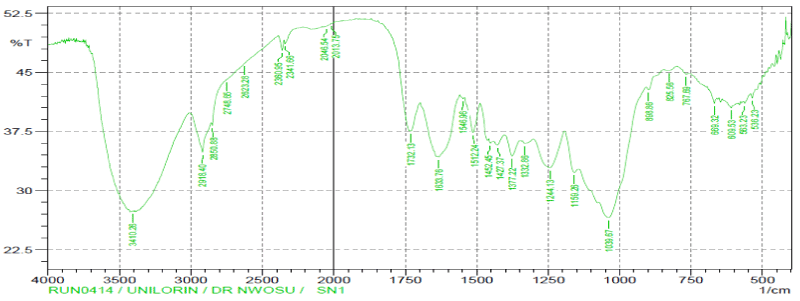
| The comparisons of the Fourier transform infra-red result spectra of raw, modified and after adsorption of the vitellaria paradoxa were given in figures. The FTIR spectrum of the raw reveals complex nature of the adsorbent as evidenced by the presence of a large number of peaks. The band between 3000-3500 cm-1 has been assigned to free and intermolecular bonded hydroxyl (O-H) group of alcohol, phenol or carboxyl [34]. These bonds were present in raw, modified and metalloaded adsorbents; indicating participation of the (O-H) functional group in the metal binding. The peaks at 2918.40 cm-1, 2046.54 cm- 1, 1633.76 cm-1 and 1427.37 cm-1 have been assigned to C-H, C≡C, C≡N and C=C respectively in the raw but were completely absent in the modified and metal-loaded adsorbents. These groups might have been destroyed or evaporated during carbonization or converted into another functional group. |
| The sharp stretch vibrations found within band range 2284-2400 cm-1 appeared to represent functional group of phosphorus belonging to phosphine (P-H). The presence of phosphine group is expected to increase the adsorptive capacity of the adsorbents. |
| The stretch vibrations of C=O in ketones and aldehydes were found in the range 1700-1735 cm-1 [35]. This peak appeared in raw and Cdloaded adsorbent but absent in activated adsorbent. This observation may be attributed to the loss of CO2 during carbonization process and do not reappear after activation. |
| The bend vibrations of N-H at band range 1450-1550 cm-1 indicated presence of secondary amine in raw, activated and Cdloaded adsorbents. The peaks at band range 1500-1600 cm-1 of N=O stretch vibration indicate presence of nitro-group in raw sample, but disappeared in activated sample. Same behaviour was seen for N=O bend vibration at band range of 1300-1400 cm-1. This disappearance may be due to the destruction of the functional group during the process of activation. |
| However, peaks within the band range of 1000-1200 cm-1 has been reported to indicate the stretching of C-O bonds of esters and ethers [36]. |
| The presence of additional peaks with lower wave numbers could be related to the establishment of cadmium bonded onto the surface of the adsorbent. |
| Batch adsorption studies |
| Effect of initial concentration: The effect of initial metal ion concentration varied from 10.0-1000 mg/L is depicted in Figure 8. |
| It was observed that the adsorption capacity was influenced by the metal ion concentration Cd(II). An increase in the initial concentration increased the quantity sorbed. The adsorption capacity of the adsorbent increased from 2.34-52.42 mg/g between 10-200 mg/l after which a decrease in adsorption capacity occurred between 500-1000 mg/L. The trend could be as a result of the increase in the electrostatic interaction between the Cd(II) the absorbent active sites. Moreover, this can be explained by the fact that more adsorption sites were being covered as the metal ions concentration increases [37]. In the case of low metal ions concentration, the ratio of the initial number of moles of metal ions to the available surface area of the adsorbent is large and subsequently the fractional adsorption becomes independent of initial concentration. However, at higher concentrations, the available sites of adsorption become fewer and hence the percentage removal of metal ions which depends upon the initial concentration decreases [38]. It could however be deduced from the result above the equilibrium concentration is at 200 mg/L. |
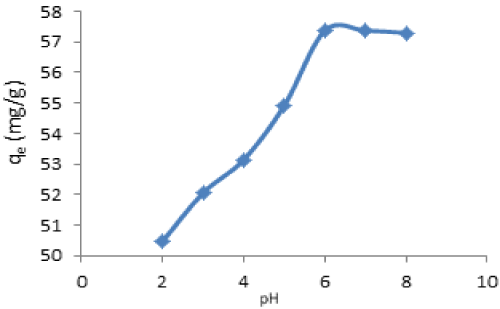
| Effect of pH: The effect of initial solution pH on the adsorption capacity at equilibrium condition was studied. The result for the adsorption of Cd(II) is shown in Figure 8 using 200 mg/L as initial metal concentration. It could be seen that the removal concentration and percentage removal is pH dependent. It was clear that the degree of metal ions adsorption onto the adsorbent increased from 50.48 mg/L to maximum of 57.37 mg/L of Cd(II) when the solution pH was increased from 2-6. However, at the adsorption capacity of the adsorbent remained constant at pH above 6. The maximum percentage removal of Cd(II) was 95.62%. |
| It was observed that pH significantly affect the adsorption process. As the pH of the medium is increased, the competition between positively charged metals ions and H+ ions decreases and metal ions become dominant species available for sorption onto adsorbent [39]. |
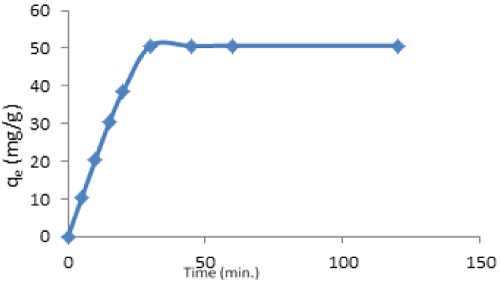
| Effect of contact time: The effect of contact time on the rate of the removal of Cd(II) by vitellaria paradoxa was investigated at initial metal concentration 200 mg/L. The result in Figure 9 shows that the process of adsorption increases steadily within the first 5 minutes and attains a constant value at 30 minutes. The adsorption capacities between 30-120 minutes were consistence. |
| It can be seen that the biosorption process took place in two stages. The first stage was rapid, where more than 75% of adsorption was completed within 30 minutes. The second stage represented a slight decrease or slower biosorption. The rapid initial adsorption may be attributed to the accumulation of metals onto the surface of adsorbent due to its large surface area. With the progressive occupation of these sites, process became slower in the second stage. Moreover, the initial deposited metal ions penetrated to the interior of the adsorbent through intra-particle diffusion which was slower process. This is in accordance with the observation of other similar studies (Figure 10) [40,41]. |
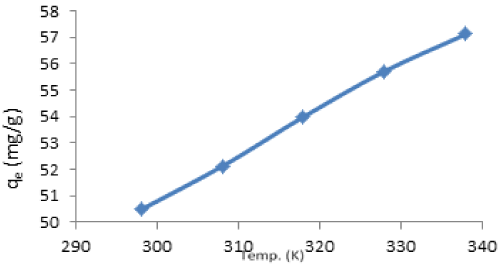
| Effect of temperature: The effect of temperature on biosorption of Cd(II) on vitellaria paradoxa was investigated under temperature range of 25°C-65°C. The temperature dependence of Cd(II) adsorption on vitellaria paradoxa is shown in Figure 11. |
| The extent of adsorption of both metals was found to increase with increase in temperature indicating that the process to be endothermic in nature. Increase in the removal of Cd(II) may be attributed to the increase in mobility of the metals' particles and the swelling of pore structure of the sorbed [42]. The percentage increase over the range of temperature used is 79.74-95.19% of Cd(II). The increase in sorption with temperature may further be attributed to either increase in number of active surface sites available for sorption on the adsorbent or due to decrease in the boundary layer thickness surroundings of the adsorbent; such that the mass transfer resistance of the adsorbate in the boundary layer decrease. |
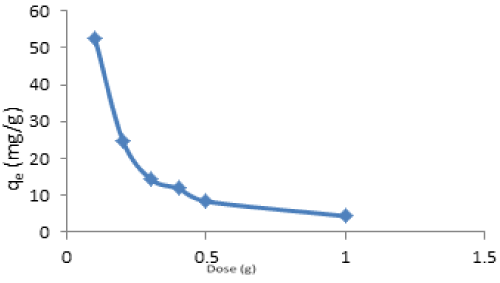
| Effect of adsorbent dose: The effect of various adsorbent doses on the quantity adsorbed at constant time of 30 minutes, initial metal ion concentration of 200 mg/L, and temperature 303 K is shown in Figure 12. |
| It is evident that the quantity adsorbed decreased with increase in adsorbent dose for adsorption of Cd(II) ions. The adsorption capacity of Cd(II) decreases from 52.42 mg/g at 0.1 g to 4.35 mg/g at 1.0 g. This decrease with increase in adsorbent dose may be due to the overcrowding of the adsorbent particles at the adsorption sites. That is the over-crowding of the adsorbent particles is increasing with increase in adsorbent dose. This effect has also been reported by Garg et al. [43], Quek et al. [44]. It may also be as a result of shielding of the binding sites by the screening effect of the dense outer layer of cells caused by the higher adsorbent dose [45]. However, the maximum percentage removal of 87.37% of Cd(II) was observed at 0.1 g. |
| Equilibrium study |
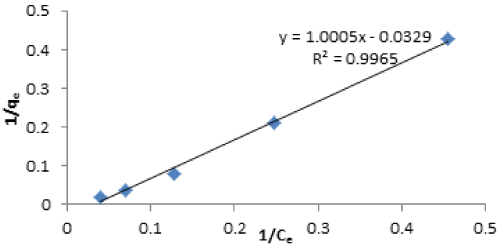
| Langmuir isotherm: The Langmuir isotherm in linear form is given as: |
 (2) (2) |
| where Ce is the equilibrium concentration (mg/L), qe is the amount adsorbed at equilibrium (mg/g), qmax is the maximum amount of adsorption with complete monolayer coverage on the adsorbent surface (mg/g) and KL is the Langmuir constant (L/mg) |
| The Langmuir adsorption isotherm model assumes that adsorption takes place at specific homogenous sites within the adsorption [46]. |
| The correlation coefficient of 0.996 was obtained of Cd(II) indicating monolayered adsorption. From the Langmuir isotherm parameters, qmax indicated higher adsorption capacity for Cd(II) ions. Langmuir equilibrium coefficient b, showed stronger interaction between Cd(II) and vitellaria paradoxa. The larger value of b shows that the adsorption equilibrium is shifted towards the formation of the adsorbate-adsorbent complex. The small value of RL indicated that Langmuir isotherm is highly favourable. The value of RL indicates Langmuir isotherm to be either unfavourable, (RL>1), linear (RL=1) irreversible (RL=0) or favourable (0<RL<1). The experimental qm values of both metals were very close to the theoretical values calculated. |
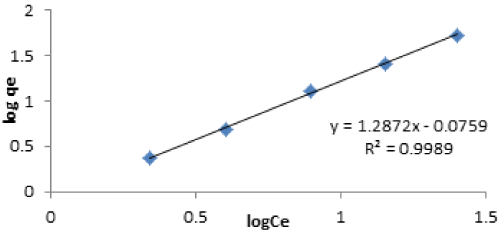
| Freundlich isotherm: The Freundlich sorption isotherm using the log-transformed form: |
| log qe=log Kf+1/nlog Ce (3) |
| This model represents an ideal situation, which does not include the possible saturation of the sorption sites. Where Kf is the Freundlich distribution coefficient related to the total adsorption capacity of the solid, and 1/n is the Freundlich sorption exponent. |
| The Freundlich isotherm model applies on the heterogenous surfaces interactions between the adsorbed molecules, and is not restricted to the formation of monolayer [47]. |
| The correlation coefficient of 0.998 was obtained; this signifies that the adsorption data used were well fitted with Freundlich isotherm. The results indicate that the Freundlich isotherm model showed that multilayer adsorption nature of Cd(II) ions. The adsorption intensity constant n, of Cd(II) is 0.77. The n value indicate that the nature of the adsorption favourable. |
| Kinetic study |
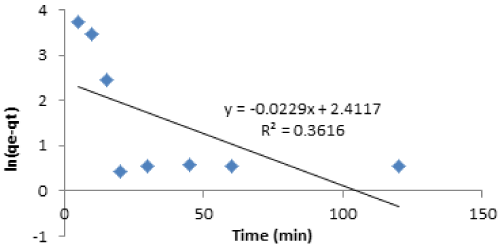
| For the adsorption kinetics studies, the pseudo-first order and pseudo-second order models was tested. The pseudo-first order mode has been expressed using this equation (Table 3). |
 (4) (4) |
| Where qe(mg/g) is the mass of adsorbate adsorbed at any time t and k(min-1) is the equilibrium rate constant of pseudo-first order adsorption. The values of k and qe are determined from the slope and intercept of the plot of log (qe-qt) versus t respectively. |
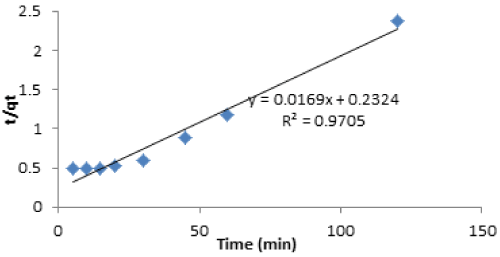
| The pseudo-second order model has been based on assumption that biosorption follows a second order mechanism. The rate of occupation of adsorption sites was described to be proportional to the square of the number of unoccupied sites. The equation can be expressed as |
 (5) (5) |
| where k2 is the pseudo-second order rate constant (g/mg/min). The value of qe is determined from the slope of the plot of t/qt versus t. |
| The kinetics of Cd(II) sorption onto vitellaria paradoxa was investigated using pseudo-first order and pseudo-second order kinetic models. The pseudo-first order plot shown in Figures 11 is linear with correlation coefficient of 0.361, but do not fulfill the essential condition of yielding the same value as given by experiment. The experimental value (qe) of Cd(II) was by far lower than the calculated. |
| The pseudo-second order model is based on the assumption that adsorption rate is proportional to the square of the number of unoccupied sites. The result obtained for the plot of pseudo-second order model represented better compared to the pseudo-first order kinetic model as shown in Figure 13. The pseudo-second order kinetic plot is of better linearity with correlation coefficient 0.97. |
| The comparison between experimental and theoretically calculated qe value was in good agreement. This showed that pseudo-second order kinetic fitted better than pseudo-first order kinetic for the removal of Cd(II) by vitellaria paradoxa. |
| Thermodynamics study |
| Thermodynamic study shows the effect of temperature on the sorption process. Generally, there are two common types: endothermal and exothermal sorption processes. If the sorption increases with increasing temperature, it means that the sorption is an endothermal process. Whereas the sorption decreases with increasing temperature, indicates the exothermal sorption process. The thermodynamic parameters such as free energy (ΔG0), enthalpy (ΔH0) and entropy changes (ΔS0) for the sorption are calculated using the following equations: |
| ΔG = −RT ln K (6) |
 (7) (7) |
| ΔG = ΔH −TΔS (8) |
| Where R is the ideal gas constant (kJ mol-1 K-1), K=Cads/Ceq and T is the temperature (K). ΔHº and ΔSº value can be obtained from the slope and intercept respectively of Van’t Hoff plots of In K versus 1/T [48]. |
| The data derived from the effect of temperature study were further used for the feasibility of the adsorption process of vitellaria paradoxa on Cd(II). The results obtained from the thermodynamics study are shown in Tables 4 and 5. |
| It could be observed that ΔH was positive for the system which confirmed the favorability of the process. The lower value of ΔH suggests that the adsorption process is likely to be physiosorption [49]. The positive value of heat of adsorption (ΔH) signifies an endothermic reaction. |
| The positive values of ΔS are an indication of an increased disorderliness and randomness at the adsorbent-sorbate interface and affinity for adsorbent material [50]. The Gibb’s free energy values indicated that the degree of spontaneity of the sorption process. The ΔG value of Cd(II) was negative, confirming the thermodynamic feasibility of adsorption of Cd(II) on Vitellaria paradoxa (Figures 14-20) [51]. |
| Conclusion |
| Activated carbon prepared from vitellaria paradoxa shell using otho-phosphoric acid has been used for the removal of Cd(II) ion from aqueous solution. Characterisation of the adsorbent revealed its sorptive characteristics. From the adsorption kinetics, the sorptive property of the vitellaria paradoxa shell was found to be dependent on concentration, dose, contact time and pH. The equilibrium adsorption data showed satisfactory correlation with the Langmuir adsorption and Freundlich. The kinetic study revealed that pseudo-second order kinetic was better fitted compared to first-order kinetic. Thermodynamic study revealed a spontaneousity of the process. |
References
|
Tables and Figures at a glance
| Table 1 | Table 2 | Table 3 | Table 4 | Table 5 |
Figures at a glance
 |
 |
 |
 |
 |
| Figure 1 | Figure 2 | Figure 3 | Figure 4 | Figure 5 |
 |
 |
 |
 |
 |
| Figure 6 | Figure 7 | Figure 8 | Figure 9 | Figure 10 |
 |
 |
 |
 |
 |
| Figure 11 | Figure 12 | Figure 13 | Figure 14 | Figure 15 |
 |
 |
 |
 |
 |
| Figure 16 | Figure 17 | Figure 18 | Figure 19 | Figure 20 |
Relevant Topics
- Anaerobic Biodegradation
- Biodegradable Balloons
- Biodegradable Confetti
- Biodegradable Diapers
- Biodegradable Plastics
- Biodegradable Sunscreen
- Biodegradation
- Bioremediation Bacteria
- Bioremediation Oil Spills
- Bioremediation Plants
- Bioremediation Products
- Ex Situ Bioremediation
- Heavy Metal Bioremediation
- In Situ Bioremediation
- Mycoremediation
- Non Biodegradable
- Phytoremediation
- Sewage Water Treatment
- Soil Bioremediation
- Types of Upwelling
- Waste Degredation
- Xenobiotics
Recommended Journals
Article Tools
Article Usage
- Total views: 14438
- [From(publication date):
May-2015 - Nov 21, 2024] - Breakdown by view type
- HTML page views : 9934
- PDF downloads : 4504
