Research Article Open Access
Single Drop Microextraction Analytical Technique for Simultaneous Separation and Trace Enrichment of Atrazine and its Major Degradation Products from Environmental Waters Followed by Liquid Chromatographic Determination
Alula Yohannes1, Tesfaye Tolesa1, Yared Merdassa1,2 and Negussie Megersa1*
1Department of Chemistry, Addis Ababa University, PO Box 1176, Addis Ababa, Ethiopia
2Department of Chemistry, Jimma University, PO Box 378, Jimma, Ethiopia
- *Corresponding Author:
- Negussie Megersa
Department of Chemistry, Addis Ababa University
PO Box 1176, Addis Ababa, Ethiopia
Tel: +251111243300/+251111239466
Fax: +251111239470
E-mail: megersane@ yahoo.com (or) negussie.megersa@aau.edu.et
Received date: July 18, 2016; Accepted date: July 25, 2016; Published date: August 01, 2016
Citation: Yohannes A, Tolesa T, Merdassa Y, Megersa N (2016) Single Drop Microextraction Analytical Technique for Simultaneous Separation and Trace Enrichment of Atrazine and its Major Degradation Products from Environmental Waters Followed by Liquid Chromatographic Determination. J Anal Bioanal Tech 7:330. doi:10.4172/2155-9872.1000330
Copyright: © 2016 Yohannes A, et al. This is an open-access article distributed under the terms of the Creative Commons Attribution License, which permits unrestricted use, distribution, and reproduction in any medium, provided the original author and source are credited.
Visit for more related articles at Journal of Analytical & Bioanalytical Techniques
Abstract
In this work, a method of single drop microextraction (SDME) combined with high performance liquid chromatography (HPLC) with diode array detection (DAD) was studied for trace level enrichment as well as simultaneous determination of atrazine (ATZ) and its major degradation products such as desethylatrazine (DEA) and desisopropylatrazine (DIA) in environmental waters. The main factors influencing the extraction procedure including types and volume of extraction solvent, sample stirring rate, sample solution pH, extraction temperature, extraction time, and salting out effect were optimized. The method detection limits were as low as 0.01 for ATZ and 0.05 for both DIA and DEA, with coefficients of determination better than 0.998 within a linear range of 0.5-150 μg L-1. Under the optimal conditions, the proposed method was applied for the analysis of real water samples and good spiked recoveries in the range of 65.6%-96.3% with relative standard deviation of less than 5% were obtained. The results confirmed that the proposed procedure provides reliable precision, linearity and sensitivity and is very effective for analyzing the target compounds in environmental waters. Therefore, the developed SDME method coupled with HPLC-DAD was found to be simple, inexpensive, and environmentally benign sample pretreatment technique.
Keywords
SDME technique; Trace enrichment; Environmentally benign; Atrazine; Degradation products; Environmental waters
Introduction
A pesticide is any substance or mixtures of substances, natural or synthetic, that has been used in agriculture to control or repel any pest that competes for food, affect the qualities and quantities of the yields and spreads disease [1,2]. The effective use of pesticides for agricultural purposes has improved the quality and quantity of food production. It has been estimated that about one-third of the crop production would be lost without the application of pesticide [3]. On the other hand, use of pesticides known to cause pollution in various environmental compartments such as air, soil, ground and surface water as well as serious risks to the aquatic lives and human health [4]. The increasing public concerns, in recent years, associated with the health risks because of the occurrence of pesticide residues led to strict regulations to be issued by the legislative bodies for the maximum residue limits (MRLs) in food commodities and drinking water [5].
Atrazine is one of the most commonly used herbicides, among the symmetrical (s-) triazine pesticides applied for the control of annual broadleaf and grassy weeds in maize, sugar cane, pineapples, nuts and non-crop areas [6]. It is also frequently used as a pre-emergent or early post-emergent herbicide and as a result its residues along with its major metabolites have been frequently detected in surface as well as ground waters [7]. Studies on toxicity of atrazine reported its toxic effects across the living species including the decrease in erythrocyte parameters, delayed sexual development and disrupting neuroendocrine system [8]. As a result of pesticide toxicities, the European Union (EU) legislation dictates the maximum admissible concentration of pesticides in drinking water to be 0.5 μg L-1 for the total pesticides and 0.1 μg L-1 for individual pesticide [9]. Therefore, in order to meet this and other similar regulations, development of highly sensitive and efficient analytical methods is very essential for accurate determination of trace level residues and metabolites of these harmful compounds [10].
Liquid–liquid extraction (LLE) is the classical method traditionally utilized for pesticide extraction from aqueous samples. However, the technique requires large quantities of expensive organic solvents and is time-consuming [11,12]. Although solid phase extraction (SPE) is consuming lesser time than LLE, it still requires some volumes of organic solvents for analytes elution step [13,14]. Besides their undesirable consequences to human health organic solvents are also known for being flammable and pollutant to the environment. These disadvantages have been the driving forces for critical need for developing analytical methods that either eliminate the use of organic solvents or at least minimize their requirements in sample preparation [15].
Solid-phase microextraction (SPME) is a solvent-free sample preparation method which eliminates the disadvantages associated with the use of conventional extraction methods but has inherent drawbacks related to the expensiveness of its fiber and limited lifetime [16]. Recently, different modes of liquid phase microextraction (LPME) were developed as a simple and benign method for sample preparation [17-20]. One mode of LPME is based on the distribution of the analytes between a microdrop of organic solvent at the tip of a microsyringe needle and aqueous sample solution and is termed as single drop microextraction (SDME). The technique combines extraction, preconcentration and sample introduction into a single step [20,21].
The use of a single drop as a collector of analytes in analytical chemistry can be traced back to the work of Liu and Dasgupta [22] in the mid-1990s. At present, there are seven different modes of SDME which could be categorized into either two-phase or three-phase modes; depending on the number of phases co-existing at equilibrium. Two-phase modes include direct immersion, continuous flow, drop-todrop and directly suspended droplet while three-phase modes consist of a headspace and liquid–liquid–liquid microextraction [23]. Since in direct immersion SDME the microdrop of the extracting solvent is in direct contact with the aqueous sample; the solvent being immiscible with water [24]. This mode of SDME is simple and thus considered to be suitable for quantitative extraction of the target analytes in this study, that have nonpolar or slightly polar properties, from environmental water samples.
The proposed method coupled with HPLC, which has not been considered in any earlier studies for simultaneous determination of atrazine and its major degradations from natural waters, was demonstrated to be a successful and promising sample preparation technique. Quantitative extraction of the degradation products, whose environmental fates are not fully understood, is not easy since the physical and chemical properties of the compounds greatly vary when they lose certain moieties from the parent compound. Even though other sample preparation methods are available, there are no reports for residual extraction of atrazine and its metabolites from environmental sample matrices simultaneously, based on single drop microextraction.
Experimental
Chemicals and reagents
Pesticide standards of atrazine, (ATZ) (98.4%); deethylatrazine, (DEA) (96%); and deisopropylatrazine, DIA (99%) used in this study, were purchased from Dr. Ehrenstorfer GmbH (Augsburg, Germany). Selected physicochemical properties of the target analytes are given in Table 1 [25,26]. All the standards were certified reference materials for residue analysis. HPLC grade methanol and acetonitrile, used as mobile phase in chromatographic analysis, were obtained from Acros organics (New Jersey, USA). Other chemicals; including hydrochloric acid, sodium hydroxide, sodium chloride and 1-octanol were the products of Sigma Aldrich Chemie (Steinheim, Japan). Ultrapure water (EASYpure LF) was used throughout and all other chemicals used were of analytical grade reagents, unless otherwise stated.
 |
|||||||
|---|---|---|---|---|---|---|---|
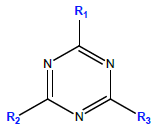
| Analyte | R1 | R2 | R3 | Mol. wt, g mol-1 |
Solubility, mg L-1 (22°C) |
Log Kowa | pKa |
| DIA | -Cl | -NH2 | -NH-CH2-CH3 | 173.60 | 3200 | 1.15 | 1.30-1.58 |
| DEA | -Cl | -NH-CH(CH3)2 | -NH2 | 187.63 | 670 | 1.52 | 1.30-1.65 |
| ATZ | -Cl | -NH-CH(CH3)2 | -NH-CH2-CH3 | 215.7 | 33 | 2.5 | 1.68 |
Table 1: Selected physicochemical properties of the target compounds, from Ref. [25,26].
Instrumentation
All chromatographic analyses were performed using Agilent Technologies® 1200 series HPLC, equipped with quaternary pump, Agilent 1200 series vacuum degasser, Agilent 1200 series thermostated autosampler and Agilent 1200 series Diode Array Detector (DAD). Chromatographic separations were performed on a reversed phase VPODS C18 column (150 mm × 4.6 mm I.D., particle size 5 μm) (Agilent Technologies, Germany). The entire units of the HPLC system were interfaced with a computer (Hp, Compaq, Intel® and Pentium 4 HT). The SDME was performed using a bevel shaped 100 μL GC microsyringe (Hamilton, Bonaduz, Switzerland). A S23-2 digital magnetic stirrer (Shanghai Sile Instrument Co., China) and a 5 mm stirring bar were used to stir the solution. All weighing operations were carried out using Analytical balance (Mettler Toledo, Mettler instrument AG, Switzerland). Ultrasonic bath (Decon F5100b, England) was used for degassing the mobile phases and ensuring complete dissolution of some standards. Water and mobile phases were filtered through 0.22 μm filter paper (Millipore, Germany).
Preparation of the standard solutions
A stock standard solution with concentration level of 100 mg L-1 was prepared by dissolving 2.5 mg of each analyte with methanol and transferred quantitatively into a 25 mL volumetric flask [13]. Finally, it was filled up to the mark with methanol. Intermediate standard solutions were also prepared from the stock solution by diluting with methanol. Working solution of 0.5 μg L-1 mixture were prepared daily by appropriate dilution of the stock solutions with ultrapure water. Extraction performances of the method were studied using the aqueous sample solutions that were prepared by spiking a known concentration of the analytes into the reagent water. Stock solutions of the analyte standards were stored in a refrigerator at 4C when not in use.
A series of solutions of the s-triazine standard mixture for calibration were prepared from the intermediate stock solutions in the concentration range of 0.1 mg L-1 ppm to 1.0 mg L-1, at five points, each day. Evaluation of the analytical results was based on five injections, in most cases, and peak areas were considered as instrumental responses.
Sample solution pH
The sample solution pH was appropriately varied in order to obtain the target analytes in deionized forms and thus facilitate their transfer into the microdrop. This was achieved by adding drops of 5 mM phosphate buffer into the sample solution containing the model analytes in order to obtain the sample solution pH ranged from 2.0 to 9.0 [25,27]. The phosphate buffers of different pH were prepared by varying the amounts of H3PO4, KH2PO4, and K2HPO4, following the reported literature information [27].
Procedure for single drop microextraction
For extraction of the target analytes, 5 mL of a salted (7.5% NaCl, w/v) aqueous sample solution spiked at a known concentration with all the target analytes was added to the 6-mL standard vials. The contents were then agitated with a magnetic stirrer by means of a stir bar. Before each extraction, the microsyringe was rinsed three times with methanol to ensure that no air bubbles are available in the barrel and the needle. After uptake of 3 μL of 1-octanol, the microsyringe needle was inserted through the septum and was immersed into the 5 mL sample solution. This was followed by fixing the needle with a stand and clamps assembled at the same height. Then, the microsyringe plunger was depressed to expose a 3 μL drop of 1-octanol to the sample solution. Thereafter, extraction was performed by stirring the sample solution for 20 min. The drop was then retracted back into the microsyringe and the needle was removed from the sample vial (Figure 1). Finally, the extract was directly injected into the HPLC system for quantitative analysis.

Figure 1: The procedure of single drop microextraction and chromatographic analysis of target analytes.
Chromatographic analysis
The mobile phase composed of water, methanol and acetonitrile (45:33:22, v/v/v) was prepared and degassed using ultra sonic bath for about 30 min. The degassed mobile phase was transferred to the HPLC system in isocratic mode and was delivered at a flow rate of 0.8 mL min-1. Detection of the analytes was performed at 223 nm. Under these chromatographic conditions, good baseline separation was obtained for all the target compounds. Data acquisition and processing were accomplished with the Chemstation software (Agilent Chemstation, Agilent Technologies®).
Collection of the water samples
In order to investigate the applicability of the proposed SDME technique, the target analytes were spiked into the water samples obtained from different localities. Tap water samples were obtained from the campus of the College of Natural Sciences, Addis Ababa University; Ababa, Ethiopia, located at latitude of 9°1’48’’N 38°44’24’’E. Surface water samples were collected from three sites around Ziway Lake (located 160 km south of Addis Ababa; having geographical locations of 8°00’N 38°50’E. The three lake water samples were obtained from the sites locally named: Cafeteria, Koroconch and Wafiko; that are found on the western, southern and northern extremes of the lake, respectively. Another water sample was also collected from Awash River (located 130 km from the capital, Addis Ababa; with geographical location of 8°55’12’’N 40°02’33.65’’E), while ground waters were sampled from selected bore holes located around Ziway town. Except for the tap water samples, all the remaining sampling sites are located within the Great Rift Valley of Ethiopia; where extensive agriculture and horticulture activities are taking place, every season.
Data analysis
In microextraction, the absolute amount of analyte extracted into the organic solvent is usually negligible compared to its total amount in the solution [28]. In other words, the numerical values of extraction efficiency are very small, and thus rather evaluated commonly, and also in this study, in terms of the concentration enrichment factor (EF). EF is defined as the ratio of the initial analyte concentration in the water sample and the enriched final analyte concentration in the organic phase.
Moreover, in order to study the applicability of the microextraction method for real sample analysis relative recovery was calculated. The relative recovery, which indicates the effect of sample matrix on extraction, is defined as the peak area ratio of the natural water sample to the ultrapure water sample spiked with analytes at the same concentration levels [29].
Results and Discussion
Optimization of chromatographic separation
In order to obtain the HPLC separation of the three compounds, different HPLC parameters including mobile phase and its flow rate as well as the wavelength of detection were optimized. The results of these experiments have demonstrated that the isocratic elution mode was found to be suitable in terms of analysis time, shape of peaks, and their reproducibility. Under the isocratic elution condition, the optimum separation of the target pesticides was obtained at the mobile phase composition of 45% water, 33% methanol, 22% acetonitrile. UV detection was employed in the range of 200-250 nm to attain the maximum UV absorption spectra of the analytes. It was found that at 223 nm all the target compounds exhibited maximum absorption. Similarly, the flow rate was also varied at 0.5, 0.8 and 1.0 mL min-1, and it was noted that 0.8 mL min-1 to be the optimum flow rate. Thus, the optimized chromatographic conditions were utilized in all the subsequent experiments.
Optimization of the SDME parameters
Analytes enrichment based on SDME technique may be influenced by a number of parameters including ionic strength, type and volume of extractant, extraction time, temperature, syringe needle depth, sample agitation rate, sample volume and pH [23,29]. Screening the most important parameters affecting the enrichment factor was carried out and effects of significant parameters, on the extraction efficiency of the analytes, have been investigated in the optimization procedures.
Selection of the extraction solvent: The type of organic solvent used in SDME is an essential parameter for establishment of the direct immersion SDME procedure [28,30]. Accordingly, the extraction solvent should be immiscible with water, have high partition ratio for analytes, miscible with the mobile phase of the HPLC and it should further have separate retention time from the analyte peaks in the chromatogram. Moreover, the solvent should ensure drop stability during long periods of stirring [31,32]. For this purpose, Toluene, hexane, cyclohexane and 1-octanol, differing in physicochemical properties; i.e., polarity, surface tension, water solubility, etc were evaluated for use as the extraction solvent.
Toluene, n-hexane and cyclohexane were found to be unsuitable, in this study, because of the difficulty to be held as microdrops at the tip of the microsyringe for the required length of time due to their low viscosity and density. In addition, for ionizable compounds such as atrazine and its degradation products, Table 1, a fairly polar extraction solvent would be the solvent of choice. In a series of experiments that were performed, 1-octanol, which is relatively polar, exhibited relatively stable microdrop at the needle tip during vigorous stirring and demonstrated better extraction efficiency, was the solvent of choice in the current study. Moreover, 1-octanol has also showed no chromatographic interference, i.e., having good chromatographic performances than the other three solvents. Therefore, it was selected to be used as a preferred extraction solvent for all the subsequent works.
Effect of microdrop volume: It was described in the SDME theory that the amount of analyte extracted by the drop is related to the volume of the drop, and accordingly the use of a large drop results in an increment of the analytical sensitivity [33]. To this end, the extraction solvent of different microdrop volumes was exposed to the spiked aqueous sample in order to evaluate the effect on the SDME efficiency. The analytes were rapidly extracted to the surface of the drop where the rate of extraction to the surface of the extracting medium is controlled by diffusion to the surface, i.e., the boundary layer, which is governed by the relative solubility of the analyte [34].
The solvent microdrop volumes were varied from 1 μL up to 3 μL (1.0, 2.0, 2.5, and 3.0). It was observed that the amount of analyte extracted increases with the drop volume, however, when the microdrop volume exceeded 3.0 μL, such microdrops were noted by lesser stability and lower reproducibility. The microdrop volume of 3.0 μL was found to be stable for the intended extraction and allowed the highest stirring rate. Therefore, a microdrop volume of 3.0 μL was considered to be the optimal value.
Effect of stirring rate: For the drop-based extraction techniques, a fresh interface between the aqueous samples and the extraction solvent can be consecutively generated by stirring [34]. Agitation of the sample solution enhances extraction while reducing the time required for the thermodynamic equilibrium. The effect of stirring rate on the SDME concentration enrichment was evaluated at four levels, i.e., 300, 400, 500, 600 rpm. Apparently, the extraction efficiency increased with the increase in the stirring rate. On the other hand, when the stirring rate exceeded 600 rpm, the organic microdrop was easily lost from the needle tip and affects the extraction performances.
According to the film theory of convective diffusive mass transfer [32], at stable state, the diffusion rate in the aqueous phase increases with increasing the stirring rate since faster agitation decreases the thickness of the diffusion film in the aqueous phase. The observations in this study are also consistent with the statements of the film theory. It was also observed that at higher stirring speed, the volume of the organic drop was found to reduce, as a result of the possible solvent dissolution in the aqueous phase. Based on the reported facts [35] and the observations of this study, 600 rpm was selected as the optimum stirring rate.
Effect of extraction time: Mass transfer is a time-dependent process and the closer the system is to the equilibrium conditions, may also cause the rate to reduce [36]. For optimum repeatability of the analysis, it is necessary to choose the time at which equilibrium is attained between the microdrop extraction solvent and the sample solution. However, SDME is not an exhaustive extraction technique; although the maximum sensitivity is attained at equilibrium, complete equilibrium need not to be attained provided that extraction conditions are reproduced [37]. In this work, the effect of extraction time was studied at four intervals; i.e., 10, 15, 20, and 25 min. As can be seen from Figure 2, long extraction time could lead to high extraction efficiency of the analytes in the range of 10-20 min, whereas with further prolongation of the extraction time, 20-25 min, no further increment in the peak area was observed, as this may rather result in drop dissolution and high incidences of the drop losses, and thus 20 min was selected as the optimal extraction time.

Figure 2: Effect of the extraction time on the enrichment factor of SDME. Extraction conditions: extraction solvent, 1-octanol; microdrop volume, 3 μL; stirring rate, 600 rpm; extraction temperature, 25°C; salt concentration, 0%.
Effect of salt concentration: The presence of a salt is known to increase the ionic strength of the extraction solution and affect the solubility of organic analyte due to a salting out effect. Therefore, neutral salts are commonly added to the extraction processes primarily to reduce the solubility of the extracted compounds in water [38]. In this work, experiments were conducted to evaluate the effect of salt concentration on the extraction of the analytes by adding different quantities of NaCl varied from 2.5 to 15% (w/v). The results in Figure 3 demonstrated an initial increase, in extraction efficiency, with increased salt concentration, the maximum being reached at 7.5% (w/v), followed by a decrease in the extraction efficiency with further increase in the salt concentration (10-15%). The extra salt added may change the physical properties of the extraction film and thus reduces the diffusion rate of the analytes into the organic phase [39]. Moreover, target analytes could also participate in electrostatic interactions with the salt ions in solution, thereby decreasing the tendency for their movement into the organic phase. As a result, 7.5% NaCl (w/v) was chosen as the optimal salt concentration for the developed microextraction technique.

Figure 3: Effect of salt addition on the enrichment factor of SDME. Extraction conditions: extraction solvent, 1-octanol; microdrop volume, 3 μL; stirring rate, 600 rpm; extraction time, 20 min; extraction temperature, 25°C.
Effect of temperature: Generally, increase in temperature is usually associated with increase in extraction efficiency [40], which normally enhances the diffusion coefficient, and therefore affects partition coefficient of the analytes between the aqueous sample and organic extractant phase in SDME. In this experiment, the enrichment factor of the SDME from the spiked reagent water was studied at five different temperatures; namely, 25°C, 30°C, 35°C, 40°C and 45°C. Greater temperatures can promote mass transfer, thereby increasing the extraction efficiency and lowering extraction times. On the other hand, temperatures of 40°C and higher cause the solvent drop to be unstable due to overpressurization and bubble formation in the bulk solution. Therefore, a temperature of 35°C was considered as the optimum temperature for the subsequent extractions.
Effect of pH: The pH of the sample solution is one of the most important factors affecting the liquid phase microextraction, as it can significantly influence the form of the analytes in the aqueous phase and consequently its solubility and extractability [41]. In particular, extractability of the weak organic bases such as atrazine and its metabolites, considered in this study, depends on pH of the sample solution, Table 1 [25,42]. In this study, enrichment factor of the considered analytes exhibited increasing tendency with pH ranges of 2-4 and then the increase was noticed to be gradual up to pH 7.0. However, after the neutral pH, the enrichment factor started declining, Figure 4. The decreasing tendencies of the extractability beyond pH 7.0 may be attributed to the degradation of the target analytes [26]. Therefore, pH 7.0, where all the target compounds are deionized for efficient transfer into the extraction solvent, was chosen as the optimum sample solution pH for the subsequent studies. Similar observations have also been noted by other workers for compounds possessing similar chemical natures [25,43,44].

Figure 4: Effect of the sample pH on the enrichment factor of SDME. Extraction conditions: extraction solvent, 1-octanol; microdrop volume, 3 μL; stirring rate, 600 rpm; extraction time, 20 min; extraction temperature, 35°C; salt concentration, 7.5 % (w/v).
Validation of the proposed method
To evaluate the proposed direct immersion SDME method, important parameters confirming the performance characteristics such as precision, sensitivity and linearity were determined by extracting 0.5 μg L-1 spiked reagent water under the optimized conditions. Summary of the optimum conditions selected for the method were as follows: 3.0 μL of 1-octanol as the extraction solvent, 7.5% (w/v) NaCl salt addition, 20 minutes extraction time, stirring rate at 600 rpm, temperature of 35°C and neutral pH. The method validation was carried out at these optimum extraction conditions based on the ICH guidelines [45].
Precision study: The precision of the analytical method expresses the amount of scatter in the results obtained from multiple analyses of the homogeneous sample and the results calculated as the relative standard deviation (RSD). The intra-day and inter-day precision of the method was determined under optimal conditions by successive fivetime analysis of a 0.5 μg L-1 standard solution of the analytes and the RSDs were below 5% for all the studied target analytes. The figures of merit of the proposed method are given in Table 2.
| Analytes | RSD (%, n=5)a | RSD (%, n=5)b | LR (µg L-1)c | r2,d | LODe (µg L-1) | LOQf (µg L-1) |
|---|---|---|---|---|---|---|
| ATZ | 4.6 | 4.7 | 0.25��?150 | 0.9987 | 0.01 | 0.10 |
| DEA | 4.5 | 4.5 | 0.5��?150 | 0.9983 | 0.05 | 0.25 |
| DIA | 4.7 | 4.9 | 0.5��?150 | 0.9981 | 0.05 | 0.25 |
aIntra-day precision; bInter-day precision; cLinear Range; dCoefficient of determination; eLimit of Detection; fLimit of Quantification
Table 2: Figures of merit for the proposed SDME method.
Sensitivity: The sensitivity of the method is usually expressed in terms of the limit of detection (LOD) and limit of quantification (LOQ). The LOD is the lowest analyte concentration that can be detected but not necessarily quantified. The LOQ, on the other hand, is the lowest level or signal of the analyte in sample that can be accurately and precisely measured. The LOD and LOQ are calculated by consecutive analyses of chromatographic sample extracts with decreasing the amounts of the target compounds until a 3:1 and 10:1 signal to noise ratio was achieved, respectively. The LOD and LOQ determined in this study were found to be in the range of 0.01-0.05 μg L-1 and 0.1-0.25 μg L-1, respectively, as indicated in Table 2.
Linearity: The linearity of the analytical method is the ability to achieve test results that correspond directly to the concentration of the analyte in the samples within the range of the standard curve. For the purpose of quantitative analysis, calibration of the chromatographic system was carried out for each analyte in the linear range from the limit of detection to the highest probable concentration ranging over five orders of magnitudes. For all analytes the coefficients of determinations (r2) of the calibration curves were 0.998 or better, confirming good linearity in the concentration range of 0.25-150 μg L-1 for ATZ and 0.5-150 μg L-1 for DIA and DEA.
Application to real samples
The developed SDME method was applied for the analysis of target analytes in four environmental water samples including tap water, river water, ground water and lake water. None of the analytes were detected in the real samples. The result indicated that target analytes were not present or they were present at concentration level below method detection limit in the real water samples. The water samples were then spiked with the standards of the target analytes at 0.5 μg L-1 concentration level. The relative recoveries for all these four water samples are listed in Table 3. The relative recovery is defined as the peak area ratio of the natural water sample to the ultrapure water sample spiked with analytes at the same concentration levels [46]. The satisfactory relative recoveries, provided in Table 3, demonstrate that the matrix effect was not significant confirming reliable application of the proposed technique for environment water analysis.
| Methods | Analyte | LR (µg L-1) | LOD (µg L-1) | RSD (%) | r2 | Ref |
|---|---|---|---|---|---|---|
| ST–DLLME-HPLC | Atrazine, Prometryn, Propazine, Terbutryn | 10-400 | 0.6-2.33 | 1.85-8.80 | 0.993-0.997 | [31] |
| SFD-LPME-HPLC | Cyanazine, Simazine, Atrazine | 0.2-200 | 0.01-0.05 | 2.05-8.15 | �?0.998 | [32] |
| HF-LPME-HPLC | Deethylatrazine, Deisopropylatrazine, Atrazine | 2.5-200 | 0.5-0.1 | 3.5-4.7 | �?0.998 | [33] |
| DI-SDME-HPLC | Deethylatrazine, Deisopropylatrazine, Atrazine | 0.25-150 | 0.01-0.05 | 4.5-4.9 | �?0.998 | Current study |
Table 3: Comparison of the proposed direct immersed single drop microextraction with various modes of microextraction techniques developed for the determination of s-triazine herbicides and their degradation products in water samples.
Comparison with other reported methods
Representative liquid phase microextraction analytical techniques developed by other workers and applied for enrichment of the s-triazine herbicides in water samples were considered for comparison with the analytical technique proposed in this study as shown in Table 4. Two of the reported studies employed the DLLME techniques; in low-density extraction solvent [47] and using solidification of a floating drop [48] for enrichment of the parent s-triazine compounds. Both methods share the advantages of being simple, fast and virtually solvent free with the developed SDME technique. The results reported in these works are comparable with that of the current study, except for the LOD which was much lowered in this study. Moreover, only parent s-triazine analytes were considered in the earlier works [47,48], where simpler quantitative transfer of the analytes into the organic solvents used in DLLME, could be achieved [44].
| % Recovery | |||||
|---|---|---|---|---|---|
| Analytes | Tap Water | Ground Water | River Water | Lake Water | Reagent Water |
| ATZ | 93.3 | 85.8 | 84.3 | 81.1 | 96.3 |
| DEA | 91.8 | 84.4 | 83.3 | 73.3 | 94.8 |
| DIA | 92.6 | 85.1 | 71.5 | 65.6 | 95.1 |
Table 4: Summary of results of analysis of target analytes in spiked environmental water samples after SDME.
Further comparison of the results of the current study was also made with another work [49], where the same target analytes have been enriched employing hollow fiber-protected liquid-phase microextraction technique (HF-LPME). Besides the requirements for short extraction time, other analytical performance characteristics, including the linear range and LOD, were greatly improved in the current study. In addition, the simplicity and convenience of the developed method makes it preferable. In general, the high enrichment factor obtained and the corresponding analytical performances confirm the method to be reliable and promising alternative in trace level analysis of the target analytes and other trace pollutants of similar chemical natures in environmental waters.
Conclusions
In this study, analytical method based on direct immersion SDME has been developed for selective and quick extraction of trace quantities of the most commonly used pesticide; atrazine, and two of its major metabolites frequently, found in the environmental water samples. All the analytes considered were efficiently enriched, exhibiting good linear range which yielded LODs below those established by the European Directive. Both good quantitative performance and absence of matrix effect showed applicability of the method for trace enrichment of the target compounds in real sample analysis.
Therefore, it could be concluded that the developed direct immersion SDME sample preparation method is simple and effective to measure residual amounts of atrazine and its degradation products in environmental water samples. Moreover, it is one of the miniaturized modes of LPME that is virtually solvent free, requiring fraction of a drop of organic solvent, and thus recognized as an environmentally benign. As a result, it can be considered as a preferable method for the analysis of target analytes, and also of other pollutants, occurring in contaminated environmental water samples, possessing similar chemical behaviors.
Acknowledgments
The authors would like to express their gratefulness to the Department of Chemistry of the Addis Ababa University for provision of the required research facilities. Financial support from the International Science program (ISP) through the ��?Trace Level Pollutants Analysisˮ project (ETH:04) is gratefully acknowledged. Fruitful discussions held with the senior research staff of the Analytical lab should also receive our deepest appreciations.
References
- Pinto MI, Sontag G, Bernardino RJ, Noronha JP (2010) Pesticides in water and the performance of the liquid-phase microextractin based techniques. Microchemical Journal 96: 225-237.
- Fei Y, Zhaoyang B, Xiaoshui C, Sansan L, Yang L, et al. (2014) Analysis of 118 Pesticides in Tobacco after Extraction With the Modified QuEChRS Method by LC-MS-MS. Journal of Chromatographic Science 52: 788-792.
- Tadeo JL (2008) Analysis of pesticides in Food and Environmental Samples. CRC Press, Boca Raton, NY,USA, pp: 2-34.
- Megersa N, Solomon T, Jonsson JA (1999) Supported liquid membrane extraction for sample work up and pre-concentration of methoxy-s-triazine herbicides in a flow system. Journal of Chromatography A 830: 203-207.
- EC (European commission) (2010) Maximum levels for certain pesticides in or on certain products. Official Journal of European Community 129: 3-9.
- Gast A (1970) Use and performance of triazine herbicides on major crops and major weeds throughout the world.Residue Review 32: 11-18.
- Michael ES, Susan VO(2000) Extraction of Atrazine and Its Metabolites Using Supercritical Fluids and Enhanced-Fluidity Liquids.Journal of Chromatographic Science 38: 399-408.
- Jiang H, Adams C, Graziano N, Roberson A, McGuire M (2006) Occurrence and removal of chloro-s-triazines in water treatment plants. Environmental Science and Technology 40: 3609-3616.
- EC (European commission) (1998) The quality of water intended for human consumption. Official Journal of European Community 330: 32-54.
- EC (European commission) (2009) Technical specifications for chemical analysis and monitoring of water status. Official Journal of European Community 201: 36-45.
- MaharaBM, Borossay J, Torkos K (1998) Liquid-liquid extraction for sample preparation prior to gas chromatography and gas chromatography-mass spectrometry determination of herbicide and pesticide compounds. Microchemical Journal 58: 31-38
- Majzik-Solymos E, Visi E, Karoly G, Beke-Berczi B, Györfi L(2001) Comparison of extraction methods to monitor pesticide residues in surface water. Journal of Chromatographic Science39: 325-331.
- Jiang H, Adams C, Koffskey W(2005) Determination of chloro-s-triazines including didealkylatrazine using solid phase extraction coupled with gas chromatography-mass spectrometry.Journal of Chromatography A 1064: 219-226.
- do Amaral B, de Araujo JA, Peralta-Zamora PG, Nagata N (2014) Simultaneous determination of atrazine and metabolites (DIA and DEA) in natural water by multivariate electronic spectroscopy. Microchemical Journal 117: 262-267.
- Ho TS, Pedersen BS, Rasmussen KE (2002) Recovery, enrichment and selectivity in liquid-phase microextraction, comparison with conventional liquid-liquid extraction. Journal of Chromatography A 963: 3-17.
- François P, Jacques E (2006) Determination of frequently detected herbicides in water by solid-phase microextraction and gas chromatography coupled to ion-trap tandem mass spectrometry. Analytical and Bioanalytical Chemistry 386: 1449-1456.
- Gang S, Hian KL(2002) Hollow fiber-protected liquid-phase microextraction of triazine herbicides. Analytical Chemistry74: 648-654.
- Ru-Song Z, Chun-Peng D, Xia W, Ting J, Jin-Peng Y (2008) Rapid determination of amide herbicides in environmental water samples with dispersive liquid-liquid microextraction prior to gas chromatography-mass spectrometry. Analytical and Bioanalytical Chemistry 391: 2915-2921.
- dos Anjos JP, de Andrade JB (2015) Simultaneous determination of pesticide multiresidues in white wine and rosé wine by SDME/GC-MS. Microchemical Journal 120: 69-76.
- Kokosa JM (2015) Recent trends in using single drop microextraction and related techniques in green analytical methods. Trends in Analytical Chemistry 71: 194-204.
- Bagheri H, Khalilian F (2005) Immersed solvent microextraction and gas chromatography-mass spectrometric detection of s-triazine herbicides in aquatic media. Analytica Chimica Acta 537: 81-87.
- Liu H, Dasgupta PK (1996) Analytical chemistry in a drop, solvent extraction in a microdrop. Analytical Chemistry 68: 1817-1821.
- Jeannot MA, Przyjazny A, Kokosa JM (2010) Single drop microextraction development, application and future trends. Journal Chromatography A 1217: 2326-2336.
- Xu L, Basheer C, Lee HK (2007) Developments in single-drop microextraction. Journal of Chromatography A 1152: 184-192.
- Megersa N, Jonsson JA(1998)Trace enrichment and sample preparation of alkylthio-s-triazine herbicides in environmental waters using a supported liquid membrane technique in combination with high-performance liquid chromatography. Analyst123:225-231.
- Esser HO, Dupius G, Vogel C, Marco GJ (1976) S-Triazines. In Herbicides: chemistry, degradation and mode of action. Marcel Dekker, New York, NY, USA, pp: 130-208.
- Christian GD, Purdy WC (1962)The residual current in orthophosphate medium.Journal of Electroanalytical Chemistry3: 363-367.
- Wei G, Li Y, Wang X (2008) Comparison of efficiencies between single-drop microextraction and continuous-flow microextraction for the determination of methomyl in natural waters. International Journal of Environmental Analytical Chemistry 88: 397-408.
- Pinheiro A, da Rocha GO, de Andrade JB (2011) A SDME/GC-MS methodology for determination of organophosphate and pyrethroid pesticides in water. Microchemical Journal 99: 303-308.
- Jianfeng Y, Cuiying Z, Fayun C, Yingying C, Fazle S, et al. (2015) A Simple, Rapid and Eco-Friendly Approach for the Analysis of Aromatic Amines in Environmental Water Using Single-Drop Microextraction-Gas Chromatography. Journal of Chromatographic Science53:360-365.
- Liang P, Guo L, Liu Y, Liu S, Zhang T (2005) Application of liquid-phase microextraction for the determination of phoxim in water samples by high performance liquid chromatography with diode array detector. Microchemical Journal 80: 19-23.
- Ye C, Zhoua Q, Wang X (2007) Improved single-drop microextraction for high sensitive analysis. Journal of Chromatography A 1139: 7-13.
- He Y, Lee HK (1997) Liquid-phase microextraction in a single drop of organic solvent by using a conventional microsyringe. Analytical Chemistry 69: 4634-4640.
- Zhao L, Lee HK (2001) Application of static liquid-phase microextraction to the analysis of organochlorine pesticides in water. Journal of Chromatography A 919: 381-385.
- dos Anjos JP, de Andrade JB (2014) Determination of nineteen pesticides residues (organophosphates, organochlorine, pyrethroids, carbamate, thiocarbamate and strobilurin) in coconut water by SDME/GC-MS. Microchemical Journal 112: 119-126.
- Jeannot MA, Cantwell FF (1997) Mass transfer characteristics of solvent extraction into a single drop at the tip of a syringe needle. Analytical Chemistry 69: 235-239.
- Jeannot MA, Cantwell FF (1996) Solvent microextraction into a single drop. Analytical Chemistry 68: 2236-2240.
- Edmar M, Dilma B, Eduardo C (2007) Application of fractional factorial experimental and Box Behnken designs for optimization of single-drop microextraction of 2,4,6-trichloroanisole and 2,4,6-tribromoanisole from wine samples. Journal of Chromatography A 1148: 131-136.
- Xiao Q, Hu B, Yu C, Xia L, Jiang Z (2005) Optimization of a single-drop microextraction procedure for the determination of organophosphorous pesticides in water and fruit juice with gas chromatography-flame photometric detection. Talanta 69: 848-855.
- Subhrakanti S, Rajib M, Bidhan CR (2013) A rapid and selective method for simultaneous determination of six toxic phenolic compounds in mainstream cigarette smoke using single-drop microextraction followed by liquid chromatography-tandem mass spectrometry. Analytical and Bioanalytical Chemistry 405: 9265-9272.
- Chimuka L, Megersa N, Norberg J, Mathiasson L, Jonsson JA (1998) Automated liquid membrane extraction and trace enrichment of triazine herbicides and their metabolites in environmental and biological samples.Analytical Chemistry70: 3906-3911.
- Jonsson JA, Lovkvist P, Audunsson G, Nilve G (1993) Mass transfer kinetics for analytical enrichment and sample preparation using supported liquid membranes in a flow system with stagnant acceptor liquid.Analytica Chimica Acta 277: 9-24.
- Larsson N, Berhanu T, Megersa N, Jonsson JA(2011) An automatic field sampler utilising supported liquid membrane (SLM) for on-site extraction of s-triazine herbicides and degradation products: applied to an agricultural region of Ethiopia.International Journal of Environmental Analytical Chemistry 91: 929-944.
- Megersa N, Chimuka L, Solomon T, Jonsson JA(2001) Automated liquid membrane extraction and trace enrichment of triazine herbicides and their metabolites in environmental and biological samples. Journal of Separation Science 24: 567-576.
- ICH (2005) Harmonized Tripartite Guideline Validation of Analytical Procedures. Text and Methodology.
- Leihong G, Jing Z, Haihong L, Jingbin Z, Yiru W, et al. (2013) Determination of bisphenol A in thermal printing papers treated by alkaline aqueous solution using the combination of single-drop microextraction and HPLC.Journal of Separation Science361: 298-1303.
Relevant Topics
Recommended Journals
Article Tools
Article Usage
- Total views: 14333
- [From(publication date):
October-2016 - Jul 15, 2025] - Breakdown by view type
- HTML page views : 13226
- PDF downloads : 1107