Research Article Open Access
Shoreline Change Monitoring in Nellore Coast at East Coast Andhra Pradesh District Using Remote Sensing and GIS
Kannan R, Ramanamurthy MV and Kanungo A*Andhra Pradesh Space Application Centre, Hyderabad
- *Corresponding Author:
- Kanungo A
Scientist-SE, Andhra Pradesh
Space Application Centre
Hyderabad, India
Tel: 09940766740
E-mail: abrankashkanungo@gmail.com
Received Date: December 12, 2015; Accepted Date: January 05, 2016; Published Date: January 15, 2016
Citation: Kannan R, Ramanamurthy MV, Kanungo A (2016) Shoreline Change Monitoring in Nellore Coast at East Coast Andhra Pradesh District Using Remote Sensing and GIS. J Fisheries Livest Prod 4:161. doi:10.4172/2332-2608.1000161
Copyright: © 2016 Kannan R, et al. This is an open-access article distributed under the terms of the Creative Commons Attribution License, which permits unrestricted use, distribution, and reproduction in any medium, provided the original author and source are credited.
Visit for more related articles at Journal of Fisheries & Livestock Production
Abstract
The shoreline is one of the most important features on earth’s surface. They are highly dynamic and ever changing. Changes are over time scales including minutes, hours, decades and Centuries. Spatial scales vary from local to regional to worldwide. Although change is continuously occurring, it doesn’t occur in a constant manner. Many factors influence these changes including the type of shoreline (rocky, sandy), wave activity, tidal variations, storms and human impacts. The shoreline change study is necessary for updating the shoreline change maps and management of natural resources. Shorelines are the key element in coastal GIS and provide the most information on coastal landform dynamics. The frequently monitoring coast only to accesses variation of shoreline changes. In this paper investigate the shoreline changes of Nellore district in Andhra Pradesh coast, as well as find the quantity of the erosion and accretion rate. Using multi-temporal resolution satellite data (TM & LISS III, IV) and Geographic information system (GIS) for past 25 years period i.e., from 1989 to 2015. Nellore having length of coast line is 167 km for this study used. The resultant coastal maps were used to estimate the geomorphologic changes and shifting of the shoreline position. This integrated study is found useful for exploring accretion and erosion processes in the region. About 87.6 km of coastline was found to be accreting nature with average of +1.40 m/yr followed by 38.4 km of coastal line eroding with average of -1.36 m/yr and stable coastline of 41.4 km was found. This study demonstrates that combined use of satellite imagery and statistical method such as linear regression for shoreline change analysis are helpful for erosion monitoring and preventive measure.
Keywords
ERDAS; LISS IV; Shoreline change; Erosion; Accretion; Linear Regression; DSAS
Introduction
The world’s coastlines are dynamic. Even shorelines that are in equilibrium undergo advancement towards the Sea or recession towards the land which is very often due to Man’s intervention through construction of structures as a part of different activities in coastal zone [1]. The above said phenomena may also be due to nature. Either of the phenomena, like closing of river mouths and net coastal erosion poses a great challenge in its conservational and management [2]. Shoreline change is an issue of concern in coastal management. Shoreline is idealistically defined as the interface of land and water [3], it is considered one of the most dynamic processes in the coastal area, beaches are among the most dynamic systems in nature, they show visible changes over hours, days, months and years. Coastline retreat has resulted in over 70% of the world’s beaches experiencing coastal erosion [4]. The erosion trend is expected to increase under the scenario of rising sea level as a result of climate change [5]. However, the coastal zone is increasingly under pressure from human activities such as fishing, coral and sand mining, mangrove harvesting, seaweed farming, sewage disposal, urban expansion and tourism [6]. Coastal zone supports many different types of livelihood that are sometimes at odds with each other. Fishing, tourism, manufacturing, farming, and other industries are all very important to the coastal areas, but without proper planning, damaging conflicts can emerge that can destroy the very resources that support these economic activities[7].
Coastlines are dynamic in nature. Accurate mapping of the instantaneous coastline position has as a result been always associated with significant uncertainty [8]. This situation arises because at any particular time the coastline position is influenced by the short-term effects of tide and long term relative sea level rise. It is also controlled by the actions of rip and long shore currents, which results in cross-shore and alongshore sediment movement respectively in the littoral zone [9]. This affects the accuracy of computed historic rates of change and therefore the reliability of any identified erosion ‘hotspots’. The science of coastline mapping has changed over the past 70 years due to advances in technology and the need to reduce uncertainty [1]. Although the changes have resulted in improvement in coastal data processing and storage capabilities, the frequent change in technology has prevented the emergence of a standard method of coastline mapping [10]. Remote sensing data could be used effectively to monitor the changes along the coastal zone including shoreline with reasonable accuracy. Remote sensing data helps and replaces the conventional survey by its repetitive and less cost-effectiveness [11].
Study Area
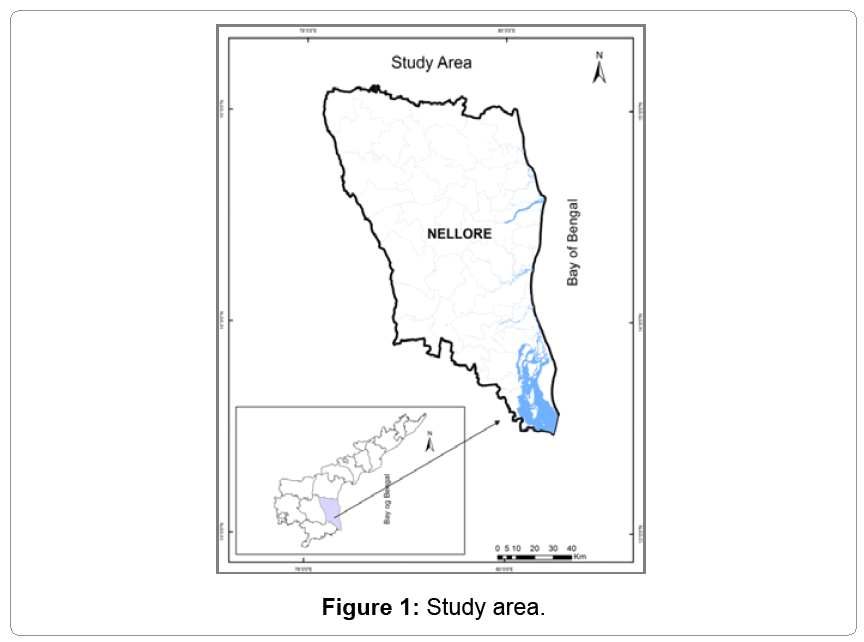
The State of Andhra Pradesh is strategically located in the Indian subcontinent. The length of Nellore coast line is 167 km. It is located on the banks of the Penner River and is well known for its aquaculture and agricultural produce. Nellore is located at 14.43°N 79.97°E. Rainfall in Nellore occurs between the months of October and December due to the north-east monsoon (Figure 1). This period gives about 60% of the city's annual rainfall. Cyclones are common in the city during this period, causing floods.
Materials
This study is carried out using Multi-Resolution satellite data of Landsat and IRS series such as, Landsat TM and IRS P6. These datasets were acquired on cloud free days of different dates over the chosen period (1989 to 2015). (As same resolution data is not available for the desired period) the multi temporal capabilities allow tracking of changes over time. Survey of India (SOl) toposheet (1:50,000 scale) are used for preparing base map.
Methodology
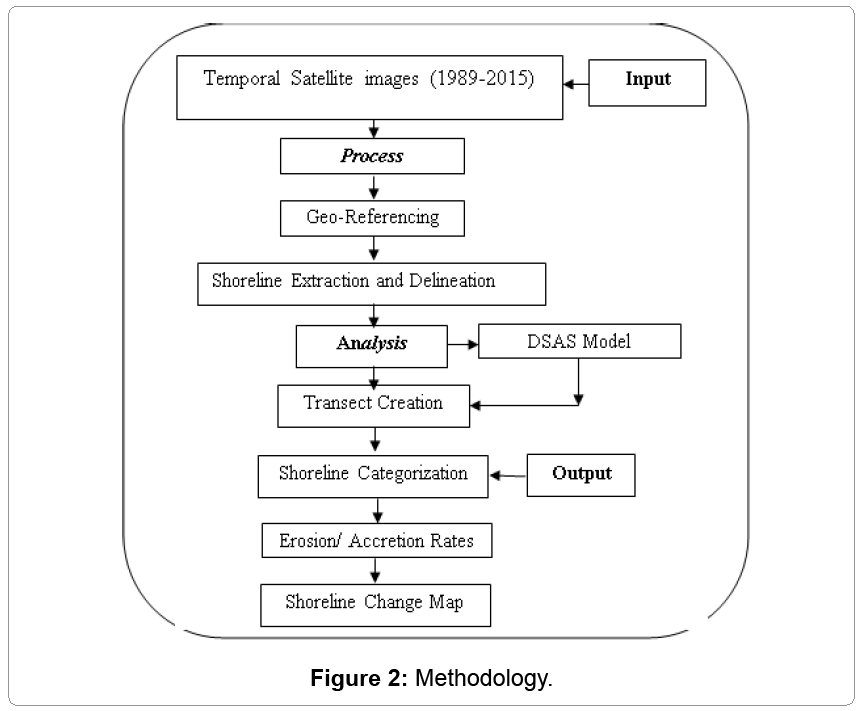
Multi-resolution satellite data such as Landsat TM, IRS of different dates have been acquired, as same resolution data is not available over the chosen period (Table 1). Estimation of the rates of erosion and Accretion along the Nellore coast is performed for the studied periods (Figure 2).
| Sensor | Spatial resolution | Year | Month | Source |
|---|---|---|---|---|
| Landsat 5TM | 28.5 | 1989 | November | USGS |
| IRS 1C - LISS III | 23.5 | 1999 | January | NRSC |
| IRS-P6 LISS III | 23.5 | 2005 | February | NRSC |
| IRS-P6 LISS III | 23.5 | 2010 | January | NRSC |
| IRS-P6 LISS IV | 5.8 | 2012 | March | NRSC |
| Landsat 8 | 28.5 | 2015 | March | USGS |
Table 1: Data used.
Geo-referencing
The SOI toposheets are converted into image format and are rectified in such a manner that the spatial co-ordinates correspond to its geographic co-ordinates will have less RMS error and then the toposheets are resembled using cubic convolution method. The projection applied in this study is Geographic Lat/Long with spheroid Everest and datum WGS 84. The digital image is then registered using the resembled output of the toposheet to its corresponding geographic coordination. Accuracy of the geometrically corrected image is checked by overlaying the rectified toposheet over the digital data and swiping horizontally and vertically to check for shift in the corresponding field. First base map are prepared on 1:25/50,000 scales from SOI toposheet. It has been prepared on the basis of permanent control points such as transport network, forest boundary, tanks and settlements. The prepared base maps are overlaid and interpreted using the interpretation keys. The digital data are interpreted and classified by on-screen visual interpretation.
Shoreline extraction and delineation
Recent advancements in remote sensing and geographical information system (GIS) techniques have led to improvements in coastal Geo-morphological studies such as automatic and semiautomatic. The semi-automatic techniques are attractive, due to their cost-effectiveness, time consuming etc. The dry wet/boundary which approximates the high waterline (HWL) was extracted using semiautomatic and manual methods. Automatic shoreline delineation is a complex process due to the presence of water saturated zone at the land-water boundary [12]. In ArcMap, the extracted shorelines were overlaid on the satellite image. The high-water line (HWL) was therefore adopted since it was relatively easy to distinguish it on all the images as a wet/dry line. The output vector however consisted of other water/land boundaries such as those of creeks and lagoons and could not be directly used for change detection. To extract the target sections, the extracted vector shoreline were overlaid on the colour composites and used as guide to digitize the target shoreline. In this present study, the exact land-water boundary was obtained by using a nonlinear edge-enhancement technique; these operations were applied to the image data to produce an enhanced image output for subsequent visual interpretations. The enhancement techniques improve the feature exhibition and increases visual distinctions between features contained in a scene.
Digital shoreline analysis system (DSAS)
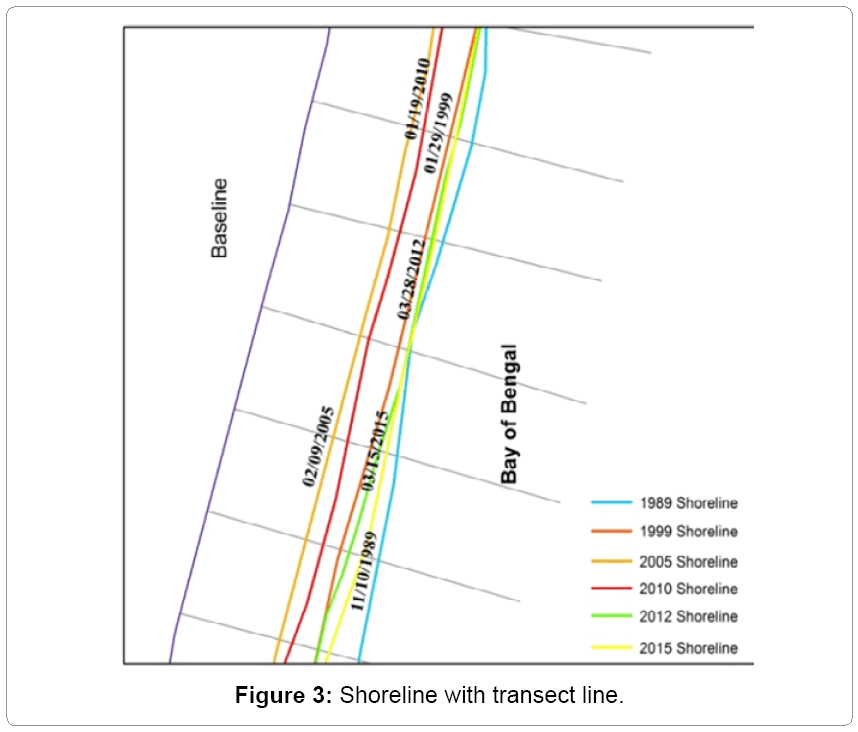
The Digital Shoreline Analysis System (DSAS 4.2) developed by the USGS [11] was used for rate estimation. The DSAS uses measurement baseline method to calculate rate of change statistics for a time series of shorelines. The baseline is constructed to serve as the starting point for all transects cast by the DSAS application. The DSAS is computer software that computes the rate of change statistics from multiple historic shoreline positions residing in GIS [11]. DSAS generates transects that are cast perpendicular to the baseline at a user specified spacing alongshore. The transect shoreline intersections along this baseline are then used to calculate the rate-of-change statistics [13]. Based on the settings DSAS, 1691 transects has been generated that are oriented perpendicular to the baseline at 100 m spacing and about 169.5 km along Nellore shoreline. DSAS 4.2 has 6 statistical approaches to compute changes. In this study, End Point Rate (EPR) and Linear Regression Rate (LRR) approaches were used. LRR uses all the available data to compute long term rate of changes. The EPR is calculated by dividing the distance of shoreline movement by the time elapsed between the oldest and the most recent shoreline (Figure 3). A LRR statistic can be determined by fitting a least-squares regression line to all shoreline points for a particular transect [11,14].
Results and Discussion
The shoreline change estimation was carried out for entire Nellore coast which is about 169 km in length. In this study, shorelines were extracted from satellite images for 1989, 1999, 2005, 2010, 2012 and 2015 by visually interpretation. The coastline rate of change was calculated using DSAS software and two different statistical techniques; End Point Rate (EPR) and Linear Regression Rate-of-Change (LRR). Base lines were constructed seaward and parallel to the general trend of the shorelines. Using DSAS transects were spaced 100 m apart. Rates of shoreline change were calculated at each transect using linear regression. As a result of the analyses, the most significant changes were observed at Nellore Coast. Summary statistics for the rate of change is given in Table 2. Shoreline changes are presented with an emphasis on shoreline erosion, because it is an important natural coastal risk along coastal wetlands. Tables 3 and 4 summarizes rates of shoreline classification Status and decadal changes, including both erosion and accretion. Coastal area land loss is arising primarily because of natural changes in the coastal system, and as a consequence of human activities such as agriculture, irrigation, reclamation and fisheries [15-20].
| Classification | Shoreline status (1989-2015)Km |
|---|---|
| Total Coast | 169 |
| Erosion | 38.4 |
| Accretion | 87.6 |
| Stable Coast | 41.4 |
Table 2: Shoreline status (1989-2015) along Nellore coats.
| Shoreline Classification | Status (1989-99) Km |
Status (1999-2005) Km |
Status (2005-10) Km |
Status (2010-12) Km |
Status (2012-15) Km |
|---|---|---|---|---|---|
| High Erosion | 2.9 | 32.1 | 17.9 | 83.2 | 55.6 |
| Medium Erosion | 17.2 | 44.1 | 15.9 | 7.8 | 22.4 |
| Low Erosion | 14.9 | 25.6 | 18.5 | 3.7 | 10.4 |
| Stable Coast | 13.2 | 14.6 | 13.1 | 2 | 7.9 |
| low Accretion | 26.4 | 15.5 | 20.7 | 3.3 | 9.2 |
| Medium Accretion | 48.1 | 24.5 | 39 | 7.2 | 17.2 |
| High Accretion | 43.3 | 10.5 | 40.1 | 57.5 | 41 |
Table 3: Shoreline classification and status along Nellore coast.
| Year | Erosion (m/Yr) | Accretion (m/yr) | Maximum (m/yr) | Minimum (m/yr) | Average (m/yr) |
|---|---|---|---|---|---|
| 1989-1999 | -2.59 | 4.3 | 28.19 | -34.7 | 2.62 |
| 1999-2005 | -4.47 | 3.79 | 36.8 | -49.23 | -1.68 |
| 2005-2010 | -4.38 | 5.34 | 47.91 | -48.11 | 1.83 |
| 2010-2012 | -15.3 | 11.57 | 72.64 | -142.48 | -4.08 |
| 2012-2015 | -7.01 | 13.43 | 143.35 | -83.47 | 7.73 |
Table 4: Long term shoreline change from EPR for 25 years using different interval of shoreline.
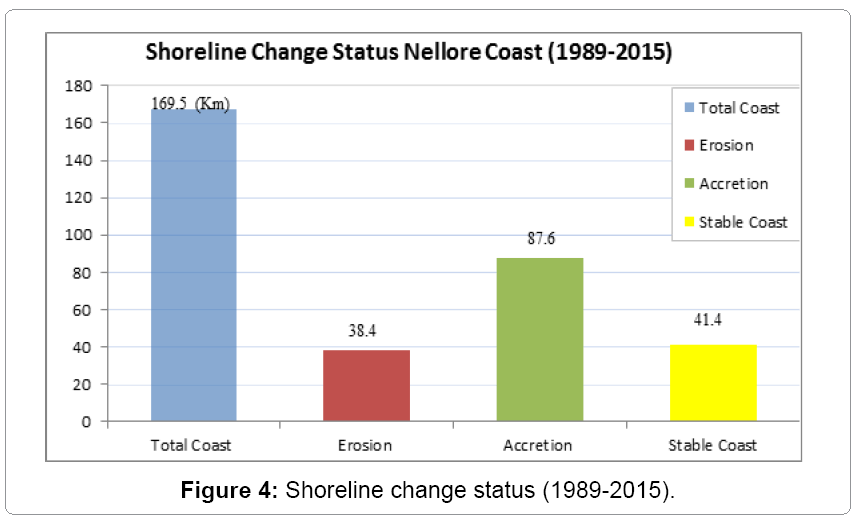
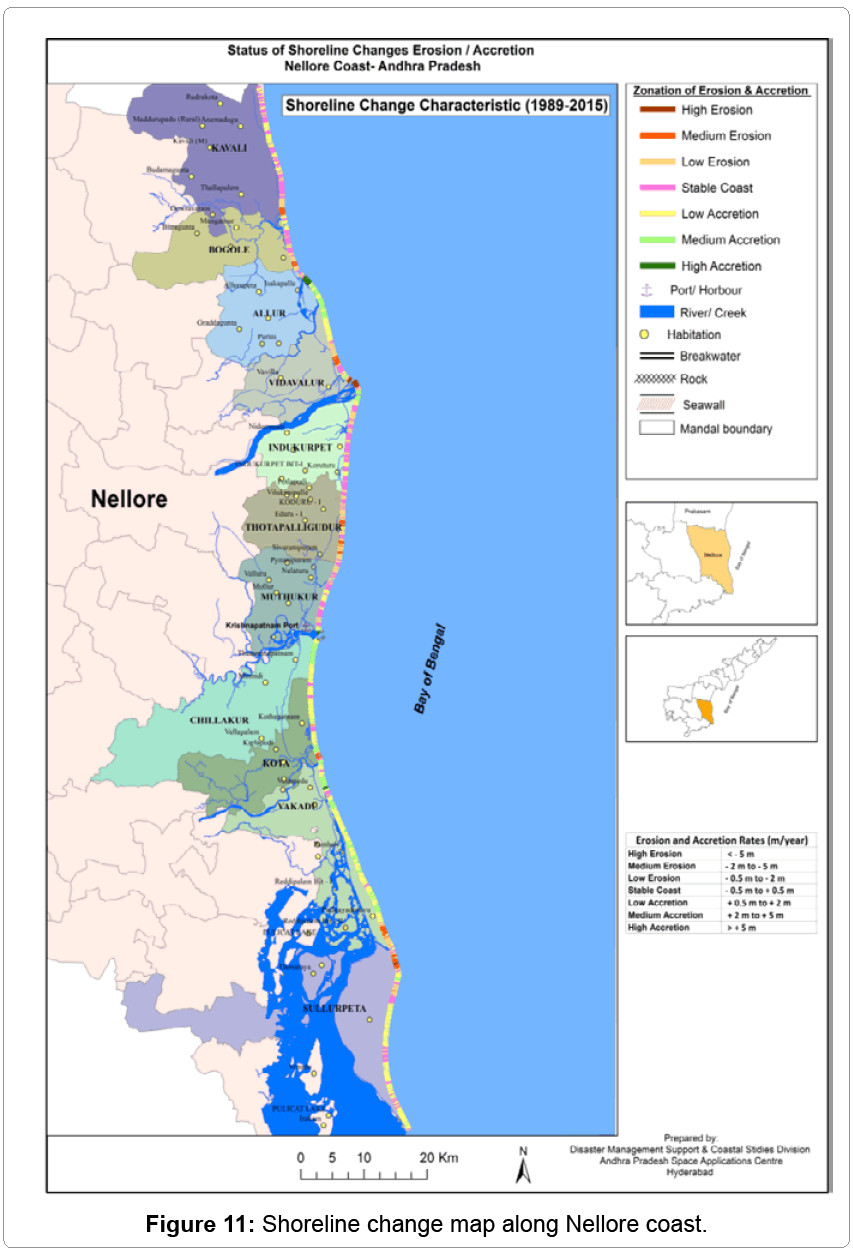
Figure 4 clearly shows the overall erosion and accretion status. The erosion and accretion was 87.6 km and 38.4 km noticed, Stable coast 41.4 km acquired along the Nellore Coast. The erosion and accretion pattern observed along the coast is influenced mainly by coastal process and reverie inputs. The variation in river mouth morphology was quite significant and changing rate were more all along the river mouth.
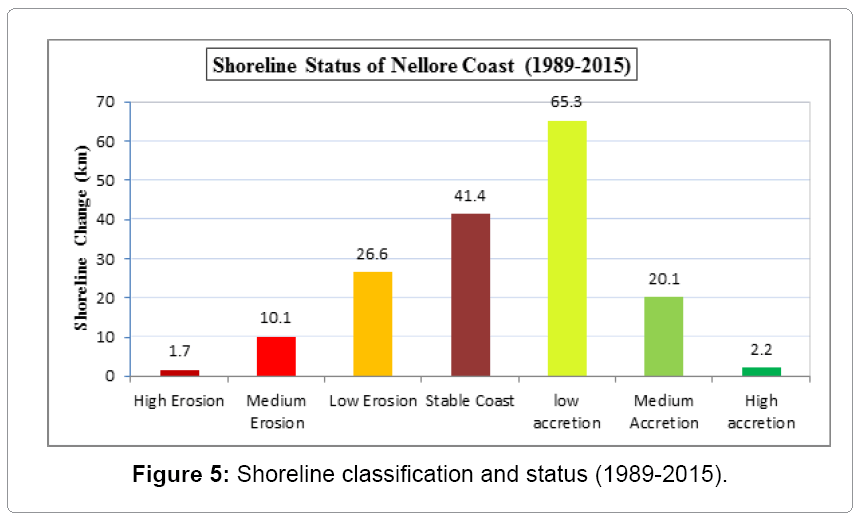
The above status is beach has classified seven type classifications, its start from high erosion, medium erosion, low erosion, stable coast, low accretion, medium accretion and high accretion. In the above classification range has been in between >-5 m to <5 m. Figure 5 has clearly shown high erosion to high accretion with length of the km affected in along the Nellore coast.
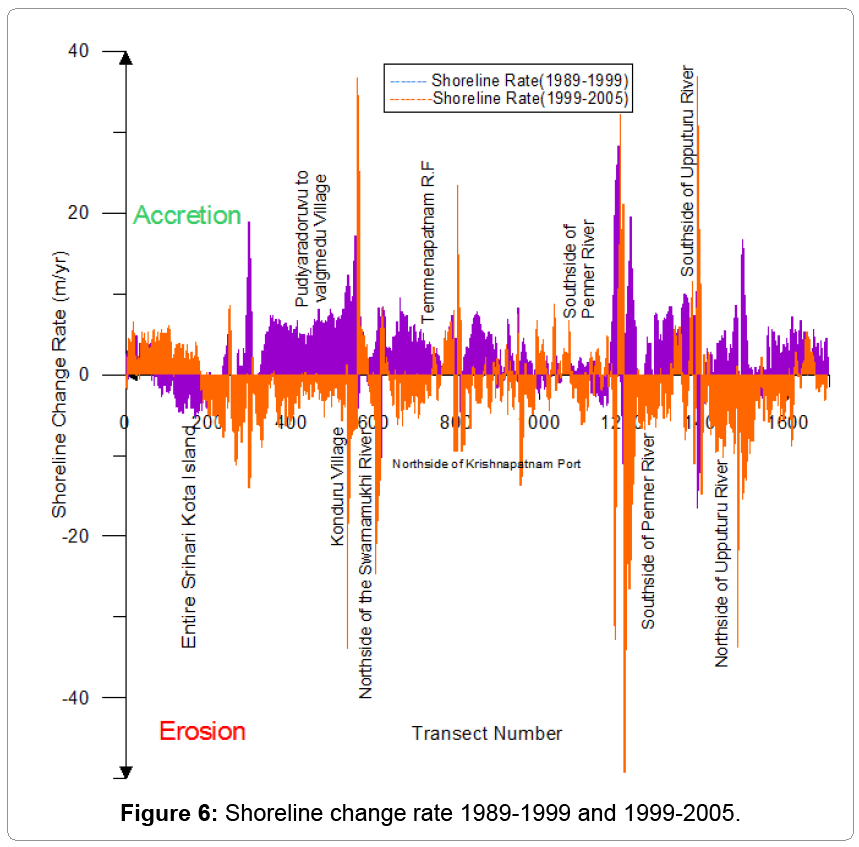
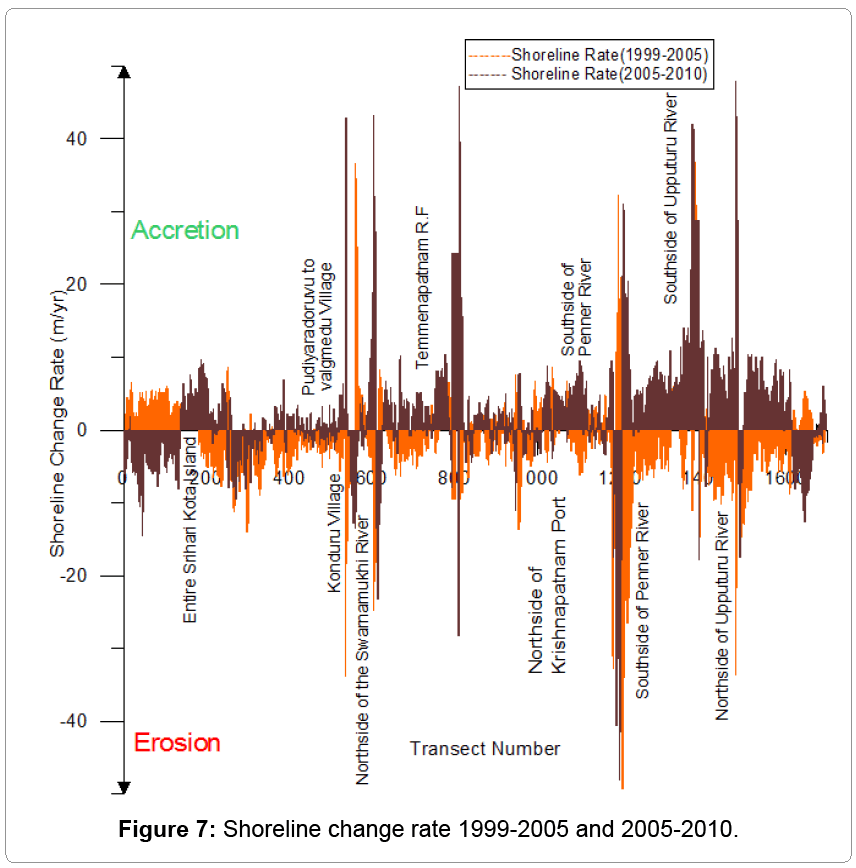
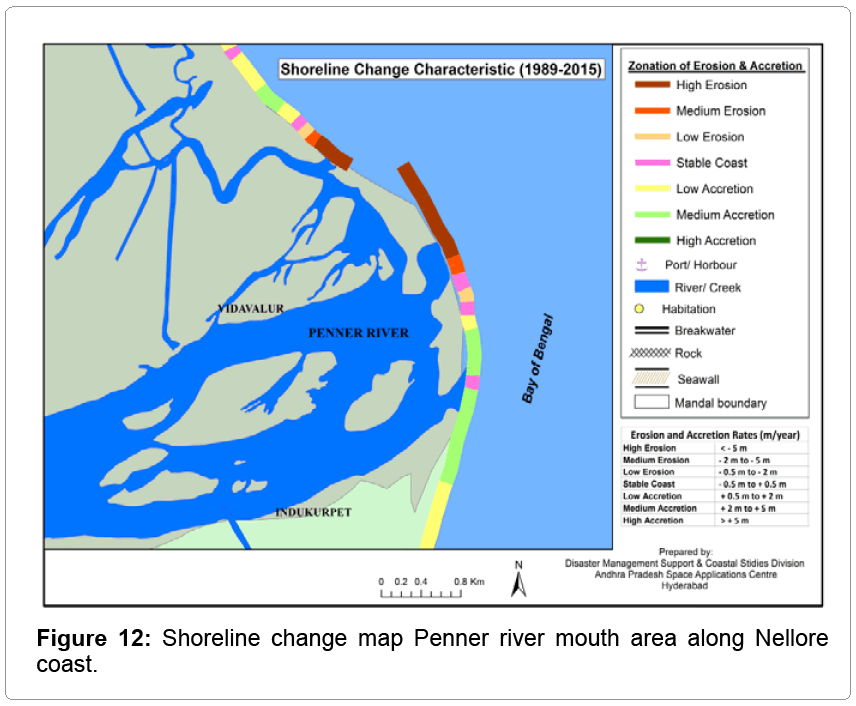
In the year of 1989 to 1999 average accretion rate is +4.29 m/yr and erosion rate -2.55 m/yr acquired in the Nellore coast (Figures 6 and 7). In the another decade of 1999 to 2005 had severe erosion happened in all alone the Nellore coast the average erosion had very high -4.47 m/ yr absorbed and accretion rate is 3.18 m/yr. In 1989 to 2005 mostly erosion happened in northside of Penner river mouth and upputuru river mouth areas.
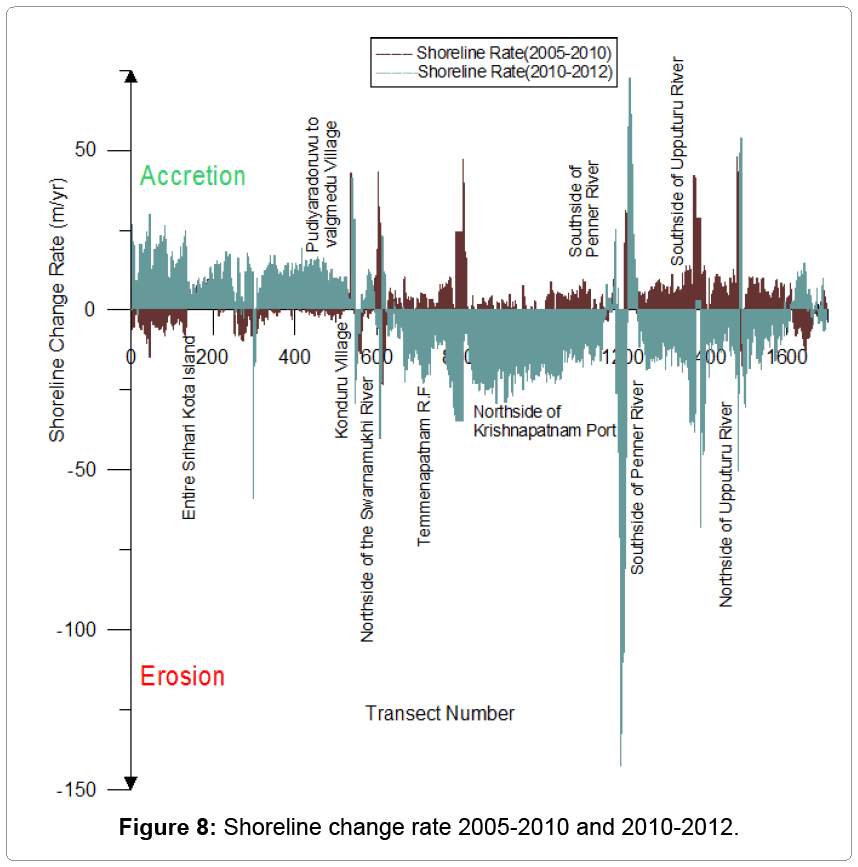
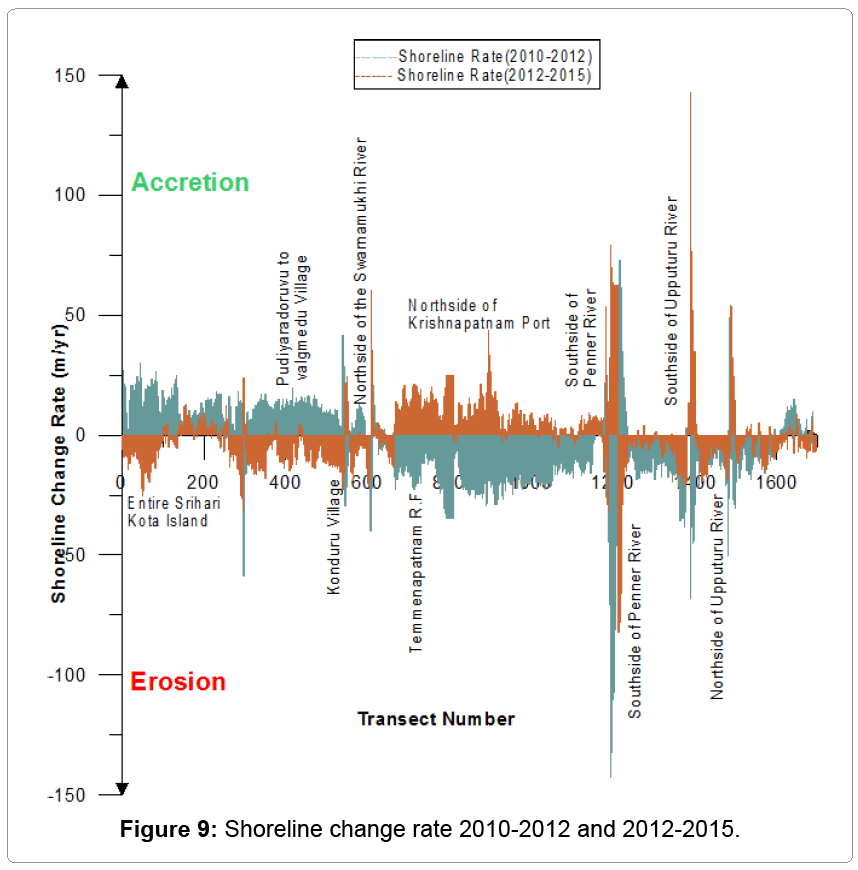
In the decade of 2005 to 2010 the average accretion rate is +5.34 m/ yr and erosion rate is - 4.37 m/yr acquired in the Nellore coast, same as of 2010 to 2012 had severe erosion happened in all alone the Nellore coast the average erosion has identify -15.30 m/yr engrossed and accretion rate is +11.60 m/yr. In the above decade of 2005 to 2012 has huge erosion acquired many places, because of some event happened all along the Nellore coast (Figures 8 and 9). In the year of 2010 to 2012 highest erosion happened nearly +140 m/yr in the past 2 years mainly north side of krishnapatnam port, Northside of penner river and upputuru river mouth areas accretion had sriharikota [21-27].
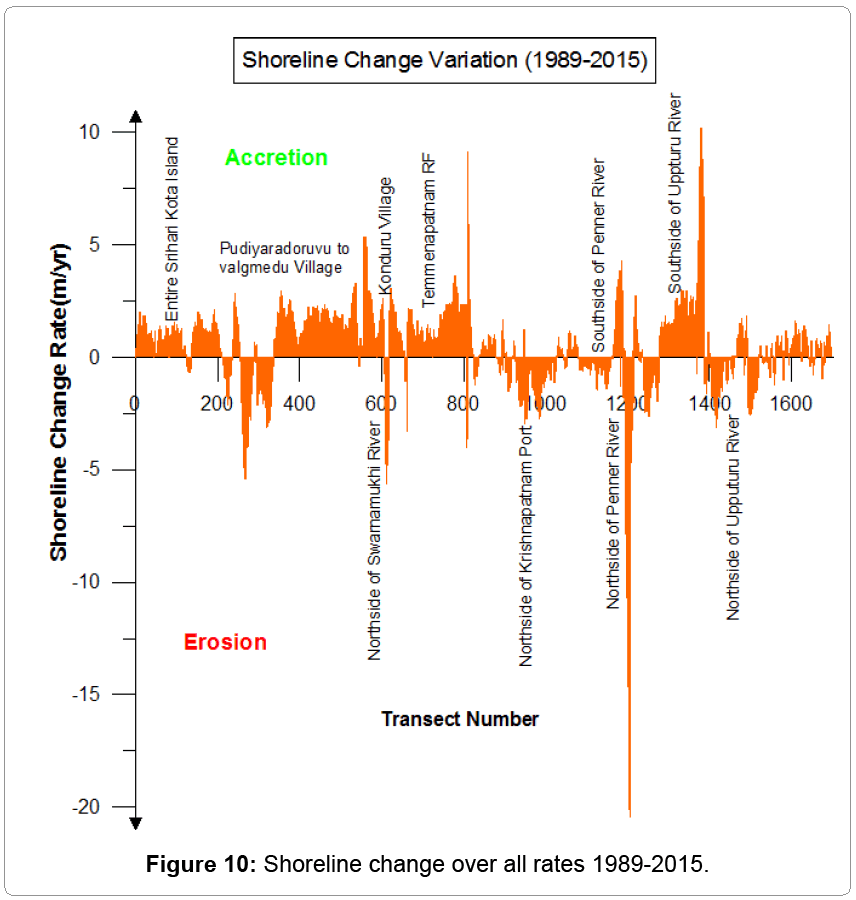
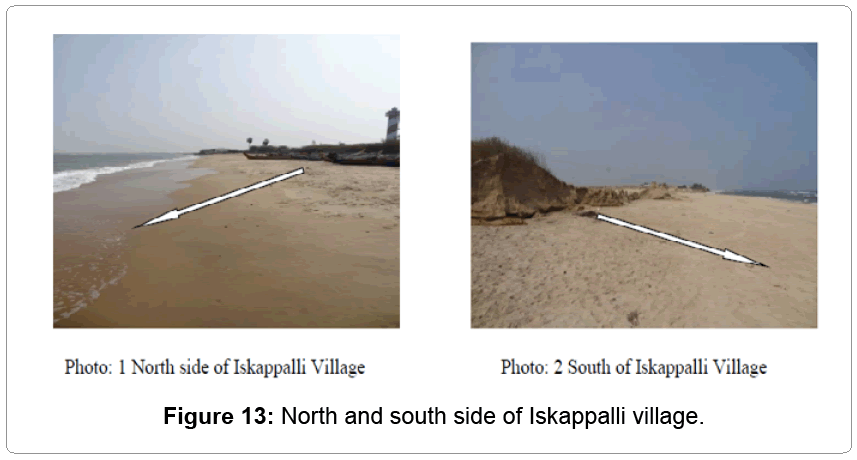
The shoreline change rates were calculated for the period of 1989 to 1999, 1999 to 2005, 2005 to 2010, 2010 to 2012, 2012 to 2015 and 1989 to 2015. Overall rates ranges from -20 m/year to 10 m/year where negative values represent erosion and positive values represent accretion (Figures 10-13). Using the 1989 to 2015 results as a reference, about 24% of the entire shoreline experienced erosion and 18% has Stable coast,while the remaining have mostly accreted. Accretion rates range from 0.1 m/year to 10 m/year with an average 1.4 m/year while erosion rates were between 0.1 to 20 m/year with an average of 1.36 m/ year. Both rates are significantly moderately high.
Conclusion
Shoreline position mapping is very valuable in regards to climate changes. Based on this study it can be concluded that remote sensing will be useful for long-term qualitative monitoring of shoreline erosion and accretion pattern in case lack of field data sources. The erosion and accretion pattern observed along the coast is influenced mainly by coastal process and reverie inputs. The variation in river mouth morphology was quite significant and changing rate were more all along the river mouth. In the year of 1989-2005 the average accretion rate is +2.46 m/yr and erosion rate acquired in the Nellore coast is -1.97 m/yr. It is same in the year of 2005 to 2015. The rate of accretion and erosion is derived as + 2.74 m/ yr and -2.8 m/yr. Overall, during the study periods, erosion activities are moderately high compare to accretion in study area. However, erosion activities are not occurred in the middle of the Segment.
Acknowledgements
I would like to thank Mr. Sanjay Gupta, (I.F.S), and Director General of APSAC for providing this opportunity to carry this research. The authors also like to thank APSAC Disaster management support and coastal studies Division (DMS&CS) for encouragement for this work.
References
- Chen LC, Rau JY (1998) Detection of shoreline changes for tideland areas using multi-temporal satellite images.IntJ Remote Sensing 19: 3383-339.
- Kannan R., Anand KV, Sundar V, Sannasiraj SA, Rangarao V (2013) “Shoreline changes along the Northern coast of Chennai port, from field measurements” ISH.Journal of Hydraulic Engineering.
- Dolan R., Hayden B, May P, May S (1980) The Reliability of Shoreline Change Measurements from Aerial Photographs. Journal of Shore and Beach: 22-29.
- Anthony EJ (2005) Beach Erosion. Encyclopaedia of Coastal Science. Springer: 140-144.
- Blodget HW, Taylor PT, Raork JH (1991) Shoreline Changes Along the Rosetta Nile Promontory - Monitoring with Satellite-Observations. Journal of Marine Geology 99: 67-77.
- Stauble DK (2003) The Use of Shoreline Change Mapping in Coastal Engineering Project Assessment. Journal of Coastal Research: 178-206.
- Mani MR, Shrivastava D, Vethamony P (2009) “Monitoring shoreline environment of Paradip, East coast of India using remote sensing” Current Science 97: 79-84.
- Crowell M, Leatherman SP (1999) Coastal erosion mapping and management. Journal of Coastal Research 28: 1-196.
- Alesheikh AA, Ghorbanali A, Nouri N (2007) Coastline Change Detection Using Remote Sensing.Int J Environ Sci Tech 4: 61-66.
- Moore LJ (2000) Shoreline mapping techniques. Journal of Coastal Research 16: 111-124.
- Thieler ER, Himmelstoss EA, Zichichi JL, Ayhan E (2009) “Digital Shoreline Analysis System (DSAS) version 4.0. An ArcGIS extension for calculating shoreline change”.
- Maiti, Bhattacharya AK (2009) “Shoreline change analysis and its application to prediction: A remote sensing and statistics based approach”. Marine Geology 257: 11-23.
- Saranathan E, Chandrasekaran R., Soosai MD, Kannan M (2011) “Shoreline Changes in Tharangampadi Village, Nagapattinam District, Tamil Nadu, India-A Case Study”. Journal Indian Society Remote Sensing 39: 107-115
- Prabhakar RP, Nair M, Raju DV (1985) “Assessment of the role of Remote Sensing in monitoring shoreline changes, A case study of the Kerala Coast”. International Journal Remote Sensing 6: 549-558.
- Bailey B,Nowell D (1996) Techniques for monitoring coastal change: a review and case study. Journal of Ocean and Coastal Management2:85-95.
- Bochicchio C, Richmond BM, Fletcher CH, Romine BM, Genz AS, et al. (2012) National assessment of shoreline change: Historical shoreline change in the Hawaiian Islands.US Department of the Interior, US Geological Survey.
- Boak EH, Turner IL (2005)Shoreline Definition and Detection: A Review. Journal of Coastal Research21: 688-703.
- Dolan R, Hayden BP, May S (1983) Erosion of the US shorelines. Journal of Remote Sensing 6: 26-31.
- Douglas BC, Crowell M (2000) Long-Term Shoreline Position Prediction and Error Propagation. Journal of Coastal Research: 145-152.
- ICMAM (2005) “Shoreline Management Plan for Ennore Coast (Tamilnadu)” Report of Integrated Coastal and Marine Area Management Project Directorate, Ministry of Earth Sciences, India.
- Fletcher C, Rooney J, Barbee M,Lim SC (2003) Mapping Shoreline Change Using Digital Orthophotogrammetry on Maui, Hawaii. Journal of Coastal Research 38: 106-124.
- Gopinath G,Seralathan P(2005) Rapid erosion of the Coast of the Sagar Island, West Bengal- India.Environmental Geology 48: 1058-1067.
- KalirajS, ChandrasekarN, MageshNS (2013) “Impacts of wave energy and littoral currents on shoreline erosion/accretion along the south-west coast of Kanyakumari. Tamil Nadu using DSAS and geospatial technology”. Journal of Environmental Earth Science 71: 4523-4542
- Moufadal WM (2005) “Use of Satellite Imagery as Environ-mental Impact Assessment Tool: A Case Study from the New Egyptian Red Sea Coastal Zone”. Environmental Monitoring and Assessment 107: 427-452.
- Nayak SR (2002) “Use of satellite data in coastal mapping” Indian Cartographer 22: 147-157.
- Pandian PK, Ramesh S, Murthy MVR, Ramachandran S,Thayumanavan S (2004), “Shoreline changes and near-shore processes along Ennore Coast, East Coast of South India”. Journal of Coastal Research. 20: 828-845.
- USGS (2005) “User Guide and Tutorial for the Extension for ArcGIS v.9.0 (DSAS) version 3.2 Digital Shoreline Analysis System Part of USGS” Open-File Report 2005-1304.
Relevant Topics
- Acoustic Survey
- Animal Husbandry
- Aquaculture Developement
- Bioacoustics
- Biological Diversity
- Dropline
- Fisheries
- Fisheries Management
- Fishing Vessel
- Gillnet
- Jigging
- Livestock Nutrition
- Livestock Production
- Marine
- Marine Fish
- Maritime Policy
- Pelagic Fish
- Poultry
- Sustainable fishery
- Sustainable Fishing
- Trawling
Recommended Journals
Article Tools
Article Usage
- Total views: 14867
- [From(publication date):
March-2016 - Mar 30, 2025] - Breakdown by view type
- HTML page views : 13543
- PDF downloads : 1324
