Commentary Open Access
Shifting Plates, Shifting Poles, Shifting Paradigms
Arthur Viterito*College of Southern Maryland, 8730 Mitchell Road, La Plata, Maryland, USA
- Corresponding Author:
- Arthur Viterito
College of Southern Maryland
8730 Mitchell Road, La Plata
Maryland, United States
Tel: 301 934 7851
E-mail: Arthurv@csmd.edu
Received date: June 09, 2017; Accepted date: June 14, 2017; Published date: June 21, 2017
Citation: Viterito A (2017) Shifting Plates, Shifting Poles, Shifting Paradigms. Environ Pollut Climate Change 1:130.
Copyright: © 2017 Viterito A. This is an open-access article distributed under the terms of the Creative Commons Attribution License, which permits unrestricted use, distribution, and reproduction in any medium, provided the original author and source are credited.
Visit for more related articles at Environment Pollution and Climate Change
Introduction
In a 2016 study I demonstrated that seismic activity along the globe’s mid-ocean ridges was highly correlated (0.785) with global temperatures from 1979 through 2015 [1]. An update through 2016 showed a strengthened correlation (0.814) along with the new knowledge that large upticks in mid-ocean seismic activity for 1995-1996 and 2013-2014 preceded the 1997-1998 and 2015-2016 “Super El Nino” episodes by two years [2]. Unfortunately, neither of these studies has received broad acceptance by the climate community as they challenge an accepted canon of climate science. Specifically, the idea that increased flux of oceanic geothermal heat (as indicated by increased seismic activity in these areas) can significantly alter temperature counters the hypothesis that increasing carbon dioxide has been the primary driver of recent global temperature change.
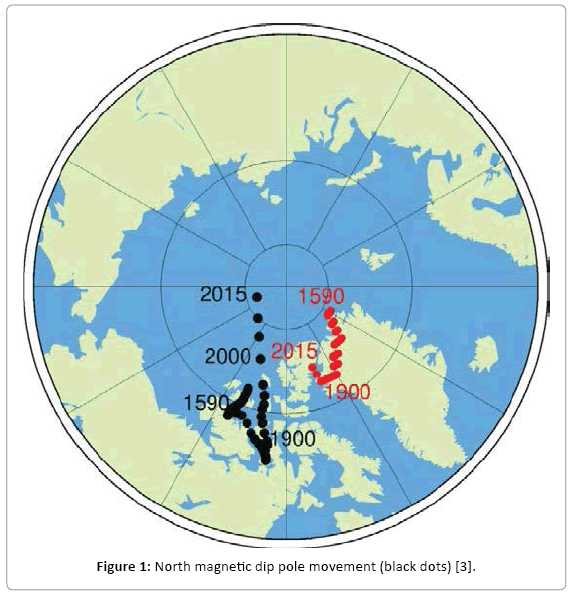
Despite the general “non-acceptance” of this hypothesis, a recent study by Williams [3] links a seemingly unrelated geophysical phenomenon to mid-ocean seismicity; thus a new paradigm may be emerging from this important association. Specifically, Williams shows that the speed at which the North Magnetic Dip Pole (NMDP) moves is highly correlated (r=0.935) with mid-ocean seismic activity (Figure 1).
Williams offers some interesting explanations for this seemingly unlikely association. At the start, he poses the critical question of “what is driving what?” By making note of the fact that there are four distinct discontinuities in the rate at which the NMDP moves, he declares that “it is more likely that the geological activity is driving the pole’s motion and not the other way around.” He goes on to say that “this type of activity would indicate some kind of…inertial or ‘frictional’ holding mechanism which prevented the magnetic pole from changing position until there was sufficient geothermal activity to overcome the holding mechanism and allow a speed change.” He ultimately concludes that any understanding of the dynamics associated with this is far from complete and is beyond the scope of his presentation. Theoretical shortcomings aside, this study makes one important fact abundantly clear: there is a statistically significant association between mid-ocean seismic activity and the speed of the NMDP.
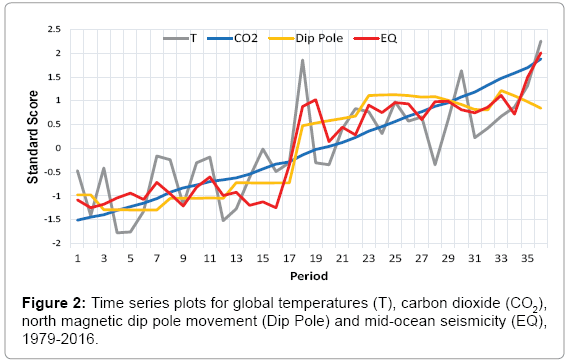
Expanding Williams’ analysis to include global temperatures, mid-ocean seismic activity, NMDP movement, and CO2 levels [4-8] from 1979 through 2016 yields some important and, in some respects, surprising correlations (Table 1 and Figure 2).
| Correlation Matrix - Global Temperatures, Carbon Dioxide, North Magnetic Dip Pole Movement, and Mid-Ocean Seismicity (1979-2016) | ||||
|---|---|---|---|---|
| T | CO2 | Dip Pole | EQ | |
| T | 1 | |||
| CO2 | 0.771739 | 1 | ||
| Dip Pole | 0.761382 | 0.90177 | 1 | |
| EQ | 0.813755 | 0.900488 | 0.93071 | 1 |
Table 1: Correlation matrix of global temperature (T), carbon dioxide (CO2), NMDP movement (Dip Pole), and mid-ocean seismicity (EQ), 1979-2016. In establishing this matrix, a two year lag applies to both mid-ocean seismicity and NMDP with relation to temperature; CO2 is unlagged.
The correlation matrix and time plots show that these geophysical parameters are all significantly correlated and trending higher over time. More importantly, multiple regression analysis corroborates the findings of the previous studies [1,2]: mid-ocean seismic activity is significantly correlated (p<0.05) with changing temperatures. However, CO2 concentrations, along with NMDP displacements, do not explain a significant percentage of the total variance (p>0.05) when they are included and must be dropped from the analysis. This high degree of multicollinearity is a prominent finding.
We must then ask if we see the same relationships (i.e., strong positive correlations) when we extend the analysis further back in time. Unfortunately, high-quality seismic data for the globe has only been available since 1970. Prior to that, seismic network coverage was limited, and only local and regional seismic information was available, mostly for continental areas. Also, the collection of high-quality satellite temperature data did not commence until 1978. However, coarser surface temperature readings are available from the Hadley Climate Research Unit Temperature (Had CRUT 4) dataset. Despite gaps in the spatial and temporal coverage, these data are generally considered to be the most reliable record of temperature going back to 1850 [9]. Reasonably reliable estimates of global CO2 and NMDP movements are also available back to 1850.
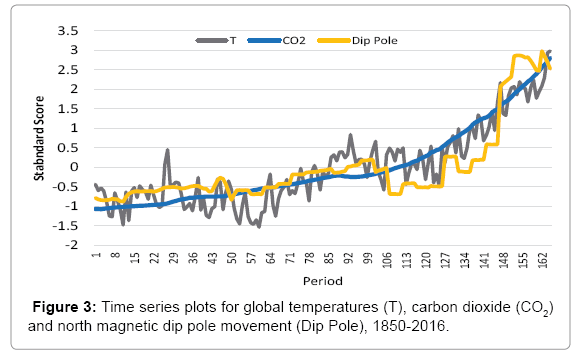
The correlations in Table 2 reveal statistically significant relationships between global temperature, CO2 and NMDP movement from 1850 through 2016. Multiple regression analysis reveals that both CO2 and NMDP movement are statistically significant predictors of temperature (p<0.05) and, like Figure 2, Figure 3 points to strong upward trends for all three parameters. It should also be noted that the very high correlation between NMDP movement and mid-ocean seismicity found in Williams’ study leads us to infer that, in all probability, mid-ocean seismic activity was also trending in tandem with temperature, CO2 and NMDP movement throughout the period.
| Correlation Matrix - Global Temperatures, Carbon Dioxide, and North Magnetic Dip Pole Movement (1850–2016) | |||
|---|---|---|---|
| T | CO2 | Dip Pole | |
| T | 1 | ||
| CO2 | 0.9075 | 1 | |
| Dip Pole | 0.8543 | 0.8862 | 1 |
Table 2: Correlation matrix of global temperatures (T), carbon dioxide (CO2) and NMDP movement (Dip Pole), 1850-2016. In establishing this matrix, a two-year lag applies to NMDP with relation to temperature; CO2 is unlagged.
Articulating the intricacies of the feedbacks, interactions and drivers of these critical geophysical phenomena is well beyond the scope of this brief exploratory analysis.
However, it is important to note that, despite high correlations, CO2 increases cannot be causing an intensification of mid-ocean seismic activity nor can higher CO2 concentrations be driving the acceleration of the NMDP. There is simply no plausible mechanism that can be invoked here. Clearly, there is far more in play than is currently accounted for in our understanding of earth’s climate. The shifting of plates, along with the concurrent shifts of earth’s NMDP, should spur the geophysical community to create a new and enduring paradigm that links these phenomena to changing global temperatures.
References
- Viterito A (2016) The correlation of seismic activity and recent global warming. J Earth Sci Clim Change 7: 345.
- Viterito A (2017) The correlation of seismic activity and recent global warming: 2016 update. Environ Pollut Clim Change 1: e102.
- Williams B (2016) The correlation of north magnetic dip pole motion and seismic activity. J Geol Geophys 5: 262.
- Reference for annual cycle, Data from National Space Science and Technology Center, Alabama.
- http://data.remss.com/msu/graphics/TLT/time_series/RSS_TS_channel_TLT_Global_Land_And _Sea_v03_3.txt
- http://ds.iris.edu/wilber3/find_event
- https://www.ngdc.noaa.gov/geomag-web/?endYear=2016&startYear=1998&lon1=&lat1Hemisphere=N&resultFormat=csv&browserRequest=true&lon1Hemisphere=W&lat1=&fragment=ushistoric#ushistoric
- https://www.ngdc.noaa.gov/geomag/data/poles/NP.xy
- Morice CP, Kennedy JJ, Rayner NA, Jones PD (2012) Quantifying uncertainties in global and regional temperature change using an ensemble of observational estimates: The HadCRUT4 dataset. J Geophys Res 117.
Relevant Topics
Recommended Journals
Article Tools
Article Usage
- Total views: 5284
- [From(publication date):
July-2017 - Mar 31, 2025] - Breakdown by view type
- HTML page views : 4410
- PDF downloads : 874


