Research Article Open Access
Shadow Technique Algorithm (STA) Sheds a New Light on Differential Interference Contrast (DIC) Microscopy
Dave Trinel1, Pauline Vandame1,2, Magalie Hervieu3, Emilie Floquet3, Marc Aumercier3, Emanuele G Biondi3, Jean-François Bodart2 and Corentin Spriet1*
1TISBio, CNRS, UMR 8576, UGSF, Glycobiology Structural and Functional Unit, Lille University of Science and Technology, Lille, France
2Regulation of Signal Division Team, CNRS, UMR 8576, UGSF, Glycobiology Structural and Functional Unit, Lille University of Science and Technology, Lille, France
3CNRS, UMR 8576, UGSF, Glycobiology Structural and Functional Unit, Lille University of Science and Technology, France
- *Corresponding Author:
- Corentin Spriet
TISBio, CNRS, UMR 8576, UGSF
Glycobiology Structural and Functional Unit
Lille University of Science and Technology
FRABio EN 3688 CNRS
F 59000 Lille, France
Tel: 330-362-531-712
E-mail: corentin.spriet@univ-lille1.fr
Received date: August 11, 2015; Accepted date: August 21, 2015; Published date: August 28, 2015
Citation: Trinel D, Vandame P, Hervieu M, Floquet E, Aumercier M, et al. (2015) Shadow Technique Algorithm (STA) Sheds a New Light on Differential Interference Contrast (DIC) Microscopy. J Anal Bioanal Tech 6:268 doi:10.4172/2155-9872.1000268
Copyright: © 2015 Trinel D, et al. This is an open-access article distributed under the terms of the Creative Commons Attribution License, which permits unrestricted use, distribution, and reproduction in any medium, provided the original author and source are credited.
Visit for more related articles at Journal of Analytical & Bioanalytical Techniques
Abstract
Diversity of biological samples is still partially considered by conventional Differential Interference Contrast (DIC) microscopy approaches. Here we propose a new algorithm (developed as an ImageJ macro), the STA (Shadow Technique Algorithm), whose originality relies in the 3D/4D visualization of a large range of biological objects, from bacteria, vegetal tissues to living cells in culture. This new approach does not need extensive calculations, systems modifications or in-depth knowledge of acquisition optics. STA, providing 3D DIC reconstruction every hundredth of ms, can be applied to dissect various cellular phenomena. In addition, we propose different methods of graphic representations, which unable to enlighten the specificities of each category of questioning. Specifically we here addressed: i) tissue imaging, ii) cell cycle and cell death imaging iii) vesicle tracking.
Keywords
Differential interference contrast; Shadow technique algorithm; Image analysis; ImageJ; Tracking; Cell cycle; 3D reconstruction
Introduction
Nomarski Differential Interference Contrast (DIC) is a noninvasive photonic microscopy method to gather structural properties at the cellular and sub-cellular levels [1]. In such context, living cells are not damaged, enabling the observation of dynamic processes both in vitro and in tissues. From the early fifties, DIC has provided nuances of grey, to detect small structures and vesicles [2,3]. Thus, one shall keep in mind that DIC is intrinsically qualitative, reflecting a difference in both phase and amplitude, and providing a nonlinear response to phase gradient. Furthermore, DIC's images result in a false sense of depth. Indeed, images are produced by interference between a reference and a spatially-sheared light wave, resulting in a differential image having directional contrast, according to the direction of the shear.
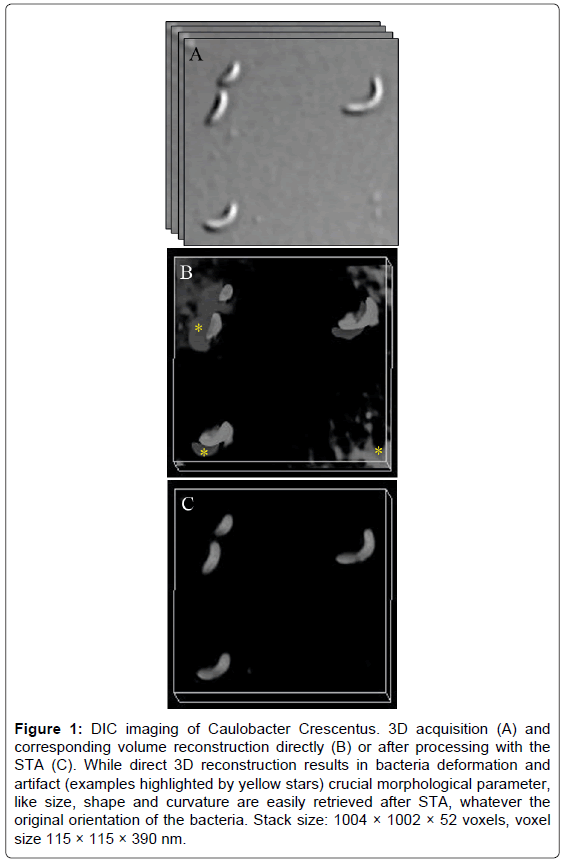
DIC microscopy was extensively used when considering objects in 2D, while thick objects have been more difficult to assess. Comparing to fluorescence, which is widely used for 3D and benefits from a black background and grey levels reflecting the intensity of the signal, DIC provides images of structures boundaries exhibiting either bright or dark intensities, while the remainder of the image has an intermediate grey level. Thus, standard image processing methods for DIC image segmentation, such as “thresholding” or edge detection, cannot be employed on DIC's images and limit 3D reconstruction (Figure 1) [4,5].
Figure 1: DIC imaging of Caulobacter Crescentus. 3D acquisition (A) and corresponding volume reconstruction directly (B) or after processing with the STA (C). While direct 3D reconstruction results in bacteria deformation and artifact (examples highlighted by yellow stars) crucial morphological parameter, like size, shape and curvature are easily retrieved after STA, whatever the original orientation of the bacteria. Stack size: 1004 × 1002 × 52 voxels, voxel size 115 × 115 × 390 nm.
Several efforts have been made to develop 3D representation of DIC image series. They can be classified following two main approaches, qualitative or quantitative. The quantitative method needs a deep understanding and/or modification of the acquisition system. Rotational diversity is among these techniques, which involve system modifications and extensive data analysis [6]. Rotational diversity consists in taking several images at different rotation with respect to the DIC shear angle and then, combining them by iterative optimization, allowing more quantitative phase gradient maps to be achieved.
However, while the images recorded by DIC are a mixture of non-linear phase and amplitude information, they are intrinsically qualitative, and likely appropriate for 3D visualization of biological objects. Therefore, methods have been developed to achieve a faster preprocessing. Indeed, algorithms can be developed in order to convert classical DIC images into fluorescence-like images. Heise and collaborators [7] provided a critical comparison of most DIC image reconstruction methods and reported advantages and drawbacks of both iterative (iterative line integration [8] and modified iterative Hilbert transform [7]) and non-iterative methods (Hilbert transform [9] and deconvolution [10]). All above-mentioned techniques require precise knowledge of the shear angle of the DIC prism. They may also result in strong visual distortions, implementation complexity or restriction to specific biological objects [7-10]. All together, these considerations have led users to consider DIC as a tough and rough tool for biologist, who are the main potential users for such methods.
In this article, we propose the Shadow Technique Algorithm (STA), a novel and user-friendly algorithm enabling the 3 and 4D visualization of DIC that overcomes the above-mentioned limitations (Figure 1). This method has been applied to representative biological sample ranging from thin and low-contrasted bacteria to thick and dense root slices. We also provide comprehensive methods to extract biological information and to represent sample morphologies.
Materials and Methods
Sample preparation
Caulobacter crescentus bacteria were grown to mid-log phase in PYE (Peptone-Yeast Extract) medium at 30°C [11]. For fixation, bacteria were centrifuged and placed in 4% paraformaldehyde for 15 min at room temperature followed by 30 min on ice. After washing and resuspension in PBS, 2 μL of suspension were deposited on microscope slides coated with agar pads (1% agar in PBS).
MDA cells: Human MDA-MB-231 cells were cultured in Dulbecco's modified Eagle's medium (Invitrogen, Life Technologies, Saint Aubin, France) supplemented with 10% fetal bovine serum and 50 ml gentamycin. 24 hr before observation, cell were seeded on a POC (Perfusion Open and Closed) chamber system (PeCon GmbH) and medium was replaced by Leibovitz's L-15 Medium without phenol red (Sigma-Aldrich Co. LLC) just before observation.
Convallaria root slice is a reference sample kindly provided by Leica Microsystems GmbH.
Image acquisition
Experiments were carried out with a Leica AF6000 LX microscope (Leica Microsystems GmbH) equipped with a HCX PL APO CS 100X/1.40 DIC (Oil) objective and an Andor iXon DU-885 EM-CCD camera (Andor Technology Ltd). For live MDA acquisitions, the sample temperature was set to 37°C using a PeCon incubator (PeCon GmbH).
Image processing
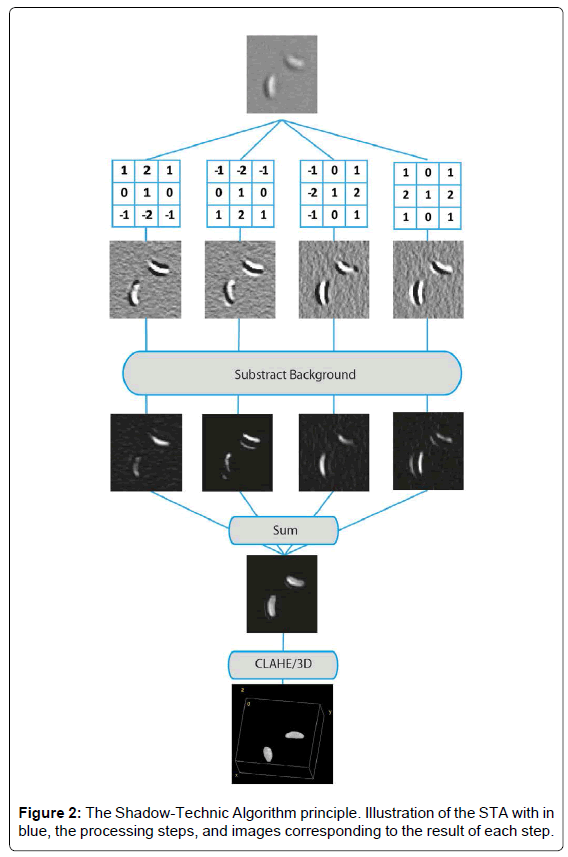
STA: For details about STA, please see results, and Figure 2.
To use STA:
• Copy the text available as supplementary data in FiJi’s macro editor (Plugin/New/Macro).
• Select macro language in the “language” tab
• Optimize the initialization parameters if needed, as explained in the green header
• Open your image or stack
• Run the macro.
Depth color coding: We modified the “temporal color code” plugin developed by Kota Miura (Centre for Molecular and Cellular Imaging, EMBL Heidelberg, Germany) to apply a color code on each image depending of its depth. Instead of applying a Maximum Intensity Projection of the stack, we choose to use the ImageJ 3D viewer, and thus obtained a 3D reconstruction of cells with and easily readable depth scale, as shown in Figure 3. The plugin we developed is available upon request.
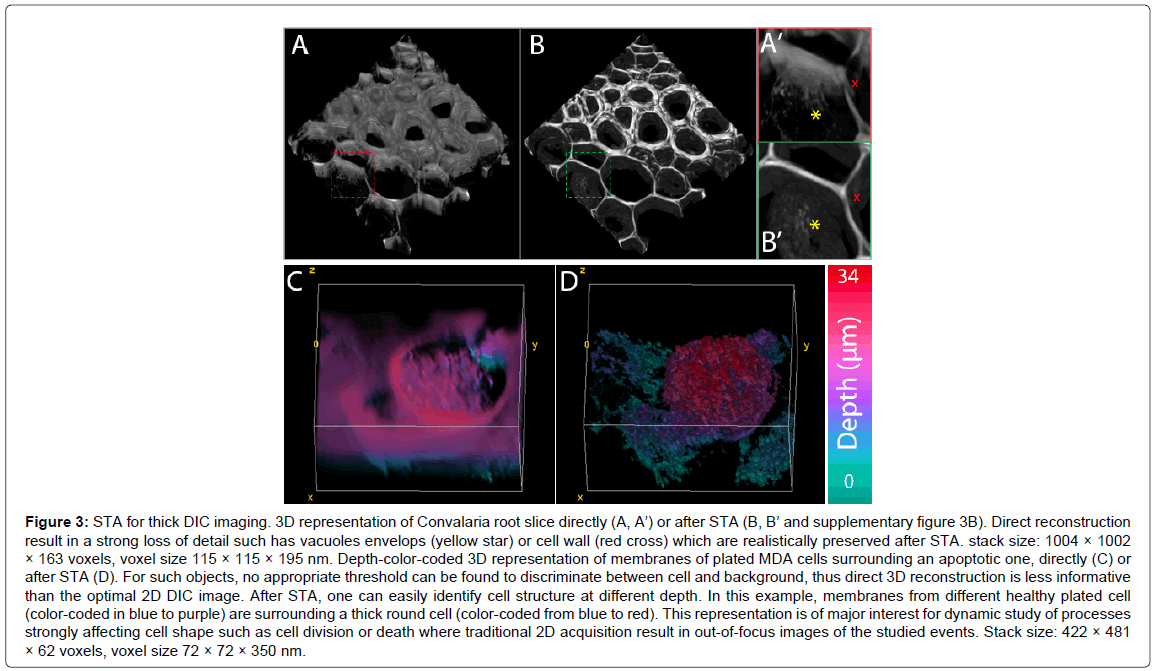
Figure 3: STA for thick DIC imaging. 3D representation of Convalaria root slice directly (A, A’) or after STA (B, B’ and supplementary figure 3B). Direct reconstruction result in a strong loss of detail such has vacuoles envelops (yellow star) or cell wall (red cross) which are realistically preserved after STA. stack size: 1004 × 1002 × 163 voxels, voxel size 115 × 115 × 195 nm. Depth-color-coded 3D representation of membranes of plated MDA cells surrounding an apoptotic one, directly (C) or after STA (D). For such objects, no appropriate threshold can be found to discriminate between cell and background, thus direct 3D reconstruction is less informative than the optimal 2D DIC image. After STA, one can easily identify cell structure at different depth. In this example, membranes from different healthy plated cell (color-coded in blue to purple) are surrounding a thick round cell (color-coded from blue to red). This representation is of major interest for dynamic study of processes strongly affecting cell shape such as cell division or death where traditional 2D acquisition result in out-of-focus images of the studied events. Stack size: 422 × 481 × 62 voxels, voxel size 72 × 72 × 350 nm.
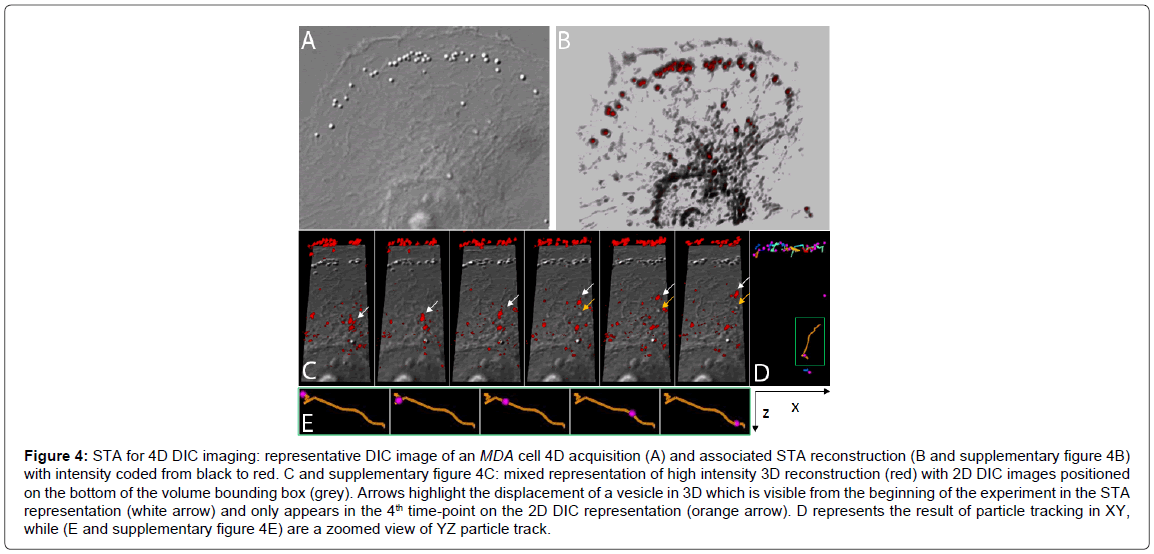
Combined volume and slice view: To compare information usually obtained through 2D DIC imaging and 3D reconstruction along time, we used a mixed representation of the data in Figure 4. First, we performed a 4D reconstruction with high threshold applied on the 4D DIC series processed with STA and color coded it in red.
Figure 4: STA for 4D DIC imaging: representative DIC image of an MDA cell 4D acquisition (A) and associated STA reconstruction (B and supplementary figure 4B) with intensity coded from black to red. C and supplementary figure 4C: mixed representation of high intensity 3D reconstruction (red) with 2D DIC images positioned on the bottom of the volume bounding box (grey). Arrows highlight the displacement of a vesicle in 3D which is visible from the beginning of the experiment in the STA representation (white arrow) and only appears in the 4th time-point on the 2D DIC representation (orange arrow). D represents the result of particle tracking in XY, while (E and supplementary figure 4E) are a zoomed view of YZ particle track.
We then applied on the bottom of the bounding box the best focused unprocessed DIC image. Object correspondence between DIC and STA-reconstructed-DIC can thus be achieved by translation, as seen for vesicles located at the edge of the cell in Figure 4C.
Particle tracking: To illustrate our capacity to follow objects in the 4D, we used the trackmate plugin for FiJi as described in ref. [12]. We choose high threshold to segment vesicles only. Vesicles are then represented as pink spheres while their trajectories are shown as colored line, with colors temperature reflecting their velocity.
Results and Discussion
STA method
The method has been developed for FiJi [13], a distribution of ImageJ [14] for biological-image analysis. Original stack is duplicated 4 times. On each stacks, either a 3 × 3 north/south/east/west filter is applied (see Figure 2 for filters matrixes) producing a shadow effect on each image. The ImageJ “subtract background” function is then applied, using the “rolling ball” algorithm [15], to subtract local background values from the image. The 4 resulting images are then added up and processed by Contrast Limited Adaptative Histogram Equalization (CLAHE, [16]). 3/4D representations are then obtained on thresholded images either through FiJi’s “3D Viewer” or “volume viewer” plugin. STA is available has an ImageJ macro.
Biological applications
We choose different representative biological samples to illustrate the information that can be extracted by STA: (i) thin and delimitated objects such as fixed bacteria, (ii) thick and structured object like section of complex architecture of Convalaria root and (iii) eukaryotic livings cells, such as MDA, to illustrate cellular deformation and intracellular dynamics. These objects would not have been easily and exhaustively considered by conventional DIC approaches.
Figure 1, with bacteria imaging, presents the typical problem encountered after direct 3D DIC reconstruction: object deformation and artifact appearance. After STA, bacteria morphology is faithfully pictured, preserving cell shape, size and curvature. It is thus possible to compare bacteria morphologies whatever their 3D orientation.
In Figure 3A and 3B, we represented the 3D reconstruction of a Convalaria root slice. As observed on such structured object, direct reconstruction was possible with optimized threshold and transparency adjustment. However, while we get a global idea of the biological object, cell walls and vacuoles were not realistically reconstructed (A,A’). After STA, the reconstruction was more consistent with reality, based on previous knowledge we had from fluorescence images. Indeed, the different cells walls were defined on the whole width of the stacks and the vacuole shape was preserved.
On C and D, the same approach was applied to MDA cells. In this case, the contrast was low, and an appropriate threshold could not be found directly from the DIC series (C). After STA, one may clearly visualize both thin plated cells (partial membranes of different cells are visible in blue-purple) and big round cells (coded from blue to red). This visualization could then allow following different cell processes like mitosis, apoptosis or necrosis which is not feasible using 2D DIC microscopy.
We thus extended our approach to 4D imaging (Figure 4). Half of an MDA cell was represented, within which vesicles were easily observed. However, 2D DIC images allowed monitoring only vesicles at the focal plane of an image. It was thus well adapted to the edge of the membrane, which can be considered flat at the optical scale, but we failed to image vesicles on top of the cell. This was exemplified in panel C, a cropped portion of the initial cell over time. The vesicle highlighted by the white arrow was visible from the first time series on the 3D reconstruction, while it appeared in the focal plane of the DIC image only at the fourth time point (orange arrow). STA thus allowed 4D tracking of sub-cellular dynamic as illustrated in D and E.
Conclusions
Amenability of STA
We considered several levels of complexity within a biological object: thickness, inner architecture, cellular deformations and intracellular movements of organelles (Figures 3 and 4). Many observations cannot be gathered with conventional DIC use. More complex and time consuming methods can be used, such as Hilbert transform, rotational diversity, and iterative line integration. Nevertheless, the STA enabled to address these objects, in a user-friendly manner and without requesting either microscopes adaptations or modifications.
In addition, we proposed different methods of graphic representations. Depth scale color coding in Figure 3 provided at glance the relief of membranes: healthy cells plated were visualized in blue-green whereas dying cells were highlighted in red (Figure 3D). Similarly, dividing cells, which are spherical as well, could be easily followed. Thus, morphology of cells can be monitored, with respect of all their aspects of life and death. Regarding organelles tracking, we proposed a mixed representation, merging classical 2D DIC images with 3D volume reconstruction (Figure 4). Such combination provided the familiarity of DIC images with the complementary information of 3D. Furthermore, it can be combined to particles tracking.
In an era that crowns quantitative approaches, still DIC manages to provide valuable and precise qualitative observations through STA. One shall also note that the observations gathered are sufficient to address biological phenomena in their complexity, with an extreme timeresolution without the limits of photo bleaching usually encountered in these contexts. Indeed, in our hands high-resolution images (1000 × 1000 pixels) were gathered every 3 ms and complete stack around 150 ms. Such fast acquisitions, with precise reconstruction of complex structures, provided the opportunity to monitor cellular deformation like the one occurring during cell death (Figure 3) or vesicles movements (Figure 4). Far from remaining an old-grand pa’s technique, DIC still provide, through the Shadow Technique Algorithm, a fancy tool for numerous biological applications.
Acknowledgements
We thank Kota Miura for the temporal color coder plugin for imageJ. Pauline Vandame (2011-2014), Emilie Floquet and Magalie Hervieu (2014-2015) were paid by the University of Lille 1 and the Region Nord-Pas-de-Calais. We thank the personal of the BICeL-Lille1-HB facility for access to the microscopy systems and technical advices.
References
- Lang W (1968) Nomarski Differential Interference-Contrast Microscopy.
- Nomarski G (1955) Microinterférométriedifférentielle à ondepolarisées. J Phys Radium 16: 9.
- Obara B, Roberts MA, Armitage JP, Grau V (2013) Bacterial cell identification in differential interference contrast microscopy images. BMC Bioinformatics 14: 134.
- Simon I, Pound CR, Partin AW, Clemens JQ, Christens-Barry WA (1998) Automated image analysis system for detecting boundaries of live prostate cancer cells. Cytometry 31: 287-294.
- Obara B,Veeman M, Choi JH, Smith W, Manjunath BS (2011) Segmentation of ascidian notochord cells in DIC timelapse images. Microsc Res Tech 74: 727-734.
- Preza C (2000) Rotational-diversity phase estimation from differential-interference-contrast microscopy images. J Opt Soc Am A Opt Image Sci Vis 17: 415-424.
- Heise B,Sonnleitner A, Klement EP (2005) DIC image reconstruction on large cell scans. Microsc Res Tech 66: 312-320.
- Kam Z (1998) Microscopic differential interference contrast image processing by line integration (LID) and deconvolution. Bioimaging 6: 166-176.
- Arnison MR,Cogswell CJ, Smith NI, Fekete PW, Larkin KG (2000) Using the Hilbert transform for 3D visualization of differential interference contrast microscope images. J Microsc 199: 79-84.
- van Munster EB, van Vliet LJ, Aten JA (1997) Reconstruction of optical pathlength distributions from images obtained by a wide-field differential interference contrast microscope. J Microsc 188: 149-157.
- Fioravanti A,Fumeaux C, Mohapatra SS, Bompard C, Brilli M, et al. (2013) DNA binding of the cell cycle transcriptional regulator GcrA depends on N6-adenosine methylation in Caulobactercrescentus and other Alphaproteobacteria. PLoS Genet 9: e1003541.
- Jaqaman K,Loerke D, Mettlen M, Kuwata H, Grinstein S, et al. (2008) Robust single-particle tracking in live-cell time-lapse sequences. Nat Methods 5: 695-702.
- Schindelin J,Arganda-Carreras I, Frise E, Kaynig V, Longair M, et al. (2012) Fiji: an open-source platform for biological-image analysis. Nat Methods 9: 676-682.
- Schneider CA,Rasband WS, Eliceiri KW (2012) NIH Image to ImageJ: 25 years of image analysis. Nat Methods 9: 671-675.
- Sternberg SR (1983) Biomedical image processing. Computer 16: 22-34.
- Pizer SM, Amburn EP, Austin JD, Cromartie R, Geselowitz A, et al. (1987) Adaptative Histogram Equalization and its variations. Computer Vision, Graphics, and Image Processing 39: 355-368.
Relevant Topics
Recommended Journals
Article Tools
Article Usage
- Total views: 16134
- [From(publication date):
October-2015 - Apr 01, 2025] - Breakdown by view type
- HTML page views : 11391
- PDF downloads : 4743


