Research Article Open Access
Sequence Development and Palaeogeography Evolution of Ewan and Oloye Fields (Middle Miocene), Northwestern Niger Delta
Durogbitan A Abimbola*Petrfac IES, Research and Development, Manchester, UK
- Corresponding Author:
- Durogbitan A Abimbola
Principal Geoscientist, Petrfac IES
Research and Development, Manchester, UK
Tel: +447545822428
E-mail: adewoledurogbitan@yahoo.co.uk
Received Date: May 07, 2016; Accepted Date: July 15, 2016; Published Date: July 26, 2016
Citation: Durogbitan AA (2016) Sequence Development and Palaeogeography Evolution of Ewan and Oloye Fields (Middle Miocene), Northwestern Niger Delta. J Marine Sci Res Dev 6:203. doi: 10.4172/2155-9910.1000203
Copyright: © 2016 Durogbitan AA. This is an open-access article distributed under the terms of the Creative Commons Attribution License, which permits unrestricted use, distribution, and reproduction in any medium, provided the original author and source are credited.
Visit for more related articles at Journal of Marine Science: Research & Development
Abstract
Sequences developed within the middle Miocene in the study area are interpreted to be controlled locally by episodic shelf instabilility, basin physiography (shelf edge), fault growth and linkage. Relative sea level changes provide the major control on sequence development and deep valley incisions. The latter have a strong geomorphological impact on the area and a strong control on sequence variability. Interpretation of GDE maps shows that sands were originally deposited in river- and mouth bars with longshore drift currents redistributing the sand parallel to the shoreline. During lowstand periods, canyons developed which served as conduits for sand to the basin (deep water sand), recognized as high amplitude seismic facies on the slope and on the basin floor. This mechanism has led to the deposition of considerable amount of sandstones in the slope and offshore environments. Idealized schematic sequence stratigraphic development models have been generated for the study area, while schematic palaeogeography and general conceptual depositional models of the study area during middle Miocene time are also presented.
Keywords
Oloye fields; Miocene; Niger delta
Introduction
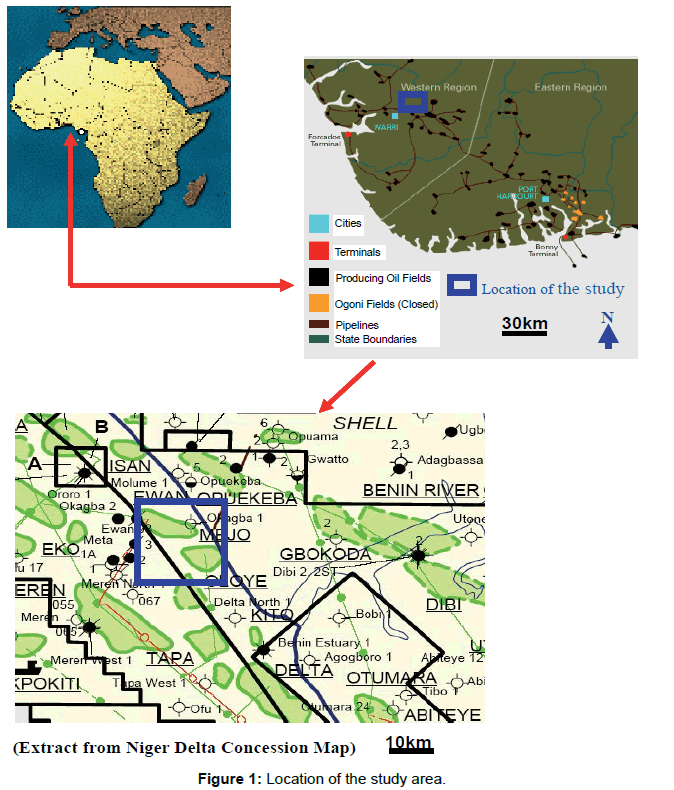
The depositional setting of the study area (Figure 1) has been interpreted to range from continental to offshore environments within a shelf edge depositional setting [1]. Important depositional facies interpreted include undifferentiated continental deposits, fluvial/tidal channel sandstones, mouth bars and upper shoreface sandstones, lower shoreface heterolithics, and offshore mudstones (with discrete slope channel and basinal sand).
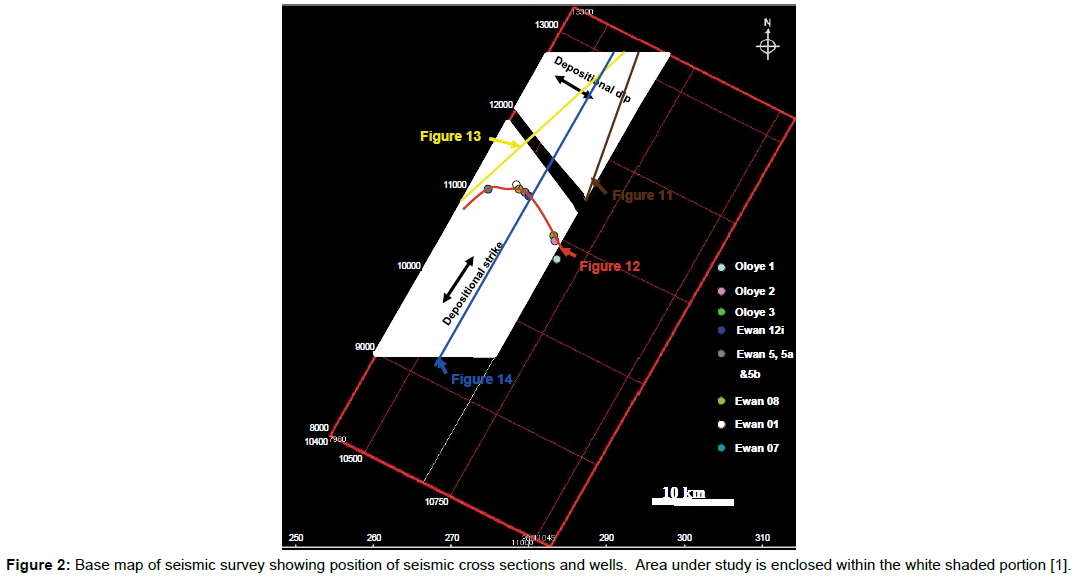
Seismic stratigraphic analysis of this study area consists of six depositional sequences [1] figures with base map of seismic survey showing position of seismic cross sections and wells in Figure 2. Sequences are made up aggradational to progradational HST that makes up about 50% of a sequence. TST are thin and widespread whereas LST are restricted to within WNW-ESE trending valley fills typically 4 km wide and an average 120 m deep. Outside the LST valleys, transgressive surfaces, maximum flooding surfaces and sequence boundaries are coincident on interfluves. This suggests that during LST times most of the area was periodically subaerially exposed [1]. During the time of lowstand, several incised valleys/canyons were developed. These incisions/canyons acted as a sand feeder that led to the deposition of high amplitude deposits (sandstones) on the slope and within the basin floor setting. Sequences mapped over the study area show local variation associated with growth faults. Typically, individual sequences are 10-15% thicker in the hanging wall than the footwall while LST incision is also greater in the hanging wall of the growth faults [1] (Figure 2).
Synthesis of Sequence Development and Paleogeography Evolution
Having studied and analysed the six depositional sequences [1], the spatial and temporal evolution of the depositional systems is determined using a sequence of palaeogeographies through production of Gross Depositional Environment (GDE) maps. Gross Depositional Environment maps allow synthesis of the evolution of depositional sequence palaeogeographies. Because no single map is representative for an entire stratigraphic interval, Lowstand and Highstand GDE maps were constructed for four of the depositional sequences. This has allowed the depositional fills, spatial relationships and geometry of facies to be described and changes observed between main units within a sequence as well as between sequences. Because TST in this study area are thin but widespread, Highstand GDE maps are constructed to be made up the period of transgression (TST) and progradation (HST). The position of the shoreline for each sequence (both LST and HST) are highlighted and annotated, as well position of the control wells, depocentres and faults.
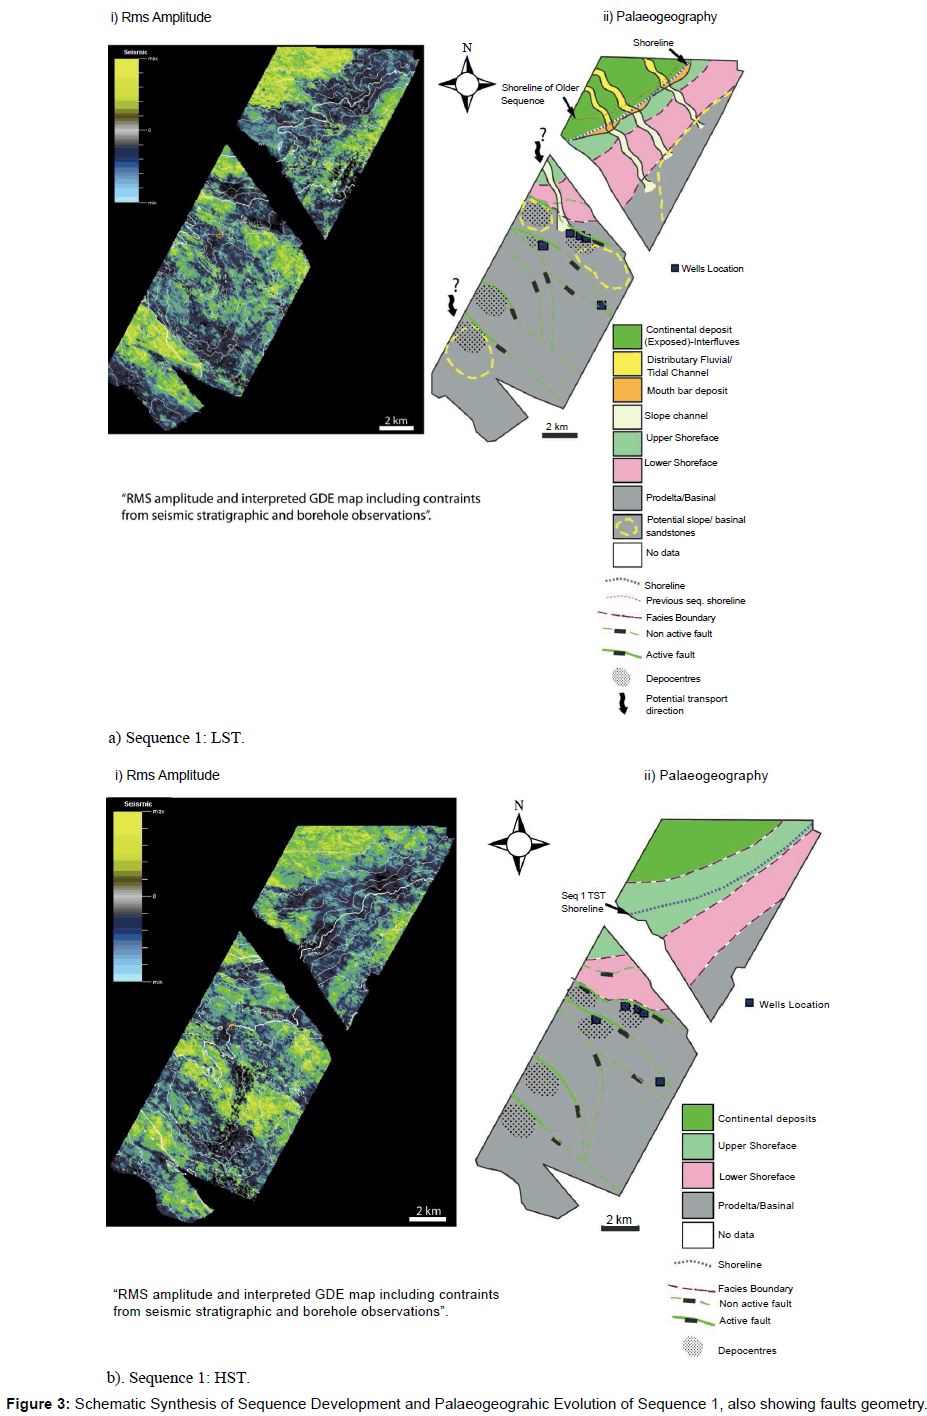
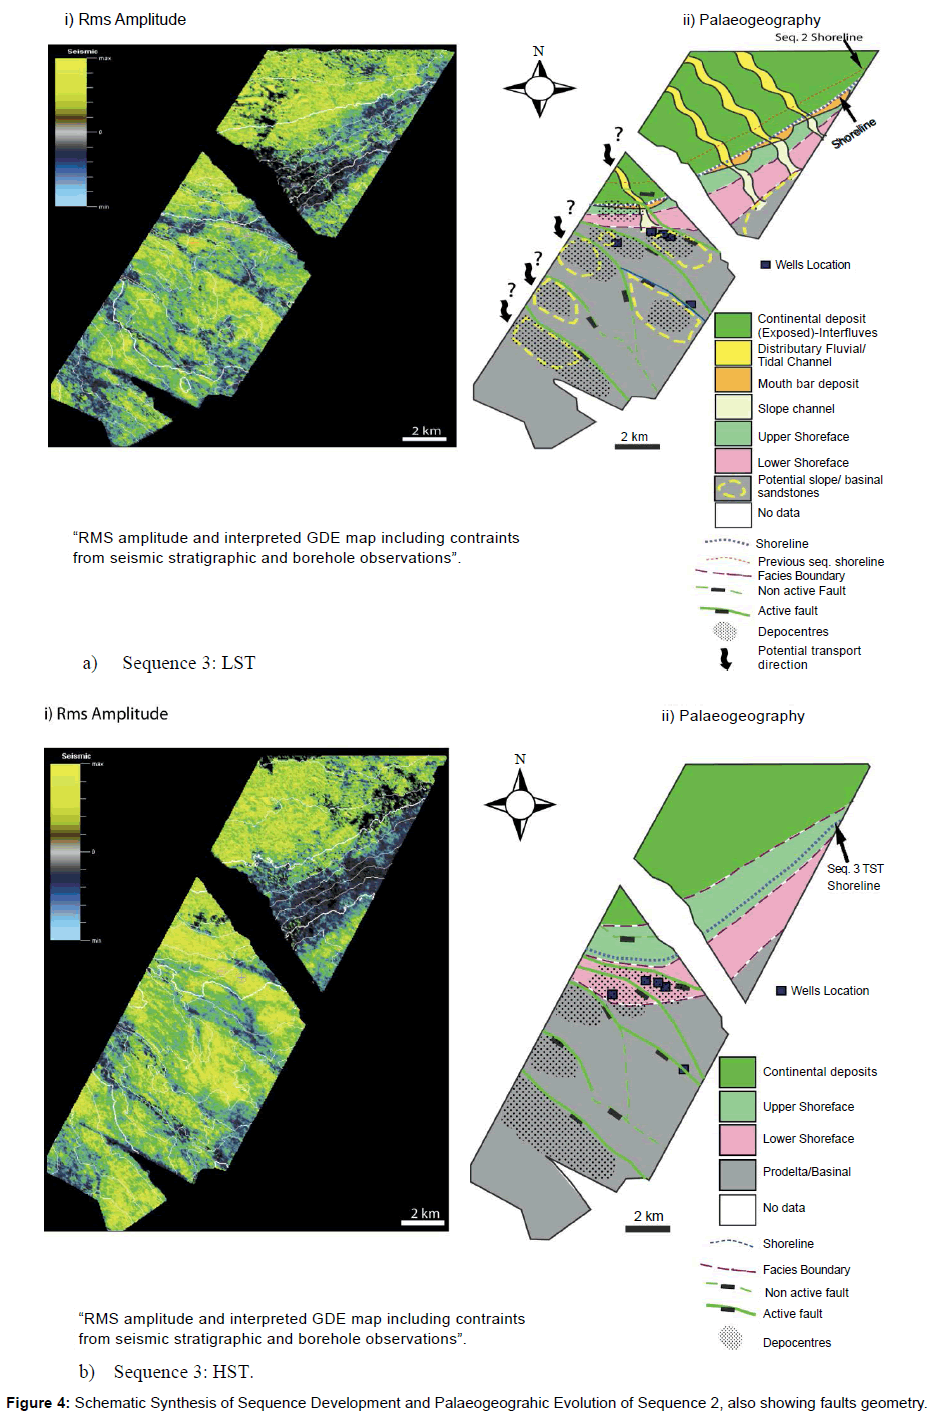
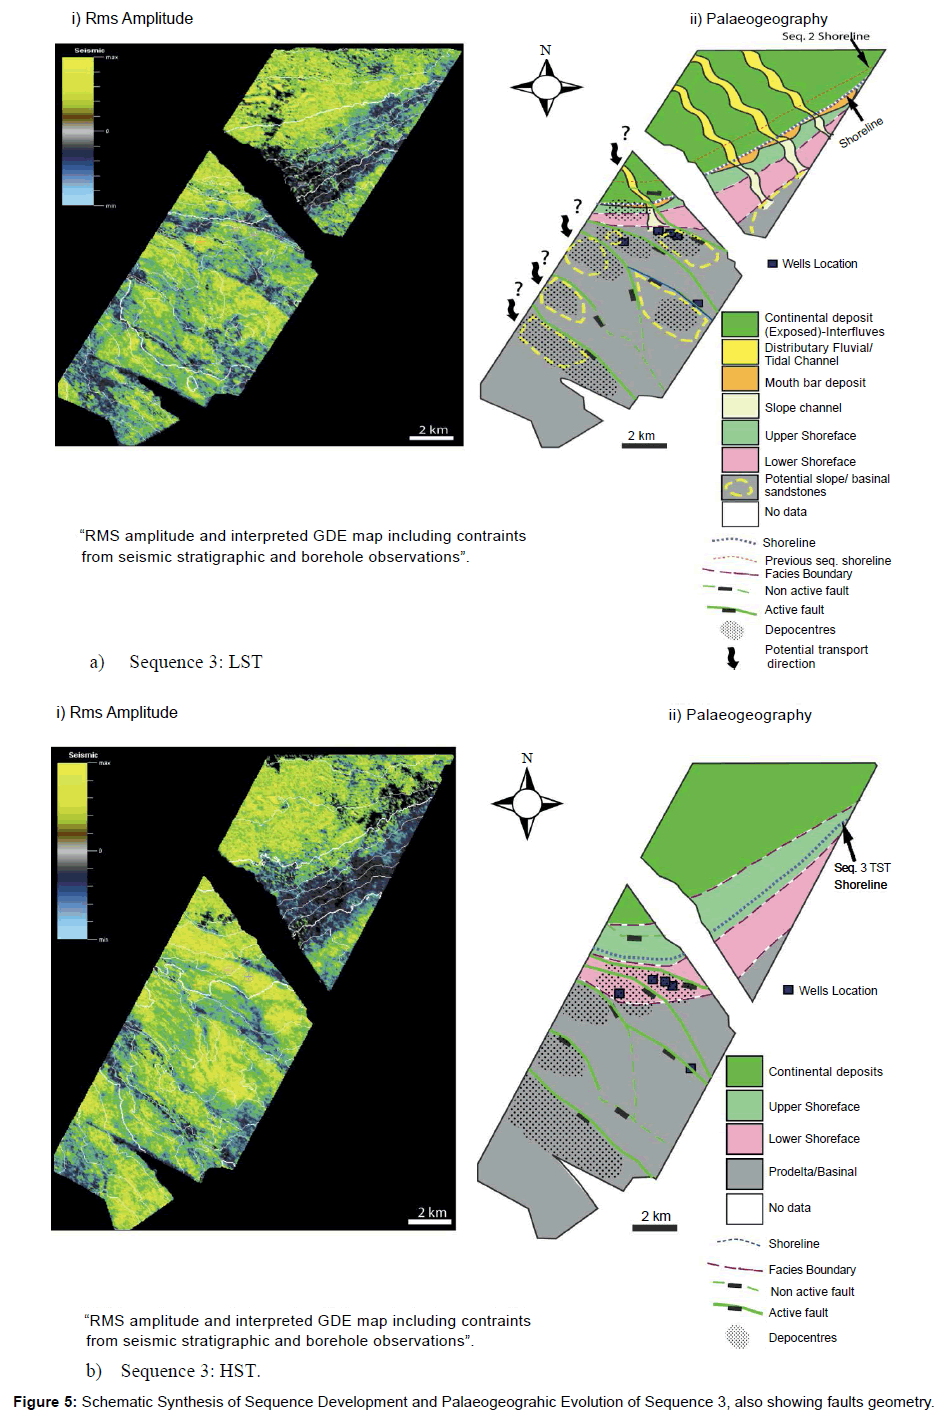
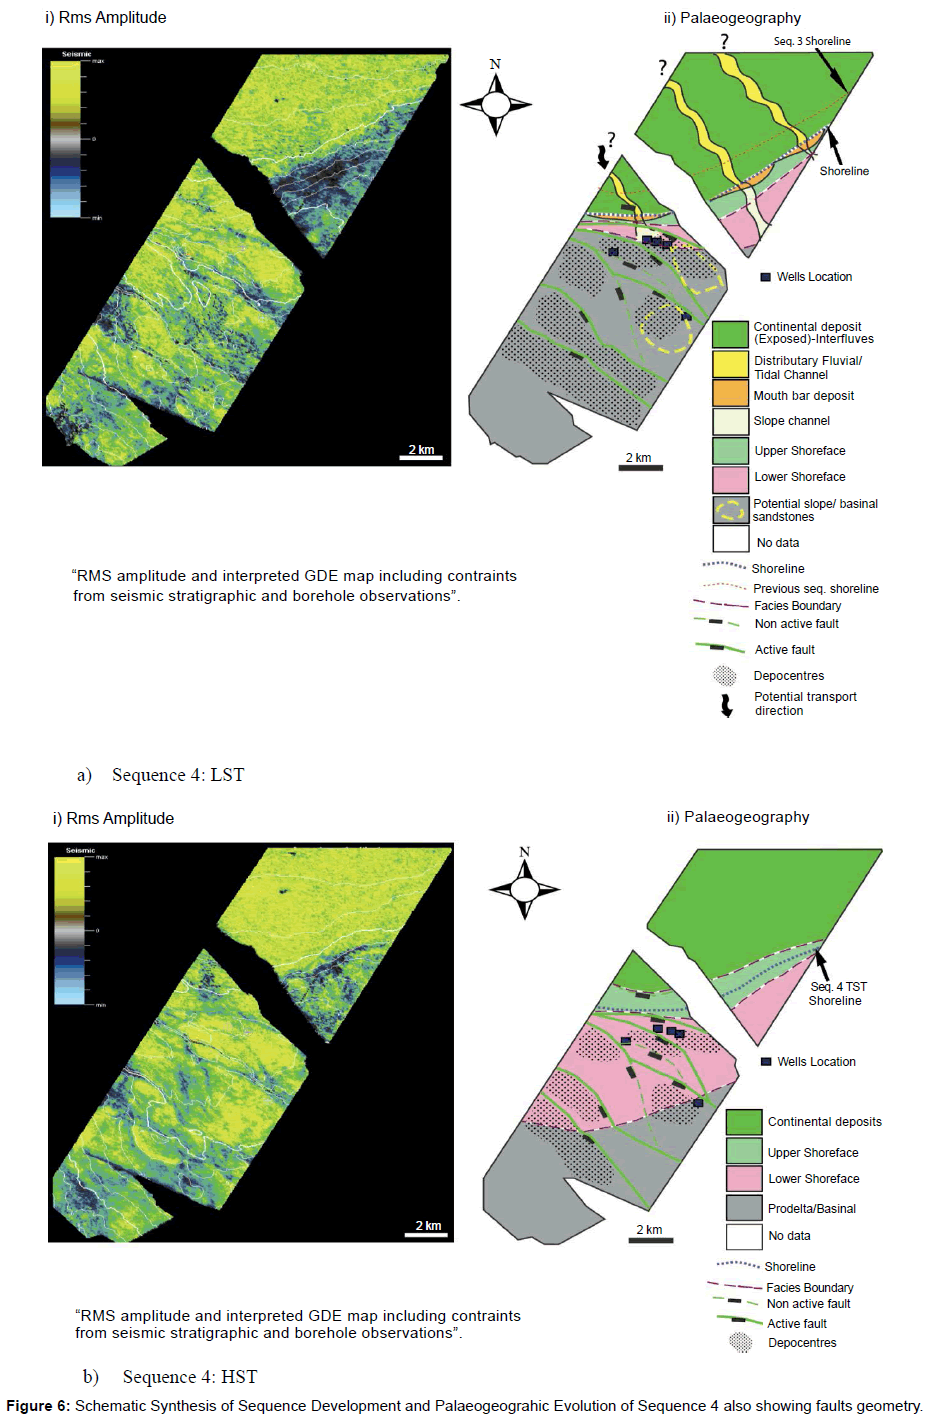
Generally, shoreline geometries are lobate, and prograde basinward (south) during lowstand period, retrograde (TST) and subsequently prograde during highstand period. It is observed in all the sequences that the distal part of the study area is more tectonically active and faulted. In this area where we have syn depositional faults a more complex facies distribution/a depositional pattern is observed thereby creating some local depocentres (Figures 3-6).
Depositional sequence 1
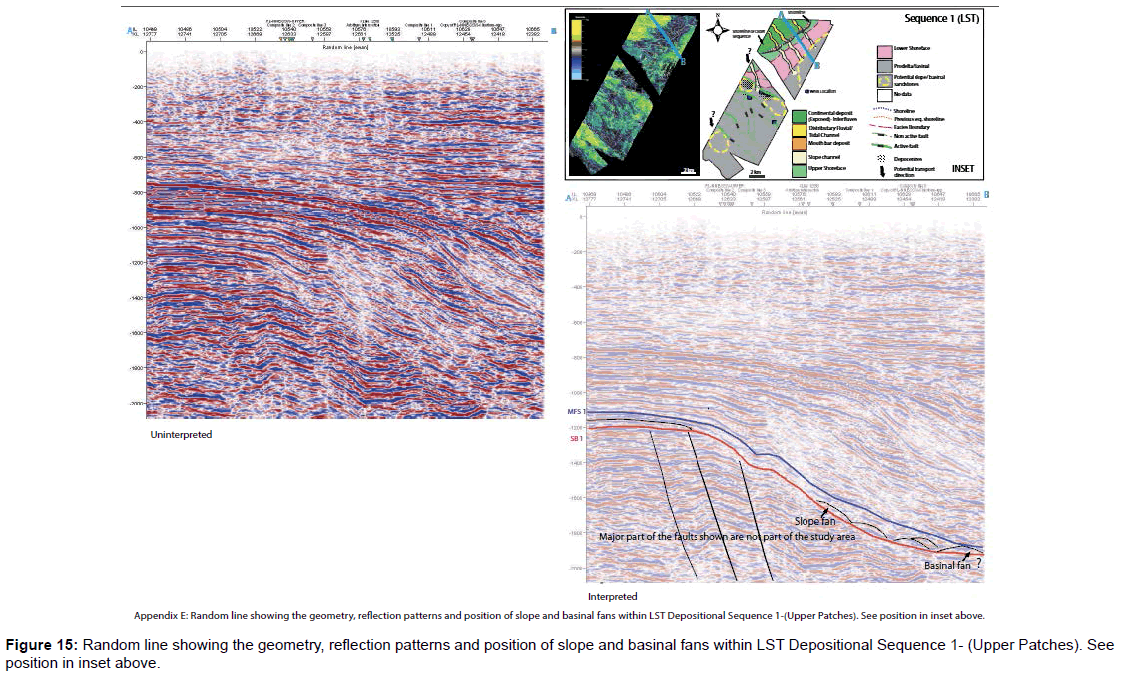
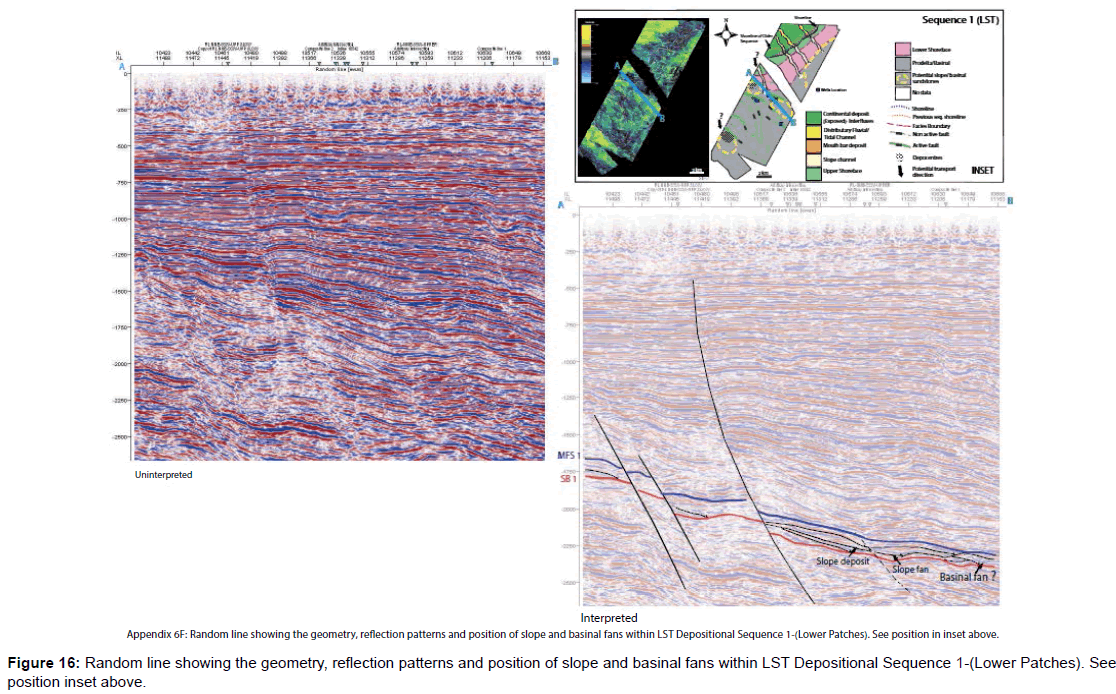
There are few data to constrain the palaeogeography of this sequence, this due to the lack of well control/penetration and poor seismic definition at the base of Agbada Formation reflectors. Two GDE maps are constructed for this depositional sequence, for the lowstand and highstand period respectively (Figures 3a and 3b). Depositional Sequences 1 developed due to a relative sea level fall that led to the exposure of the shelf edge area. This has led to incisions within the shelf creating 3 palaeovalleys originally described (Depositional Sequence 1- Durogbitan [1]) and subsequent deposition of sand as mouth bar deposit as a result of longshore drift and upper shoreface sandstones in front of shoreline (Figure 3a). During lowstand period, shorelines and facies belts prograde basinward (south) and canyons develop, observed from the rms amplitude map which serve as a conduit for the deposition of deep water sand on the slope and at the base of the slope (basin floor) (Figure 3a). This mechanism is interpreted to have led to transportation and deposition of potentially considerable amount of sandstones basinward during the lowstand period in all the interpreted sequences. Seismically, the deep water sandstones is characterised by mounded and prograding reflection patterns with higher amplitudes than the surrounding much-rich sediment.
From all the lowstands GDE maps, it has been inferred and interpreted that, in some places in the distal areas where high amplitude deposits were observed the deposit are similar to those observed at the base of the slope. This interpretation of the amplitudes is coupled with the observed seismic reflections patterns which are mounded and fairly continuous prograding reflection pattern. Where these potential basinal sandstones are interpreted (distal part), possible feeder channel systems and canyons are inferred to originate shelf ward of the basinal sandstone (Figures 3a, 4a, 5a and 6a). However, due to the extent of the data, it is difficult to show the direct relationship between the high amplitude bodies, interpreted to be channelized sandstones on the slope and the similar reflection characteristics on the basin floor in the distal part of the survey.
Following the lowstand period, marine flooding occurred during the TST across the shelf and most of the incisions on the shelf that have been filled by continental deposits, were transgressed and overlain by upper shoreface sandstones, lower shoreface and eventually prodelta/ basinal deposits. Subsequently, the HST deposits prograde back into the basin (Figure 3b).
Depositional sequence 2
This lowstand period, characterised by relative sea level fall, resulted in incisions cutting into the underlying continental deposits of Sequence 2 (Figure 4a). This sea level fall is observed to have fallen below the shelf break and deposition of mouth bar deposit and upper shoreface sandstones are interpreted in front of the shoreline. During this lowstand period, shorelines and facies belts prograde basinward, and canyons transport potentially considerable amount of sand basinward (Figure 4a).
The following highstand system tract is characterised by rising relative sea level (flooding) and most of the incisions on the shelf that have been filled by continental deposits were also transgressed and overlain subsequently by upper shoreface sandstones, lower shoreface and eventually deeper water prodelta/basinal deposits (Figure 4b).
Depositional sequence 3
A major regression occurred across much of the area during this lowstand period. This period is characterised by several deep incisions across the shelf. This suggest there is a pronounced relative sea level fall resulting in erosion of the shelf edge These incisions/canyons acted as sand conduits and transportation of sand into deep water with sandstones deposited on the slope and within the basin floor (Figure 5a).
The highstand period follows an initial marine transgression that causes the shelf to be flooded. Subsequently, the HST deposits prograde back into the basin (Figure 5b).
Depositional sequence 4
Depositional sequence 4 evolution is similar to the sequence 3 described above. Major regression characterised the period of lowstand with several incisions cutting across shelf area (Figure 6a). This suggests there is a pronounced relative sea level fall resulting to incision into the shelf edge.
As observed from sequence 3, highstand relative sea level period is defined by marine transgressions that cause the shelf to be flooded and most of the incisions formed during lowstand period that have been filled by continental deposits, were transgressed and overlain by upper shoreface sandstones, lower shoreface and eventually prodelta/basinal deposits. Subsequently, the HST deposits prograde back into the basin (Figure 6b).
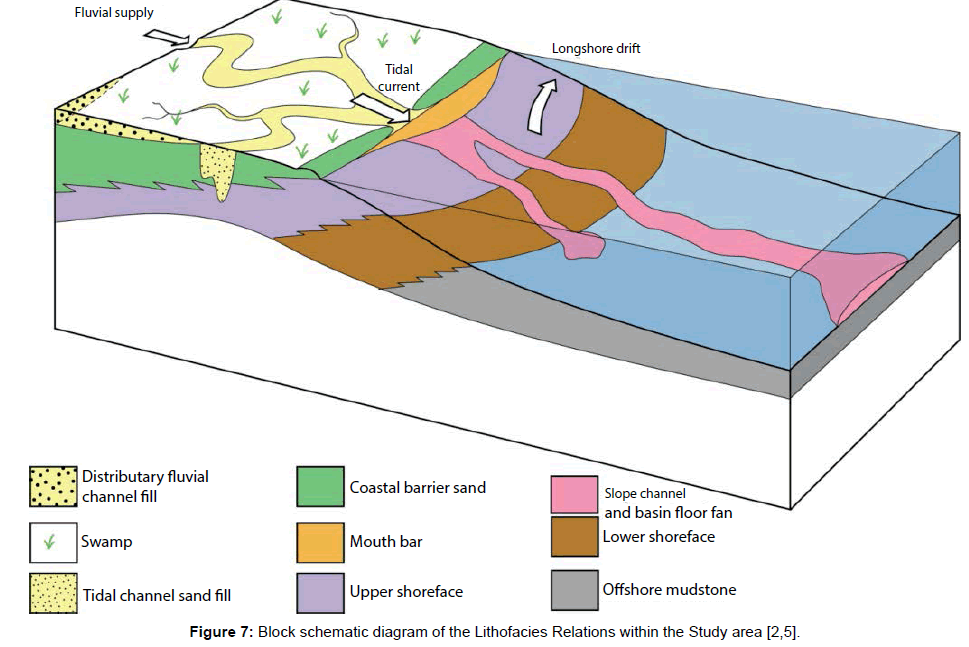
Summary of facies model of the study area is presented in Figure 7. Widespread of incisions indicate a rapid and strong progradation during the lowstand period which suggest that during LST times most of the area was periodically subaerially exposed. This has led to the development of incisions/canyons within the shelf and slope. These canyons acted as a sand feeder that led to the deposition of deep water sands on the slope and within the basin floor.
Discussion
Interpretations and descriptions of depositional sequences suggest that most sequence boundaries are eroded by sea level lowstand incision of the shelf, coupled with increased shelf instability and slope collapse structures. Patterns of sequence erosion occur both on the footwalls and hanging walls (but deeper mostly in the hanging wall) and deposits thickens across downthrown fault blocks, suggesting that most of these faults were active during the middle Miocene time of Agbada Formation deposition. The restriction of lowstands system tract deposits to within the valley fills across the entire study area, and the occurrence of deep incisions, suggests that the entire shelf region became periodically subaerially exposed during the successive relative sea level falls.
Observations from the sequence analysis show that throughout sequence development within the study area, the shelf margin has been controlled also by growth faults which have migrated basinward through time (Figures 3-7). In a case where the shelf margin is being controlled by growth faults, one of the processes of transporting sand into the basin is shelf collapse, with resultant slumping. However, there is an observed reduction in the upward propagation of faults. This may be due to changes in sediment deposition rates and fluvial discharge locations causing minor faults to become buried and truncated; fault segmentation and differential displacement on adjacent segments. Sedimentation patterns suggest that faulting, local incision and HST clinoform geometry dominate the formation of depocentres across the shelf.
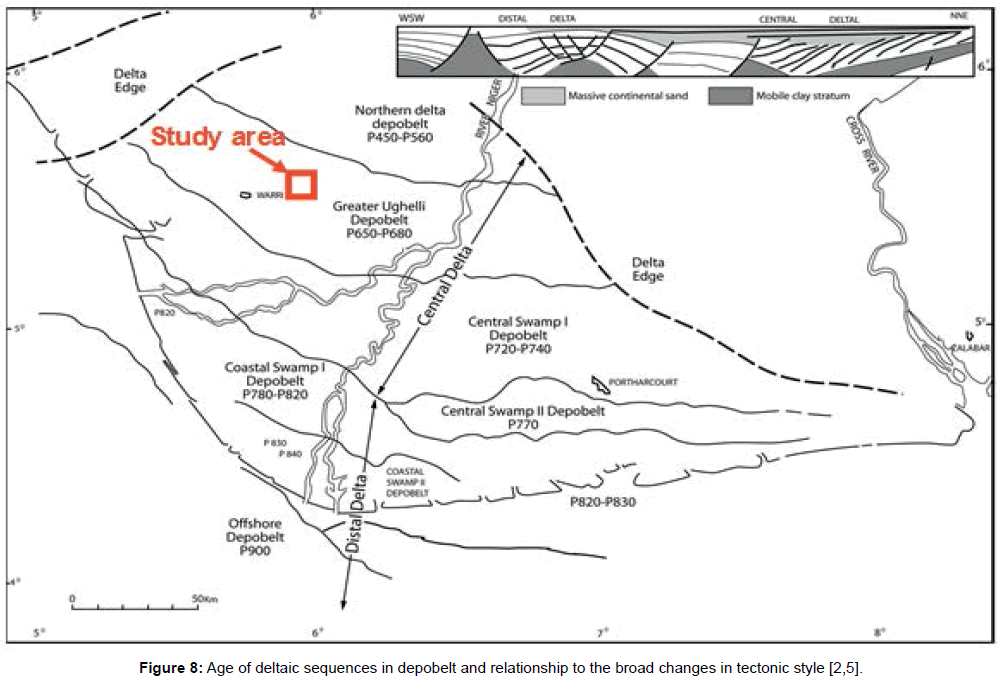
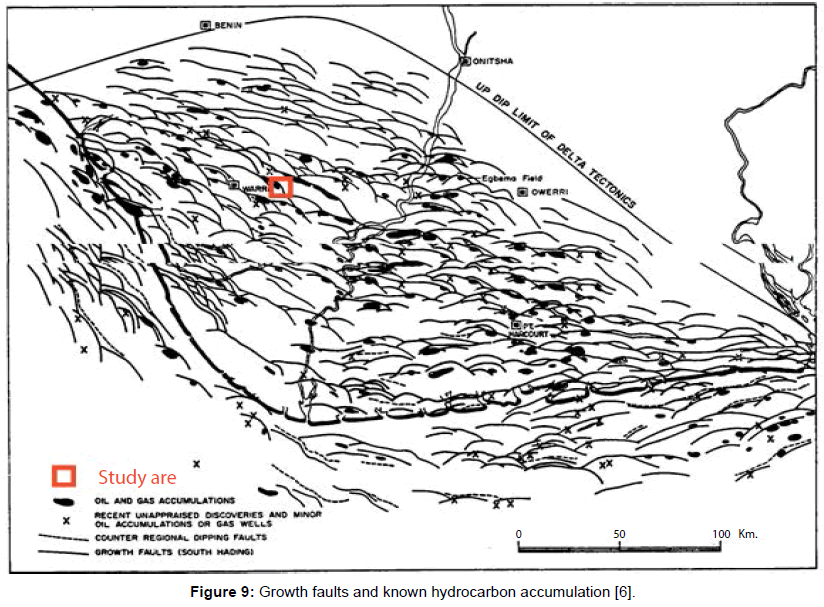
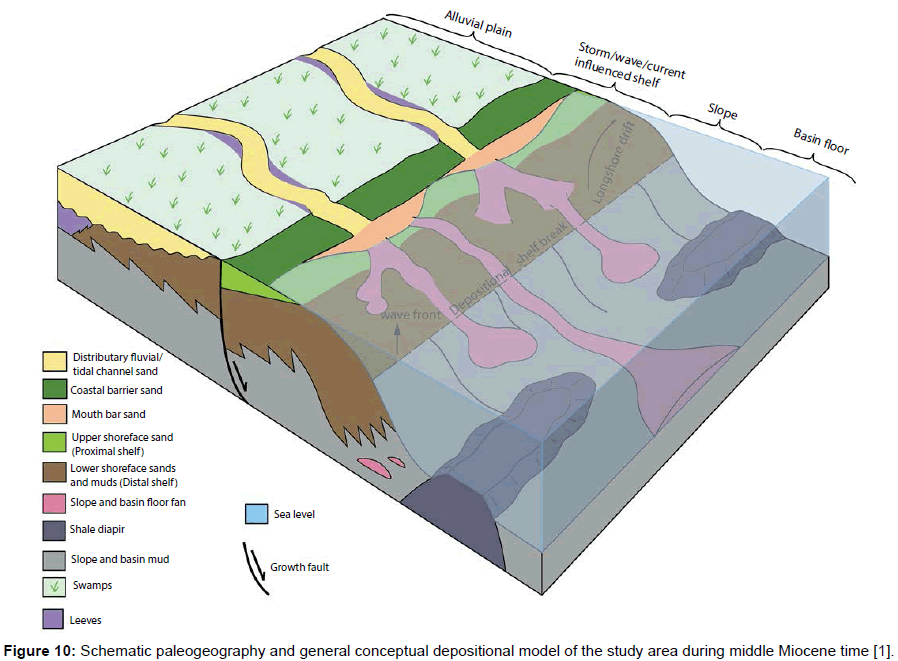
Previous work showed that each depobelt is parallel to the modern coastal belt in which has been distinguished by their ages and are defined by sedimentary faults (Figure 8). Modern faults are observed to be parallel to these regional depobelts and the present day facies belts (Figures 8 and 9). Structural analysis of the study area shows a different local facies belt orientation versus the growth faults and the depobelts, which is very different from the present day orientation and relationship. Evidence from this study presented in the GDE structural maps shows that local facies belts are oblique to the regional depobelt (Figures 8-10) and often oblique to the interpreted growth faults. This observation suggests that the ancient coastal belt of the delta is more lobate /arcuate than the modern Niger delta. The delta became broadly convex to the sea during the late Miocene [2].
The overall strong progradational character of the study area as evidenced from the overall seismic geometry, prograding of shoreline break as observed from GDE maps, and dip line section at the proximal part. They are interpreted to reflect a long time decrease in accommodation triggered by a combination of tectonic uplift of the north-western Niger delta and the middle Miocene eustatic fall [2-6]. Increase in the proportion of sandstone relative to mudstone up section within the study area clearly also shows long-term progradation and graduation from the paralic Agbada formation into continental sand Benin Formation.
Conclusion
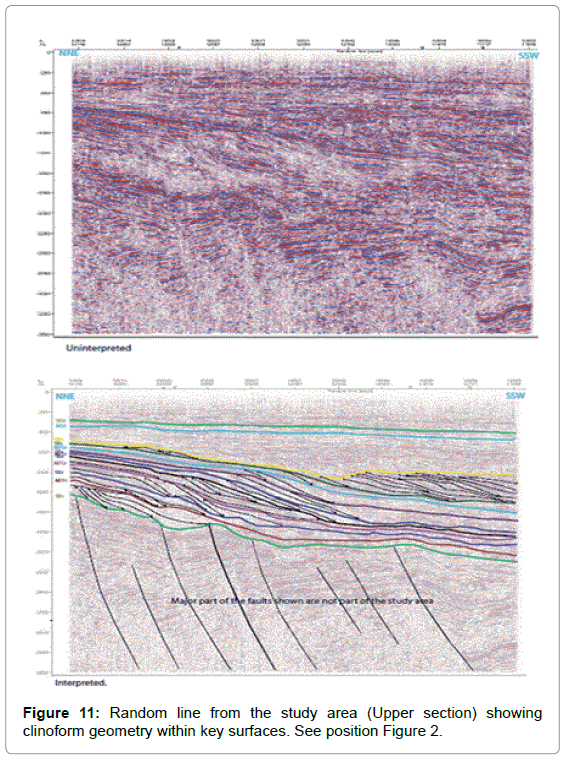
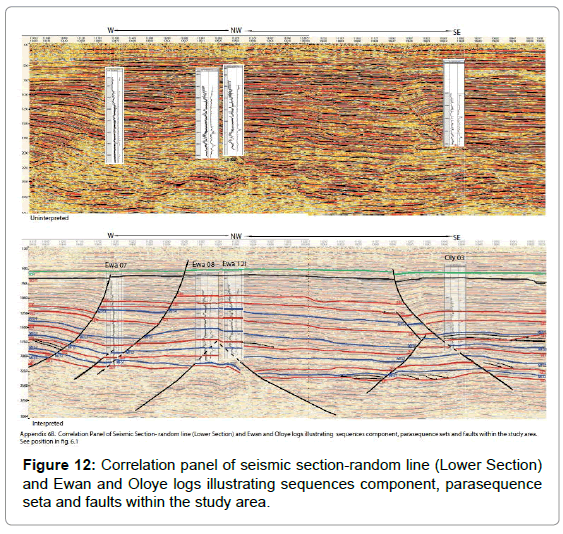
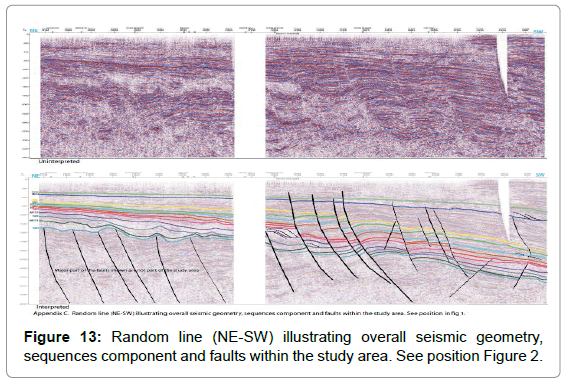
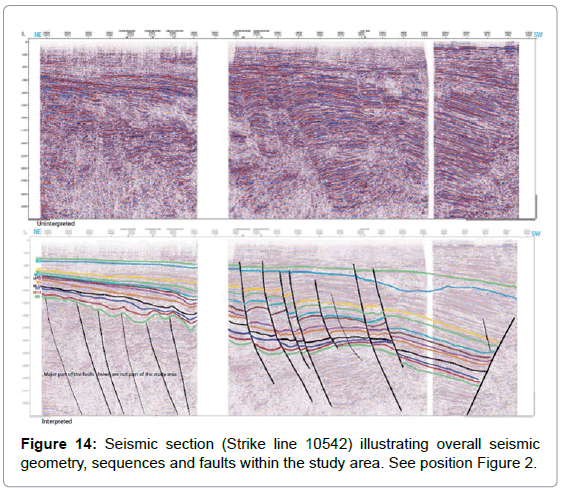
Detailed sequence stratigraphic analyses showed that the middle Miocene-early Pliocene strata in the Ewan and Oloye fields of the northwestern Niger delta consist of six depositional sequences (Figures 11-16) [1]. During lowstand period, shorelines and facies belts prograde basinward (south) and there are a development of canyons which serve as a conduit for high amplitude deposit (deep water sand) on the slope and within the basin floor. This mechanism is interpreted to have led to the deposition of considerable amount of sandstones basinward.
Sequences developed within the middle Miocene in the study area are interpreted to be controlled locally by episodic shelf instabilility, basin physiography (shelf edge), fault growth and linkage. Relative sea level changes provide the major control on sequence development and deep valley incisions. The latter have a strong geomorphological impact on the area and a strong control on sequence variability. Interpretation of GDE maps shows that sands were originally deposited in riverand mouth bars with longshore drift currents redistributing the sand parallel to the shoreline. During lowstand periods, canyons developed which served as conduits for sand to the basin (deep water sand), recognized as high amplitude seismic facies on the slope and on the basin floor.
Idealized schematic palaeogeography and general conceptual depositional models of the study area during middle Miocene time are presented in Figures 7 and 10.
References
- Durogbitan AA (2010) Seismic Sequence Stratigraphic and Structural Analysis of Ewan and Oloye Fields J marine Sci Res Devop 6: 197.
- Allen JRL (1965) Late Quaternary Niger delta, and adjacent areas-sedimentary environments and lithofacies: AAPG Bull 49: 547-600.
- Doust H, Omatsola E (1990) Niger Delta in JD Edwards and PA Santogrossi (eds) Divergent/Passive Margin Basin AAPG 48: 201-238.
- Northwestern Niger Delta(Middle Miocene). PhD Thesis unpubl. Earth Science Department, The University of Manchester p: 337.
- Oomkens E (1974) Lithofacies relations in the Late Quaternary Niger Delta complex. Sedimentology 21: 195-222.
- Whiteman AJ (1982) Nigeria: Its petroleum geology, resources and potential. London, Graham &Totman 1: 166.
Relevant Topics
- Algal Blooms
- Blue Carbon Sequestration
- Brackish Water
- Catfish
- Coral Bleaching
- Coral Reefs
- Deep Sea Fish
- Deep Sea Mining
- Ichthyoplankton
- Mangrove Ecosystem
- Marine Engineering
- Marine Fisheries
- Marine Mammal Research
- Marine Microbiome Analysis
- Marine Pollution
- Marine Reptiles
- Marine Science
- Ocean Currents
- Photoendosymbiosis
- Reef Biology
- Sea Food
- Sea Grass
- Sea Transportation
- Seaweed
Recommended Journals
Article Tools
Article Usage
- Total views: 12443
- [From(publication date):
August-2016 - Mar 31, 2025] - Breakdown by view type
- HTML page views : 11558
- PDF downloads : 885

