Research Article Open Access
Sensitivity and Specificity of Otoacustic Emissions in Newly Healthy Births without Risk Factors
Berlanga Bolado OM1*, Vázquez PR2, Martínez Carmona RB3, Ortega Tamez LC4, Flores Nava FL5 and Fernández Jaso IV61Division of Pediatrics, Regional Hospital of High Specialty of Ciudad Victoria, Tamaulipas, Mexico
2Department of Hospital Administration and Management, General Hospital of Ciudad Victoria, Mexico
3Medical Pediatrician Neonatologist, Regional Hospital of High Specialty of Ciudad Victoria Tamaulipas, Mexico
4Neurologist Pediatrician, Regional Hospital of High Specialty of Ciudad Victoria, Mexico
5Licensed in Nursing, Auditory Sieve Area, General Hospital of Ciudad Victoria, Mexico
6Department of Audiológa, Regional Hospital of High Specialty of Ciudad Victoria, Mexico
- *Corresponding Author:
- Bolado OMB
Pediatrician Neonatologist
Head of Division of Pediatrics of the Regional Hospital of High Specialty of Ciudad Victoria
Tamaulipas, Mexico
Tel: 8341593547
E-mail: berlangabolado@hotmail.com
Received date: July 20, 2016; Accepted date: August 07, 2016; Published date: August 17, 2017
Citation: Berlanga Bolado OM, Vázquez PR, Martínez Carmona RB, Ortega Tamez LC, Flores Nava FL, et al. (2017) Sensitivity and Specificity of Otoacustic Emissions in Newly Healthy Births without Risk Factors. Neonat Pediatr Med 3: 133. doi: 10.4172/2572-4983.1000133
Copyright: © 2017 Berlanga Bolado OM, et al. This is an open-access article distributed under the terms of the Creative Commons Attribution License, which permits unrestricted use, distribution, and reproduction in any medium, provided the original author and source are credited.
Visit for more related articles at Neonatal and Pediatric Medicine
Abstract
Introduction: The World Health Organization reports an incidence of hypoacusis of 5/1000 live births; 2.1% of the world population suffers from a hearing deficit. In Mexico, the Human Communication Institute of the Ministry of Health estimates that 5,600 are born with hearing loss per year. Undiagnosed hearing loss has adverse effects on language, social, emotional, cognitive, academic and professional development. Objective: To verify the sensitivity and specificity of Hearing Otoacoustic emissions in healthy newborns without risk factors. Material and Methods: Prospective study with a probabilistic, descriptive, transversal, quasi experimental and analytical design. We studied 815 healthy newborns without risk factors. EOA and Brainstem Auditory Evoked Potentials were performed with the BERAphone equipment. Sensitivity, specificity, Negative Predictive Value and Positive Predictive Value were determined, using the ROC curve. The AUC value was determined, Pearson’s X2 test was used, and Fisher’s Exact Test was used for the distribution of both tests. Results: 1630 auditory tests were performed. A sensitivity of 63.64% and a specificity of 98.95%, an AUC of 0.805%, VPP 29.17% and VPN 99.75%, LH +60.60% and LH -0.37% of all the tests were detected. The right ear had a sensitivity of 40.0% and a specificity of 98.64%; In the left ear sensitivity of 83.33% and specificity of 99.26%. Conclusions: Otacoustic emissions in newborns without risk factors have a regular sensitivity and high specificity.
Keywords
Hearing loss; Deafness; Otoacoustic emissions; Evoked potentials; Auditory sieve; BERAphone.
Introduction
Hearing loss is one of the most frequent causes of disability, And it is important to take into account that it is a sensory deficiency whose disabling potential depends to a great extent on the early diagnosis and to establish treatment and rehabilitation [1]. Delaying the identification of hearing loss in children not only has severe effects on speech, language development, social skills, academic progress, psychological status, and future job opportunities, But also has consequences for members of the family mainly in the economic aspect [2,3].
The World Health Organization (WHO) reports an incidence of hearing loss of 5 per 1000 live births; It is estimated that 2.1% of the world population suffers from some hearing deficit. According to the WHO global disease burden index for the year 2000, hearing loss is ranked fifteenth [4].
The average age reported in the diagnosis varies in different studies. Yoshinaga-Itano, et al. mention an average age of 20.2 months [2]. Harrison, et al. found that mean age in children with loss of Severe hearing is at 13 months and those with mild hearing loss are at 22 months [5]. The population with hearing loss has doubled from 120 million to at least 278 million people in 2005, two thirds of this population resides in developing countries [6].
In Mexico, the Institute of Human Communication of the Secretary of Health (INCH) estimates that 5,600 hearing impairs are born per year. The hearing disability statistics for the year 2000 amounted to 281,793 people, of whom 16.2% were at birth. In 2010 it was estimated that 25% of the population suffers from some type of deafness. It also reports that less than 35% of children receive medical care. The incidence of hearing loss disability in the age group of 0 to 4 years is 498,640 (11.01%) of the total population with a disability [7].
In order to meet and respond to this public health problem in the country, within the framework of the National Development Plan and Health Sector Program 2007-2012, the Neonatal Auditory Sieve and Early Intervention Program was designed, endorsed by the following standards: NOM 173-SSA l-1998, for comprehensive care for the hearing impaired [8].
Currently available technology has reliable techniques for the objective evaluation of hearing. Fully automated portable equipment has been developed that can be operated by personnel with minimal training. The most commonly used techniques are otoacoustic emissions (EOA) and brainstem auditory evoked potentials (PEATC) [9].
Hearing loss is the most common birth defect and occurs more frequently than other conditions, is 100 times more prevalent than phenylketonuria and 10 times more than hypothyroidism is 5 times more frequent than Down Syndrome and 25 times more than spina bifida. Permanent hearing loss during childhood occurs in 1-3 of every 1000 infants, and in 2-4 of every 100 infants discharged from neonatal intensive care units [10].
The importance of the health problem in childhood that deafness implies has been valued by national and international scientific bodies and societies. Universal Neonatal Auditory Screening is a valuable strategy for detecting newborns with permanent hearing damage, using both EOA and PEATC. The latter with a higher sensitivity (97-100%) and greater specificity (86-96%), which is why they are considered the gold standard for detection of hearing loss. However they prove to be a complex and costly method [10].
Currently in our environment (community) otoacoustic emissions are performed as part of neonatal screening for hearing loss, however there are no reports in our institution about the prevalence, sensitivity and specificity of this test [11].
To carry out systematic screening studies in the open population, it is necessary to know if the sensitivity and specificity of this test can be reproducible in our environment. In addition, we have reported very different rates of sensitivity and specificity, ranging from 67% to 100%, depending on the study, which leads us to ask whether the incidence of newborns diagnosed with hearing loss is the real one, and if It would not be necessary to ask how many of these children are staying without a timely diagnosis and early rehabilitation [12].
Therefore, our objective was to know the sensitivity and specificity of otoacoustic emissions in healthy newborns without risk factors.
Material and Methods
The present investigation was carried out through a prospective study with a probabilistic, descriptive, transversal, quasi experimental, analytical and multicentric design. The study population was all newborns in the High Specialty Regional Hospital of Ciudad Victoria “Bicentenario 2010” (HRAEV) and in the General Hospital Norberto Treviño Zapata of Victoria, during the period from April to the month November 2016. For the sample size we used the formula proposed by Dufau, With an alpha error (Zα) at 5% and a beta error (Zβ) at 10% [13].
Selection criteria
The inclusion criteria for the study were as follows: Healthy newborns with gestational age between weeks 37 and 41.6, weighing between 2500 and 3999 grams, and born in the Hospital Regional High Specialty of Ciudad Victoria “Bicentenario 2010” and the General Hospital of Ciudad Victoria “Dr. Norberto Treviño Zapata”. Newborns of both sexes, normal otoscopy, consent of the parents to participate in the study.
Exclusion criteria: Newborns with craniofacial and/or congenital malformations of the ear, with a family history of hearing loss and deafness, and with risk factors namely: obtained by dystocic birth, perinatal asphyxia, jaundice and admission to the Neonatal Intensive Care Unit.
Elimination criteria: Abnormal otoscopy, interference from ambient noise.
General description of the study
After explaining the purpose of the procedure and signing the informed consent by the parents, an otoscopy is performed on healthy newborns who come to the auditory screen. Otoscopy was performed by otolaryngologist by otoscopy to rule out the presence of cerumen, debris and alterations in the tympanic membrane.
Otoacoustic emissions were performed in healthy newborns between the third and fifth day of extrauterine life in the preventive medicine office, during physiological sleep in the arms of their mother or in a screening bed with closed doors to reduce environmental noise.
After passing the above procedure, the Transient Evoked Otoacoustic Emissions Test (EOET) is performed by the OTO Read denmark Num-0123 for EOA [14].
A hearing aid was placed in the external auditory canal, ensuring that there was a tight seal between the auditory wall and the device. The frequencies of 2kHz, 3kHz and 4kHz were studied, as they were involved in the production of language, at an intensity between 40 and 70 decibels (dB) in each ear. If at the end of reading the 3 frequencies on the screen the word “pass” is displayed, it means that the newborn has normal hearing or if the display shows the word “to control”, it means that the newborn can have hearing loss greater than 40 dB.
After the otoacoustic emissions the brainstem auditory evoked potentials were realized with the BERAphone equipment: MB-11 Beraphone this system can be used advantageously with the automatic test ABR Fast-Steady State, automatic fast reliable; Thanks to the FSS-ABR algorithm, the MB-11 BERAphone test is similar to that of otoacoustic emissions, stimulus signals are applied with a high repetition rate (90 clicks per second): the test is performed sequentially until reaching a value Critical (pass criterion) Because the stimulus level is 35 dB of hearing (HL), the ear evaluated may have a hearing threshold above 35 dB HL and the result will be referred to, when 100% of the criterion Step is not reached within 120/s. thanks to the FSSABR system (Fast Steady State) Rapid Stable State (ABR) Auditory Brainstem Response, patented algorithm [15-17].
The equipment was placed on the head of the newborn, the first electrode below the earlobe, the second electrode above the ear and the third electrode on the vertex (three fingers above the ear at the midline). The impedance test shows if the electrodes are making good contact with the skin (signal). After this the measurement is started and a green light is observed on the BERAphone which indicates a suitable signal. On the computer screen the electrical signal of the electrodes in wave form was recorded, reporting the following results: It registered green and the word step (if you hear); Register red and the word refer (not hear). In any of these cases, he/she is informed to his/her relatives, if the result is to refer (not hear) to the otolaryngologist, audiologist, rehabilitation, auditory rehabilitation and early stimulation [15].
Statistical treatment
The information was captured in a database prepared in the statistical package Service Pack Statistic Software (SPSS) version 21 for Windows, CEBM Statistics Calculator, Diagnostic test calculator (version 2010042101) by Alan Schwartz 2006. Core trend measures were calculated, Used inferential statistics through contingency tables to determine sensitivity, specificity, positive and negative predictive value with 95% CI. The cut-off points for sensitivity and specificity were established using the Receiver Operating Characteristics (ROC) curve. Also, the value of the Area Under Curve (AUC) was determined to evaluate The overall accuracy index. Pearson’s Chi-Square and Fisher’s exact test were used to analyze the association of both tests [18-21].
Results
815 newborns without risk factors were studied, 409 were males, corresponding to 50.2%, 406 (49.8%) were females. With respect to weight, the average was 3347.94 grams (grs), with a median of 3310 grs, and a standard deviation of 401,337 grs (Table 1). The histogram presented central distribution and a variation between 2500 and 5500 grams (Figure 1).
| Description Weight | Weight (gr) | |
|---|---|---|
| Mean | 3347.94 | |
| Median | 3310 | |
| Mode | 3300 | |
| Typical Deviation | 401.337 | |
| Percentiles | 25 | 3050 |
| 50 | 3310 | |
| 75 | 3620 | |
N: number of patients; gr: grams.
Source: SPSS V.20 database of the study: Sensitivity and Specificity of Otoacoustic Emissions in Healthy Newborns without Risk Factors.
Table 1: Descriptive statistics of weight in grams of all the newborns studied (N=815).

Figure 1: Histogram of the entire population of new borns studied.
Gestational age is presented in Table 2, with a mean of 39.31, a standard deviation of 1.06 and the histogram (Figure 2) shows a central distribution (39.31), with values varying between 37 and 44 weeks.
| Description SDG | SDG | |
|---|---|---|
| Mean | 39.3155 | |
| Median | 39.29 | |
| Mode | 39 | |
| Typical Deviation | 1.06611 | |
| Percentiles | 25 | 38.67 |
| 50 | 39.29 | |
| 75 | 40.09 | |
SDG: Gestational Age Weeks
Source: SPSS V.20 database of the study: Sensitivity and Specificity of Otoacoustic Emissions in Healthy Newborns without Risk Factors.
Table 2: Descriptive statistics of the entire population of newborns studied by gestational age.

Figure 2: Histogram of gestational age of all infants studied.
The age of extrauterine life in which the hearing tests were taken (Table 3), the mean was 5.13 days with a standard deviation of 4.7 days and a median of 4.35 days, the distribution was tendency towards the left side and with Values from 1 to 60 days (Figures 2 and 3).
| Description | Age in days | |
|---|---|---|
| Mean | 5.13 | |
| Median | 4.35 | |
| Mode | 4 | |
| Typical Deviation | 4.702 | |
| Percentiles | 25 | 3.52 |
| 50 | 4.35 | |
| 75 | 5.22 | |
EOA: Otoacoustic Emissions
Source: SPSS V.20 database of the study: Sensitivity and Specificity of Otoacoustic Emissions in Healthy Newborns without Risk Factors.
Table 3: Descriptive statistics of the entire population of newborns studied by age on days when EOA was taken.

Figure 3: Histogram of age in days of all newborns studied.
The total distribution of patients (n=815), with 1630 ears studied, are presented in the flowchart (Figure 4) of all newborns with both tests - Otoacoustic Emissions (EOA) and Auditory Evoked Brainstem Potentials (BERAphone/PEATC) - as well as the final result “pass” or “do not pass” (Figure 4). Only 0.24% of patients had involvement in both ears.

Figure 4: Flow chart of all newborns in both tests and all ears.
When comparing EOA vs BERAphone in Table 2, in the right ear (Table 4) we detected that 5 patients did not pass the test of total newborns. Therefore we confirmed as true positives 2 patients, 3 false negatives, 11 false positives and 799 true negatives (Table 4 and Figure 5).
| BERAphone (PEATC) | |||
|---|---|---|---|
| EOA | Not passed | Pass | Totalears |
| Not passed | 2 | 11 | 13 |
| Pass | 3 | 799 | 802 |
| Total | 5 | 810 | n=815 |
EOA: Otoacoustic Emissions.
BERAphone Cerebral Stem Auditory Evoked Potentials.
n: Number of ears studied.
Source: SPSS V.20 database of the study: Sensitivity and Specificity of Otoacoustic Emissions in Healthy Newborns without Risk Factors.
Table 4: Contingency table or table 2X2 of EOA vs. BERAphone right hearing.

Figure 5: Distribution of OIDOS RIGHTS studied and the identification of deaf and healthy as well as false positives, false negatives, true and true negatives.
Figure 6 shows the likelihood ratio in the Fagan nomogram in the right ear confirming that the pos-test test for positive result is 18% with a margin of 5 to 40% and for negative result is 0.61% with A variability between 0.4 to 0.8%.

Figure 6: Nominal fagan right ear with EOA vs. BERAphone.
Table 5 shows the statistical data and results of each of the tests: Sensitivity, Specificity, Positive likelihood ratio (LR +) and Negative (LR-), Estimated Prevalence, Positive Predictive Value (PPV), and Value Negative predictive (VPN) in the right ear.
| Statistic | Formula | Value | 95% CI |
|---|---|---|---|
| Sensitivity |  |
40.00% | 5.27% to 85.34% |
| Specificity |  |
98.64% | 97.58% to 99.32% |
| Positive Likelihood Ratio |  |
29.45 | 8.67 to 100.12 |
| Negative Likelihood Ratio |  |
0.61 | 0.30 to 1.24 |
| Disease prevalence |  |
0.61% | 0.20% to 1.43% |
| Positive Predictive Value |  |
15.38% | 1.92% to 45.45% |
| Negative Predictive Value |  |
99.63 % | 98.91% to 99.92% |
EOA: Otoacoustic Emissions.
BERAphone: Cerebral Stem Auditory Evoked Potentials.
CI: Confidence Interval.
Source: SPSS V.20 database of the study: Sensitivity and Specificity of Otoacoustic Emissions in Healthy Newborns without Risk Factors.
Table 5: RIGHT OID statistics results with EOA vs. BERAphone.
The global representation of the diagnostic accuracy in the right ear of otoacoustic emissions can be seen in the ROC curve, the points indicate the cutoff point that determines Sensitivity and Specificity (Figure 7). The value of the Area Under Curve (AUC) was also determined to evaluate the overall accuracy index of the test (Table 7).

Figure 7: ROC curve demonstrating the sensitivity and specificity of EOA in right ear.
| Variables contrast result | ||||
|---|---|---|---|---|
| Area | Error típ | Sig. Asymptotic | Asymptotic confidence interval at 95% | |
| Lower limit | Upper limit | |||
| 0.693 | 0.148 | 0.136 | 0.404 | 0.983 |
Source: SPSS V.20 database of the study: Sensitivity and Specificity of Otoacoustic Emissions in Healthy Newborns without Risk Factors.
Table 6: Area under the right hear curve
| Statistical Testing | Value | Statistical Significance |
|---|---|---|
| Pearson Chi-square | 47.273 | p=0.000 |
| Continuity correction | 25.86 | p=0.000 |
| Fisher’s exact test | p=0.002 | |
| Linea-by-linear association | 47.215 | p=0.000 |
| Number of cases | 815 |
EOA: Otoacoustic Emissions.
BERAphone: Cerebral Stem Auditory Evoked Potentials.
Source: SPSS V.20 database of the study: Sensitivity and Specificity of Otoacoustic Emissions in Healthy Newborns without Risk Factors.
Table 7: Statistical tests of EOA vs. BERAphone RIGHT HEAR.
In Table 8, we represent the statistical tests to see the distribution of our test, with the following result: a Pearson X2 with a statistical significance of p=0.000, a Fisher’s Exact Test with a value of p=0.002.
| BERAphone (PEATC) | |||
|---|---|---|---|
| EOA | Not passed | Pass | Total ears |
| Not passed | 5 | 6 | 11 |
| Pass | 1 | 803 | 804 |
| Total | 6 | 809 | n=815 |
EOA: Otoacoustic Emissions.
BERAphone: Cerebral Stem Auditory Evoked Potentials.
Source: SPSS V.20 database of the study: Sensitivity and Specificity of Otoacoustic Emissions in Healthy Newborns without Risk Factors.
Table 8: Contingency Table or 2x2 Table of Otoacoustic Emissions vs. BERAphone.
In the left ear is presented the Table 2 where the “gold standard”, BERAphone vs Otoacoustic Emissions (EOA) is presented. We can see that of the total number of patients studied (n=815), 6 did not pass the test and 809 did pass it’ (Figure 8 and Table 8).

Figure 8: Distribution of left ears studied and identification of deaf and healthy as well as false positives, false negatives, true and true negatives.
In the Fagan nomogram (Figure 9) of the left ear for positive result has a post-test probability of 46% and for a negative result a pos-test probability of 0.14. The statistics of the results for left ear, namely: Sensitivity, Specificity, LR+, LR- Prevalence, PPV and NPV, are presented in Table 9. More accurately and unrelated to prevalence, a sensitivity of 83.33% and a specificity of 99.26% were found in the ROC Curve. Figure 9, with an AUC precision of 0.913 (Table 10). And with a p=0.00 of the Pearson Chi-Square, and a value of p=0.000 for the Fisher’s Exact Test, and a continuity correction of 246,250 and a value of p=0.000 (Table 11). When all the tests (n=1630) were analyzed, all patients (n=815) in Table 2X2 showed that 11 patients did not pass the test and 1619 if they passed it (Table 12), with True Positives 7, False Negatives 4, False Positives 17, and True Negatives 1602 (Figures 10 and 11).

Figure 9: Nominal fake ear left with EOA vs. BERAphone result pre-test and pos-test, aswell as Likelihood Ratio.

Figure 10: COR curve of EOA vs. BERAphone, accuracy of Sensitivity and Specificity in newborns LEFT EAR.

Figure 11: Distribution of ALL HEARTS studied and identification of deaf and healthy as well as false positives, false negatives, true and true negatives.
| Statistic | Formula | Value | 95% CI |
|---|---|---|---|
| Sensitivity |  |
83.33% | 35.88% to 99.58% |
| Specificity |  |
99.26% | 98.39% to 99.73% |
| Positive Likelihood Ratio |  |
112.36 | 46.89 to 269.22 |
| Negative Likelihood Ratio |  |
0.17 | 0.03 to 1.00 |
| Disease prevalence |  |
0.74% | 0.27% to 1.60% |
| Positive Predictive Value |  |
45.45% | 16.75% to 76.62% |
| Negative Predictive Value |  |
99.88 % | 99.31% to 100.00% |
EOA: Otoacoustic Emissions
BERAphone: Cerebral Stem Auditory Evoked Potentials
CI: Confidence Interval
Source: SPSS V.20 database of the study: Sensitivity and Specificity of Otoacoustic Emissions in Healthy Newborns without Risk Factors.
Table 9: LEFT EAR statistics with EOA vs. BERAphone
| Variables contrast result | ||||
|---|---|---|---|---|
| Area | Error típ. | Sig. Asymptotic | Asymptotic confidence interval at 95% | |
| Lower limit | Upper limit | |||
| 0.913 | 0.090 | 0.000 | 0.737 | 1.000 |
EOA: Otoacoustic Emissions
BERAphone: Cerebral Stem Auditory Evoked Potentials
Source: SPSS V.20 database of the study: Sensitivity and Specificity of Otoacoustic Emissions in Healthy Newborns without Risk Factors.
Table 10: Area under the Curve in EOA vs. BERAphone LEFT HEAR
| Statistical Testing | Value | Statistical Significance |
|---|---|---|
| Pearson Chi-square | 305.127 | p=0.000 |
| Continuity correction | 246.250 | p=0.000 |
| Fisher’s exact test | p=0.000 | |
| Linea-by-linear association | 304.753 | p=0.000 |
| Number of cases | 815 |
EOA: Otoacoustic Emissions.
BERAphone: Cerebral Stem Auditory Evoked Potentials.
Source: SPSS V.20 database of the study: Sensitivity and Specificity of Otoacoustic Emissions in Healthy Newborns without Risk Factors.
Table 11: Statistical tests of EOA vs. BERAphone LEFT EAR
| BERAphone (PEATC) | |||
|---|---|---|---|
| EOA | Not passed | Pass | Total ears |
| Not passed | 7 | 17 | 24 |
| Pass | 4 | 1602 | 1606 |
| Total | 11 | 1619 | n=1630 |
EOA: Otoacoustic Emissions.
BERAphone: Cerebral Stem Auditory Evoked Potentials.
n: number of ears studied.
Source: SPSS V.20 database of the study: Sensitivity and Specificity of Otoacoustic Emissions in Healthy Newborns without Risk Factors.
Table 12: Table of contingency or table 2x2 of EOA vs. BERAphone of all ears and all patients.
In the Fagan Nomogram for the study of all ears, a pos-test test of 30% and a negative test result of 0.3% with an LR + of 60.60 and an LR- of 0.37 were evaluated for a positive result. Is shown in Figure 12.

Figure 12: Nominal fake everyone with EOA vs. BERAphone.
The statistical results of all tests (n=1630) Sensitivity, Specificity, LR +, LR-, Prevalence, PPV and NPV are presented in Table 13. And with more precision in Figure 13, in the ROC test we observed a Sensitivity of 63.64% and a Specificity of 98.95%. And in Table 14 the AUC curve with a result of 0.805. Table 15 presents the statistical tests for the Pearson Chi-Square with a p=0.000, a Continuity Correction of 253,440 with p=0.000 and a Fisher’s Exact Test of p=0.000.

Figure 13: COR curve of EOA vs. BERAphone, accuracy of sensitivity and specificity in newborns in all ears and all patients.
| Statistic | Formula | Value | 95% CI |
|---|---|---|---|
| Sensitivity |  |
63.64% | 30.79% to 89.07% |
| Specificity |  |
98.95% | 98.32% to 99.39% |
| Positive Likelihood Ratio | 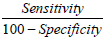 |
60.60 | 31.62 to 116.15 |
| Negative Likelihood Ratio | 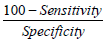 |
0.37 | 0.17 to 0.80 |
| Disease prevalence |  |
0.67% | 0.34% to 1.20% |
| Positive Predictive Value |  |
29.17% | 12.62% to 51.09% |
| Negative Predictive Value |  |
99.75 % | 99.36% to 99.93% |
EOA: Otoacoustic Emissions.
BERAphone: Cerebral Stem Auditory Evoked Potentials.
CI: Confidence Interval.
Source: SPSS V.20 database of the study: Sensitivity and Specificity of Otoacoustic Emissions in Healthy Newborns without Risk Factors.
Table 13: Results of ALL EACH AND ALL PATIENTS studied with EOA vs. BERAphone.
| Variables contrast result | ||||
|---|---|---|---|---|
| Area | Error típ. | Sig. Asymptotic | Asymptotic confidence interval at 95% | |
| Lower limit | Upper limit | |||
| 0.805 | 0.106 | 0.003 | 0.593 | 1.000 |
EOA: Otoacoustic Emissions.
BERAphone: Cerebral Stem Auditory Evoked Potentials.
Source: SPSS V.20 database of the study: Sensitivity and Specificity of Otoacoustic Emissions in Healthy Newborns without Risk Factors.
Table 14: Area Under the Curve of all ears and all patients studied with EOA vs. BERAphone
| Statistical Testing | Value | Statistical Significance |
|---|---|---|
| Pearson Chi-square | 295.005 | p=0.000 |
| Continuity correction | 253.440 | p=0.000 |
| Fisher’s exact test | p=0.000 | |
| Linea-by-linear association | 294.824 | p=0.000 |
| Number of cases | 1630 |
EOA: Otoacoustic Emissions.
BERAphone: Cerebral Stem Auditory Evoked Potentials.
Source: SPSS V.20 database of the study: Sensitivity and Specificity of Otoacoustic Emissions in Healthy Newborns without Risk Factors.
Table 15: Statistical tests of EOA V/S BERA phone of all ears and all patients.
Discussion
The need to identify hearing problems at birth and to ensure diagnosis and intervention before the age of six months is recognized as an international health standard [13]. Currently, more countries have implemented universal hearing screening programs that evaluate all [22]. This has been made possible by reliable tests for objective hearing assessment and the development of more accurate, fully automated portable equipment that require personnel with minimal training [22]. The most commonly used tests are Otoacoustic Emissions (EOA) and Brainstem Auditory Evoked Potentials (PEATC: BERAphone). Both tests have a high sensitivity and specificity to detect early hypoacusis in the newborn [22].
Clinical follow-up studies have shown that the equipment and technology currently available for the neonatal auditory sieve allow the identification of most affected patients. However, there are still some problems to be solved, in particular, the techniques used could be improved [23]. For example, OAEs are less efficient in assessing newborns with risk factors where there is a higher incidence of hearing problems And diseases with auditory neuropathy can be detected. Additionally, a high false positive rate is recognized in its application, many of which are due to transient conductive losses [24].
In these cases, it is recommended to repeat the test several times or to combine it with a PEATC test (BERAphone), with the disadvantage of increasing the false negatives. This last one plays a preponderant role in underdeveloped countries and especially in communities of very low resources, with economic and emotional repercussion in the family, reason why in Mexico it has been reported that more than 90% of pediatric patients attended by hearing problems, Were not detected early and timely [25,26].
The methodology recommended in the various programs of neonatal auditory screening is a sequential protocol based on the exploration of the newborn with EOA and/or PEATC (BERAphone). Undoubtedly one of the most relevant advantages of its implementation for clinical use of EOA was to facilitate the development of such programs for children hearing loss since it is the first time that available technology was available and applicable to a large group of patients. However, all these protocols are conditioned to the technological evolution causing a great demand in the development of the automated equipment of EOA. Subsequently, the emergence of automated PEATC (BERAphone) equipment, which is easy to use and rapid to diagnose, has led to the preferential use of these equipment [25-27].
Currently there is a large amount of literature that compares the effectiveness and efficiency of these two tests and usually gives validity to both. Traditionally, the advantages of EOA are greater speed and lower cost, ease of use, high sensitivity and specificity. The disadvantages attributed to PEATC are, on the contrary, a longer time in its realization and greater cost. However, PEATC has currently shown a high percentage of accuracy, even in premature infants, and a lower referral rate has been confirmed with PEATC-based programs, although a statistically significant difference has not been demonstrated [25-28].
The implementation of a universal neonatal auditory screening program has been uneven, the reasons are diverse and the most relevant factors involved is the need to invest a large amount of economic resources. In fact, universal hearing aid programs with EOA are closely linked to a constant economic evolution [29].
Therefore, in our project, we confirmed the poor sensitivity and very high specificity of OAEs in the healthy newborn without risk factors, using the PEATC (BERAphone) as the gold standard.
Since the discovery of OAE, a large number of studies have been carried out to support its validity in the identification of hearing loss of the newborn, to improve its accuracy taking into account the sensitivity, specificity, positive predictive value and negative predictive value. These studies have been able to confirm its usefulness as a screening test in different programs for the early detection of congenital deafness, but the recurrent drawback is the large number of false positives, and when implementing the program it is necessary to do it in two stages with the consequent Loss of patients [30-32].
The sensitivity of OAE using PEATC as gold standard has been reported with significanqt variability according to the different authors, Jacobson and Jacobson, detected a very low sensitivity. Their study screened 119 newborns, 67 high-risk and 52 normal, between 33 and 41 weeks of gestational age, in the nursery and neonatal special care unit, where they propose to compare the results of OAE with the auditory response (ABR). These authors confirmed that the ABR study failed in 8 of 224 ears (3.8%) and 85% (38.4%) of the tests failed for EOA. In addition they find a sensitivity of 50% and a specificity of 52%. When measuring the noise level they detect more than 30 decibels (dB). The final result of their study supports that the existing noise level in hospitals exceeds the recommended level for the implementation of the auditory sieve with the implementation of EOA. Therefore it influences the result and the sensitivity. In our study, although the overall sensitivity of all ears was 63.64%, we believe that noise was not affected, although no environmental noise measurement was performed, both tests were performed in a noise-free office with presence of The mother, the baby and the nurse who performed the study, and the EOA team did not report any noise. In the study by John, et al. other factors influence: prematurity and risk factors in the newborn [12].
In the Rhode Island study in the 1990s, 1991, universal neonatal screening was performed on 1850 infants, 497 (27%) did not pass, the first stage and were scheduled for the second stage 4 to 6 weeks later, and only 403 (81%) come. Of the 403, 115 did not pass the second stage corresponding to 23.1% of the second group. When comparing EOA vs PEATC between the first and fourth day, OAE had a sensitivity of 81% and a specificity of 70%; Four to six weeks later sensitivity increased to 96% and specificity to 82%. With this it can be deduced that the age is an important factor in the result of the sensitivity since to realize it in two stages improves the performance of the test. Factors that could influence the first stage may be experience of the person doing the study, vermix in the auditory canal, and maturity of the middle ear, as demonstrated in the Rhode Island study. In our study, each of the screened patients was evaluated for both ears to confirm their permeability, so we believe that this is not a factor of sufficient weight that is affecting the results as was verified by Berlanga and Cols [11,33]. We think that there are more factors involved and that we should not forget that it could also be secondary to the presence of retrocochlear hearing loss, so it could be a false negative, since OAE measures cochlear function and permeability to Sound of the middle and outer ear without affecting the mechanics of the peripheral sensory organ. When the evaluation of the test is performed according to the patient’s follow-up and the occurrence or not of deafness, instead of the PEAT, the sensitivity of the test offers variations in the result, with consequent loss of patients [34,35].
Vohr, et al. from 1993 to 1996 in Rhode Island in the universal hearing screening program gives a follow-up of 53121 infants in 2 stages for 4 years, assessing reference ranges, reference diagnoses, age and identification: detect 111 infants with hearing loss with one Range of 2 × 1000, the mean age confirmed was 3.5 months. They observed in the first stage 95% sensitivity and in the second 95%, specificity was in the first and second stage of 89.9% and 87% respectively. They conclude that time and experience are important factors in the implementation of the auditory sieve, with punctual follow-up of each patient. This information confirms the high sensitivity of OAE in two stages affecting the cost and family economy, as well as the increase in the loss of patients, without forgetting the emotional impact on the family, although it is important to emphasize that our study was only At a stage precisely to avoid the problems mentioned above. It is important to note that patients who detected that they did not pass the BERAphone test were each followed up with the multidisciplinary hospital team [34].
Stevens, et al. performed a hearing screening of 723 neonates in the neonatal intensive care unit, who underwent ABR with a duration of 21 minutes and EOA with duration of 12.1 minutes in 1990. For him, both tests are adequate for the sieve, being the EOA faster, more sensitive and cheaper. The rate of failure by OAEs is explained by the lower stimulus used. It concludes that the sensitivity is 76% and the specificity of 86% when comparing them with ABR in a single stage but when compared to three months the sensitivity increases to 93%. This is contrary to our study since in doing so in a single stage the sensitivity is low although the specificity is very high which confirms that when using the BERAphone as the most important test we could discover earlier patients with possible hearing loss and Thus avoiding losses of patients and to be able to initiate in a timely manner the rehabilitation of this type of patients to avoid future sequels. It also confirms that the cause of alterations in OAEs is multifactorial in the first stage and detecting them early would help to rule out or support the presence of deafness in this patient [31].
In the Colorado program: Mehl and Thomson, they conducted a multi-stage, 8-year study to measure hospital participation and general Universal hearing screening in a state program and track improvements in programmaking and outpatient follow-up over time. They evaluated 57 hospitals using ABR, three hospitals with OAE, and two with two-stage screening considering hypoacusis at a threshold of 35 dB. 148 240 newborns were evaluated, 291 were diagnosed as congenital hearing loss with 71% bilateral loss, hearing loss 82%, with 47% of one or more factors. Then, in 1999, 63327 newborns were studied before hospital discharge, 87% (55324) were evaluated for auditory acuity, a higher percentage in the first year than during the 5 years of the study (19%). The result of this was to detect 86 newborns affected during 1999 represented an occurrence of 1 in 650 neonates. In this group 59 patients presented bilateral sensorineural hearing loss, 17 unilateral 4 conductive bilateral hearing loss and 6 unilateral hearing loss. The total of referrals in that year was 2.3% with a 2.2% false positive; Of newborns who failed 76% had congenital deafness. The mean of the diagnosis was 2.1 months and 71% of those affected were identified at 3 months of age and 92% at 5 months. They also observed that according to the size of the hospital according to the number of births per year, in the larger hospitals the recapture of patients was higher and in small hospitals the reference was higher. The sensitivity was 100%, and they found no false negatives. They conclude that the successful implementation of neonatal auditory screening depends on the educational effort of the health professional in the community, commitment by the program planning group, and a good data tracking system.
Contrary to our study where we found the lowest sensitivity and they were very high because each patient was followed up for eight years, with the implementation of EOA in two stages but with significant losses of patients between one and Another stage which further supports our study to implement programs in a single stage with PEATC (BERAphone), which show very high accuracy with minimal false negatives and zero patient loss, which results in less economic cost and less emotional impact in the family. It is also important to emphasize that they used the ABR (model ALGO-2 and ALGO-1E) which increased the results in the sensitivity. They did not detect false negatives all cases were progressive hypoacusis, therefore they did not meet the inclusion criteria in the definition of congenital neurosensorial hearing loss [32].
Finitzo, et al. studied 54,228 newborns in Texas to assess values that had a positive or negative impact on the auditory screening program. They used three different protocols: EOA, ABR and EOA followed by ABR, from 1994 to 1997. At the end of the study, 52508 infants were screened before hospital discharge; 1,224 patients returned to followup; 113 of them failed the examination detected As sensorineural loss, two cases with progressive hearing loss and one case with deep bilateral severe hypoacusis considered as false negative, with an estimated incidence of 3.14 × 1000 newborns. They conclude that the reduction of false negatives can be achieved when three elements are used, namely: participation of audiology, hospital support and information management. They also suggest that follow-up measures need to be improved especially in newborns with risk factors. Contrary to our study, which was only done in one stage by screening all patients, they monitored it over time which increased sensitivity, decreased false positives and practically only one case was false negative. All these types of programs with a large amount of financial resources, personnel involved and technology used increase the loss of patients (they lost 31% of the total number of newborns sifted), increases the emotional tension in the parents and the Cost per patient increases with important repercussions in the family and therefore affects the sensitivity of the study. With the technological advances in the automated equipment to design hypoacusia in the newborn has improved the precision with the important decrease of form false positives and smaller loss of patients. Although in our study the objective we pursue is not to follow the patients, but to know the sensitivity and specificity in a single stage, to each of our patients who left with hearing loss was followed up, for this reason the results and the report of these patients would be presented in another investigation [30].
OAEs constitute a simple and inexpensive rapid test, and for some time were considered the most adequate test for universal care and risk groups, using Cerebral Stem Auditory Evoked Potentials (PEATC) to a small group that did not pass the EOA [36]. The specificity of the OAEs with respect to the “gold standard” PEATC varies according to different publications, from the point of view of the number of false positives they report, and increases the complexity of the OAE-based screening programs. 52% by Jacobson, et al. [12]; 86% by Stevens, et al. [31], 89.9% by Vohr, et al. [33] to 92% reported by Lutman, et al. [35] very different from what We found a specificity of 98.95% and 1.04% of false positives, so it is considered a useful test for the universal auditory sieve. These results can be consequence of multifactorial origin to be: trained personnel, evaluation of the auditory canal by otorhinolaryngologist before the study, time in which the EOA is taken in the first stage.
In 1993 the NCIHS (National Institute of Health Consensus Statement) confirmed that OAE in neonates has a tendency to increase false positives when compared to PEATC, especially during the first 48 hours of life. These false positives are of the newborns with lower risk of presenting congenital hearing loss, which have a lower incidence. When we compared it with our results, we reported 1% of false positives for all ears, the mean age of test implementation was 4 days and a very high specificity (98.95%), so we thought that the factors that influence specificity Could be reduced by cross-sectional studies with PEATC (BERAphone) and well-structured follow-up programs [37].
Mehl, et al. provide valuable information in the studies of Colorado with 96% and Rhode Island of 98% of specificity, performed both in several stages and long-term follow-up in contrast to our study that was carried out in a single stage implementing both tests, thus avoiding The losses of patients that are very high in the aforementioned studies. We used the PEATC (BERAphone) to increase accuracy and avoid false positives with multidisciplinary follow-up to suspected patients. They reported very high specificities for the long-term follow-up that they used in their protocols [32,34].
Other authors such as Kennedy, et al. reported up to 30% of false positives in children with craniofacial malformations or family history of deafness and 13% of low risk neonates and admission to the Neonatal Intensive Care Unit (NICU) factors that influence the presence of false positives. Contrary to our research we screen newborns without risk factors and this report would open up a new investigation [38].
False positives can also be explained by ear immaturity in the neonate of less than 48 hours of life, such that EOA, are not necessarily detected in all healthy newborns of this age, detail that we care in our research and Which we believe did not influence the outcome of the study [39,40].
Levi, et al. in a group of 13 infants less than 2 days old, found that OAEs failed; Found that with the simple cleaning of the ear, room in complete silence and sleep of the baby, OAE were detected and passed the test in such a way that they conclude that these simple measures diminished the false positives, procedure that we implemented in each of the newborns Sieved in our study and confirmed by Berlanga et al. [11,40]
Another of the statistical tests that is usually altered in this type of studies is the “Positive Predictive Value (PPV)”, defined as the probability of a population studied, that a newborn has to suffer from congenital hearing loss when the test is positive. The studies by Bess and Paradise [41] confirm that PPV may be affected by sensitivity and specificity values, although it is highly dependent on the actual prevalence of congenital deafness in the population of screened newborns. Although their report has been heavily criticized for estimating 1/1000 prevalences, creating a very exaggerated estimate of all the derivations generated, Northern and Hayes [42] found a higher population prevalence of 6/1000, taking into account children with factors Risk and without them. Contrary to our study, researchers have reported values up to 2% or less, we detected a PPV of 29.17%, taking a prevalence of 6/1000. We think that it could be influenced, not only by the prevalence, but also by the sensitivity and specificity of the test.
“Negative Predictive Value (NPV)” is defined as the probability that the newborn of a given population has normal hearing when the test result is negative. It depends heavily on the characteristics of the test in terms of sensitivity and specificity, but is also influenced by the prevalence of the disease. In the literature, very high results are reported, similar to them, our results report a NPV of 99.75%, confirming that OAEs have a great value in hearing screening tests in large populations [31,34,35].
In our study there is a problem to solve, we detected a better sensitivity in the left ear 83.33% than in the right ear 40%. At the moment there is controversy between the different authors with respect to the ear that is most affected; The truth is that this discrepancy continues, some report that the response of the right ear is better than the left ear and others that there is no difference. Marco [43], Collet [44], Johnsen [45], Probst [46] argue that there is a high visual correlation between the EOA of the ears of the same person, therefore the frequency spectrum of intensity are similar. Other authors such as Sequi [47] find differences of non-significant laterality and that can be provoked by technical questions, Aidan [48] confirms differences in the mean intensity of OAEs in the right ear of neonates with respect to the left ear. Trinidad, et al. [49] detected a better response in the right ear than the left one, as did Berlanga, et al. [11] who report about 1% more that passed in the right ear than the left, justified by greater ease In the placement of the probe of the OtoRead team, which has been related to being right-handed and more sensitive than the left ear and with a higher prevalence of OAE without statistical significance [50-52]. Contrary to our study, the ear Had better sensitivity was the left ear. We do not rule out the possibility that it was random, it could also be related to the type of study performed or the technology used or the personnel who performed the test, but certainly we do not have a convincing explanation, although we rely on that could be a line Research for a future and is definitely not the goal of this project.
It has also been reported by some authors some biological variables in the newborn reported as electrical alterations in the brain stem in response to auditory stimuli, this is considered as a reproducible phenomenon however there is a group of neonates who do not present this response at birth, But if a few weeks later it has been reported that this is due to the lack of maturation of the neuronal tissue in the brain stem, which could explain most of the cases of false positives [53,54].
The usefulness of a diagnostic test is the likelihood ratio or coefficient of likelihood (LH), its value is not affected by the characteristic prevalence that allows comparisons in different diagnostic tests of our results. It was confirmed that, for a positive value of the test, it has a 60% chance of confirming deafness, thus failing about 40%; And for a negative result, the probability that the test fails is very low (0.37) and assures 98.64% that our newborns do not have deafness. This was also confirmed by the results obtained in the ROC curve, which is also not influenced by the prevalence, minimizes the occurrence of false positives, which is associated with a high emotional and economic cost, since patients could merit the repetition of The test is not necessary at all, as few of them are possibly affected. In addition, the implementation of the ROC curve also decreases the number of false negatives. False negatives are a serious problem in clinical management and especially when it comes to hearing loss or deafness, since the opportunity to give the newborn effective treatment in the initial stages is lost. From the results obtained by these diagnostic tests we can confirm that OAEs are a good regular test and with the advent of new technology the PEATC (BERAphone) will be added to the diagnostic arsenal and be able to replace this type of tests [27].
Although many problems remain to be solved the purpose of our study is not for any reason to affect the EOA, since they are complementary tests in the diagnosis of deafness of the newborn.
The BERA phone is a simple, easy, fast, valid and reliable test that explores the auditory pathway from the receiving organ to the entrance in the brain, making it an ideal test to be used In a neonatal screening program. The average duration is 1 to 3 minutes, depends a lot on the equipment used, if we take into account the information to the parents, transfer of newborns, electrodes placed and especially the precision in the result. The BERA phone is an ideal equipment for this type of screening. This test can be performed in the first hours of life of the newborn without altering its validity, in contrast to OAE, whose sensitivity and specificity decrease if performed within the first 24 hours. In the Gabbard study [55], 97% of newborns with 24 hours of extrauterine life were able to pass with PEATC while 67% did so with OAE. This becomes very relevant in underdeveloped countries or communities of very low resources where distances are far away, when hospitals maintain early discharge programs in the healthy newborn or early maternal high on the same day this short stay of the neonate in the hospital Will be the time of accessibility to the program [56]. In Europe, half of the countries have a universal neonatal hearing screening program, active sieve programs with coverage of 92 to 95% of newborns are reported. In England they currently report an average of 2 months of age. In Mexico, a coverage of 57% of the total number of newborns is reported in Mexico. Important barriers to implementation were identified in this country, such as: Limited resources, inadequate support services, poor public awareness, Otoneurology, Fonatria, graduates in human communication therapy, Otorhinolaryngologists. In addition, hearing loss in the health field has been considered a low priority. By 2014, the Secretary of Health says that in our country, we have provided a portable EOA kit to perform a hearing screening test for 455 hospitals and the creation of 45 audiology services in each of the states for the diagnosis and management of Children with hearing loss [27], with serious failures in their current functioning. Institutional experience shows that more than 90% of pediatric patients attended due to hearing problems were not detected in an early and timely manner and did not receive adequate in-hospital follow-up. This is very relevant in underdeveloped countries and/or communities with very scarce resources. Therefore, it is urgent to redouble efforts, improve the generation of campaigns and educational programs for hearing health, as well as follow up the tests of universal neonatal hearing screening, with the purpose of early diagnosis avoiding the delay in acquisition and language development, learning problems and socialization among patients who are born with hearing impairment.
Conclusions
Otacoustic emissions in neonates without risk factors have a regular sensitivity and high specificity, with failures to detect deafness in the first stage of the program, which implies difficulties in their optimization for the detection of deafness and hearing loss. This means that the test must be repeated and therefore increase the additional consumption of resources with the risk of saturating the diagnostic services. Another important aspect is to assess the parents’ concern about confirming the diagnosis in a subsequent phase, as well as the loss of patients and the economic cost to the family, which is very relevant in our community.
References
- Ferreira R, Basile L, Munyo A, Anazo G (2003) Emisiones otoacústicas en recién nacidos con factores de riesgo auditivo. Arch Pediatr Urug 74: 197-202.
- Yoshinaga Itano C, Aruzzo ML (1998) Identification of Hearing loss after age 18 months is not Early Enough. Am Ann Deaf 143: 380-387.
- Jafari Z, Malayeri S, Ashayeri H (2007) Las edades de sospecha, diagnóstico, amplificación e intervención en el niño hipoacúsico. Int J Pediatr Otorhinolaryngol 71: 35-40.
- Detección de hipoacusia en el recién nacido; México: Secretaria de Salud; 2008. Disponible: www.cenetec.salud.gob.mx/interior/gpc.html revisado el 04/12/16.
- Harrison M, Roush J (1996) Age of Suspicion, Identification and Intervention of Infant and young children with Hearing loss: A National Study. Ear Hear 17: 55-62.
- Olusanya BO, Wirz SL, Luxon LM (2008) Hospital based universal newborn hearing screening for early detection of permanent congenital hearing loss in Lagos, Nigeria. International Journal of Pediatric Otorhinolaryngology 72: 991-1001.
- Solis AE, Valle Valenzuela M (2001) Detección con emisiones otoacústicas de trastornos de audición en recién nacidos de alto riesgo. An Soc Mex Otorrinolaringol 46: 115-120.
- Sandoval M, Iglesias J, Silva H, Frid J, Rendón M (2012) Frecuencia de hipoacusia neonatal en un hospital privado. Tamiz auditivo. Rev Mex Pediatr 79: 174-178.
- Mijares E, Herrera D, Gaya J, Santos E, Pérez M, et al. (2011) Cribado auditivo neonatal con potenciales evocados auditivos de estado estable a múltiples frecuencias. Acta Otorrinolaringol Esp 62: 87-94.
- Uribe R, Alfaro A (2012) PPATC y EOAT en infantes de 9 a 24 meses posteriores al screening neonatal 1: 18-24.
- Berlanga O, Sotelo M, Rivera P, Avalos E, Moreno V, et al. (2013) Tamiz Auditivo Neonatal (fase II). Factores que pueden influir en el resultado de las emisiones otoacústicas en el recién nacido sano. El tiempo es decisivo? Evid Med Invest Salud 6: 113-119.
- Jacobson ST, Jacobson CA (1994) The efects of noise intransiente EOAE Newborn Hearing screening. Int J Pediatr Otorhinolaryngol 29: 235-248.
- Gastón T (1998) Tamano muestral en el estudio sobre pruebas diagnósticas. Rev Child Pediatr 69: 122-125.
- http://manualzz.com/doc/4670808/otoread
- http://www.maico-diagnostics.com/am/products/abr/mb-11-beraphone/
- Martínez R, Condado BJM, Morais D, Fernandez J (2003) Resultados de aplicar durante 1 año un protocolo universal de detección precoz de la hipoacusia en neonatos. Acta Otorrinolaringol Esp 54: 309-315.
- Neumann K, Gall V, Berger R. Newborn Hearing screening in Hessen, Germany. A pilot project. Int Pediatr 16: 109-116.
- García J, López J, Jiménez F, Ramírez Y, Lino L (2014) Metodología de la investigación, bioestadística y bioinformática en ciencias médicas y de la salud. Mc Graw Hill Education, México 23: 67-74; 261-278.
- Alvarez H, Perez E (2009) Utilidad Clínica de la tabla 2x2. Rev Eviden Invest Clin 2: 22-27.
- Altman D (1991) Practical Statistics for medical research. Chapman& Hall/CRC. London. Pp: 403-405.
- Cerda J, Cifuentes L (2012) Uso de la curva ROC en investigación clínica. Aspectos teórico-practico. Rev. Chil Infect 29: 138-141.
- Trinidad G, Alzina V, Jaudenes C, Nunez F, Sequi J (2010) Early Hearing Detection and Intervention: 2010 CODEPH Recommendation. Acta Otorrinolaringol Esp 61: 69-77.
- Méndez M, Gutiérrez I, Arch E (2003) Manifestaciones conductuales por las cuales se sospecha de hipoacusia en niños. An Med Asoc Med Hosp ABC 48: 199-203.
- Eras Z, Konukseven O, Aksoy H, Canpolat F, Genç A, et al. (2014) Postnatal risk factors associated with hearing loss among high-risk preterm infants: tertiary center results from turkey. Eur Arch Otorhinolaryngol 271: 1485-1490.
- Guastini L, Mora R, Dellepiane M, Santomauro V, Mora M, et al. (2010) Evaluation of an automated brainstem response in a multi-stage infant hearing screening. Eur Arch Otorhinolaryngol 267: 1199-1205.
- Lino-González AL, Castañeda-Maceda MV, Mercado-Hernández I (2015) Arch-Tirado E. La educación para la salud auditiva en México. ? problema de salud pública? Tamiz Auditivo Neonatal Universal. Rev Meg AMCAOF 4: 65-70.
- Gastón Dufau T (1998) Tamano muestral en el estudio sobre pruebas diagnósticas. Rev. Child. Pediatr 69: 122-125.
- Urdiales J, Iglesias E, López I, Vázquez G, Piquero J (2003) Revision de los métodos de screening en hipoacusias. BOL PEDIATR 43: 272-280.
- Granell J, Gavilanes J, Herrero J, Sanchez-Jara JL, Velasco MJ (2008) Cribado universal de la hipoacusia neonatal: es más eficiente con potenciales evocados auditivos que con emisiones otoacusticas? Acta Otorrinolaringol Esp 59: 170-175.
- Finitzo T, Albright K, O’Neal J (1998) The Newborn With Hearing Loss: Detection in the Nursery. Pediatrics 102: 1452-1460.
- Stevens JC, Webb HD, Hutchinson J, Connell J, Smith MF, et al. (1990) Click Evocked Otoacustic Emissions In Neonatal Screening. Ear and Hearing 11: 128-133.
- Mehl AL, Vickie-Thomson MA (2002) The Colorado Newborn Hearing Screening Project, 1992-199: On the Threshold of Effective Population-Based Universal Newborn Hearing Screening. Pediatrics 109: 1-8.
- Vohr BR, White KR, Brancia Maxon A, Johnson MJ (1993) Factors Affecting the Interpretation of Transient Evoked Otoacustic Emissions Results in Neonatal Hearing Screening. Sem Heart 14: 57-72.
- Vohr BR, Carty L, Moore PE, Letourneau K (1998) The Rhode Island Hearing Assessment Program: Experience with statewide hearing screening. The Journal of Pediatrics 133: 353-357.
- Lutman ME, Davis AC, Fortnum HM, Wood S (1997) Field sensitivity of targeted neonatal hearing screening be transient-evoked otoacustic emissions. Ear Hear 18: 265-276.
- Delgado J (2011) Grupo PrevInfad/PAPPS Infancia y Adolescencia. Detección precoz de la hipoacusia infantil. Rev Pediatr Aten Primaria 13: 279-297.
- Paradise JL (1999) Universal Newborn Hearing Screening: Should we leap before we look? Pediatrics 103: 670-672.
- Kennedy C, Kimm L, Dees D, Evans P, Hunter M, et al. (1991) Otoacustics emission and auditory brainstem responses in the newborn. Arch Dis Child 661: 1124-1129.
- National Institutes of Health Consens Statement (1993) Early Identification of Hearing Impairment in Infants and Young Children 11: 1-24.
- Levi H, Adelman C, Geal-dor M, Elidan J, Eliashar R, et al. (1997) Transient Evoked Otoacustics Emissions in Newborn in the First 48 hours after Birth. Audilogy 36: 181-186.
- Bess F, Paradise J (1994) Universal Screening for Infant Hearing Impairment: Not Simple, Not Risk-Free. Not Necessarily Beneficial, and Not Presently Justified. Pediatrics 93: 330-334.
- Northern JL, Hayes D (1994) Universal screening for infant hearing impairment: necessary, beneficial and justifiable. Audiology today.
- Marco J, Pitarch M, Moranr A (1996) Diagnóstico precoz de la hipoacusia en la infancia. Acta Otorrinolaring. Esp 47: 255-257.
- Collet L, Moulin A, Gartner M, Morgon A (1990) Age-related changes in evoked otoacustic emissions. Ann Otol. Rhinol. Laryngol 99: 993- 997.
- Johnsen N, Bagi PPJ, Elberling C (1988) Evoked acoustic emissions from the human ear IV. Final Results in 100 neonates. Scand Audiol 17: 27-34.
- Probst R, Lonsbury-Martin BL, Martin GK, Coats AC (1987) Otoacoustic emissions in ears with hearing loss. Am J Otolaryngol 8: 73-81.
- Sequi J, Brines J, Paredes C, Mir B, Marco J (1995) Otoemisiones acústicas evocadas en recién nacidos sanos. Anales Españoles de Pediatría 42: 280-284.
- Aidan D, Lestang P, Avan P, Bonfils P (1997) Characteristics of Transient-evoked Otoacoustic Emissions (TEOEs) in Neonates. Acta Otolaryngol (Stockh) 117: 25-30.
- Trinidad-Ramos G, Pando-Pinto J, Vega-Cuadri A, Serrano-Berrocal M, Trinidad-Ruiz G, et al. (1999) Early detection of hearing loss in neonates using transient evoked otoacoustic emissions. An Esp Pediatr 50: 166-171.
- Macfadden D (1993) Speculation about the parallel ear asymmetries and sex differences in hearing Sensitivity and Otoacustic Emissions. Hear Res 68: 143-151.
- Denia L, Lombardo P (2009) Detección diagnostico y tratamiento precoz de la sordera en la infancia. Acta del simposio internacional celebrado en la fundación roman areces. German trinidad ramos 25-52.
- Jerger J, Martin J (2004) Hemistheric Asymmetry of the right ear advantage in dichotic listening. Hear Res 198: 125-136.
- Marco J, Matéu (2003) Libro blanco sobre hipoacusia. Detección precoz de la hipoacusia en recién nacidos: Capitulo V: Técnicas de Screening de la audición. Capitulo B: Parentes Arias P, Martínez Morán Alejandro, García Carrera Belen: Potenciales Evocados Auditivos de Tronco Cerebral Automatizado. Madrid, pp: 104-105.
- Elssmann S, Matkin N, Sabo M (1987) Early identification of congenital sensorineural hearing impairment. The Hearing Journal 40: 13-17.
- Gabbard S, Northern J, Yoshinaga-Itano C (1999) Hearing Screening in newborns under 24 hours of age. Sem Hearing 20: 291-305.
- Mijares N, Pérez-Abalo M, Savio-López G (2006) Metodología de pesquisaje de las pérdidas auditivas a edades tempranas. Revista electrónica de audiología 3: 9-18.
Relevant Topics
- About the Journal
- Birth Complications
- Breastfeeding
- Bronchopulmonary Dysplasia
- Feeding Disorders
- Gestational diabetes
- Neonatal Anemia
- Neonatal Breastfeeding
- Neonatal Care
- Neonatal Disease
- Neonatal Drugs
- Neonatal Health
- Neonatal Infections
- Neonatal Intensive Care
- Neonatal Seizure
- Neonatal Sepsis
- Neonatal Stroke
- Newborn Jaundice
- Newborns Screening
- Premature Infants
- Sepsis in Neonatal
- Vaccines and Immunity for Newborns
Recommended Journals
Article Tools
Article Usage
- Total views: 4386
- [From(publication date):
December-2017 - Apr 04, 2025] - Breakdown by view type
- HTML page views : 3541
- PDF downloads : 845