Research Article Open Access
Sensitive LC-MS/MS Method for the Simultaneous Determination of Alogliptin and Voglibose in Human Plasma
Hemavathi G* and Hipparagi SM
Department of Pharmaceutical Chemistry, KLE’s College of Pharmacy, Bangalore, Karnataka, India
- *Corresponding Author:
- Hemavathi G
Department of Pharmaceutical Chemistry
KLE’s College of Pharmacy
Bangalore, Karnataka, India
Tel: +919916059429
E-mail: hema28cology@gmail.com
Received Date: February 28, 2017 Accepted Date: March 15, 2017 Published Date: March 20, 2017
Citation: Hemavathi G, Hipparagi SM (2017) Sensitive LC-MS/MS Method for the Simultaneous Determination of Alogliptin and Voglibose in Human Plasma. J Anal Bioanal Tech 8: 354. doi: 10.4172/2155-9872.1000354
Copyright: © 2017 Hemavathi G, et al. This is an open-access article distributed under the terms of the Creative Commons Attribution License, which permits unrestricted use, distribution, and reproduction in any medium, provided the original author and source are credited.
Visit for more related articles at Journal of Analytical & Bioanalytical Techniques
Abstract
Sensitive LC-MS/MS (Liquid Chromatography Tandem Mass Spectrometric) Method for the Simultaneous Determination of Alogliptin and Voglibose in human plasma. A highly sophisticated and sensitive LC-MS/MS method has been developed and validated for the Alogliptin and Voglibose simultaneous determination in human plasma. Alogliptin D3 and Miglitol were used as IS (Internal standard). Protein precipitation extraction was followed for the analytes and IS. Chromatography conditions included an isocratic mobile phase composing of 5 mM Ammonium formate: Acetonitrile in the ratio 50:50 v/v. The column used was Welchrom XB C18, with specifications of 50 × 4.6 mm, 5 μm, at a flow rate of 0.70 ml/min. The retention time of Alogliptin, Voglibose, Alogliptin D3 and Miglitol occurred at ~1.03, 0.8, 0.8 and 0.81 min respectively and the total chromatographic run time was 3.0 min. Alogliptin and Voglibose achieved a linear response function in human plasma at 5.09-509 ng/mL and 2.03-203 ng/mL respectively. Alogliptin and Voglibose achieved an intra and inter-day accuracy and precision in the range of 0.94- 4.35 and 0.91-3.89%; 1.41-10.8 and 1.90-7.75% respectively. The method was strictly validated according to the ICH guidelines. The results obtained from this study can be significantly utilized for developing full pharmacokinetic profiling in individuals.
Keywords
Alogliptin; Human plasma; LC-MS/MS; Method validation; Pharmacokinetics voglibose
Introduction
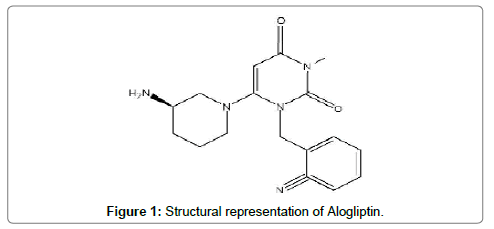
Alogliptin (Figure 1), is 2-({6-[(3R)-3-aminopiperidin-1-yl]-3- methyl-2, 4-dioxo-3, 4-dihydropyrimidin-1(2H)-yl} methyl) benzo nitrile and belongs to the class of orally administered antidiabetic drugs. Alogliptin being a DPP-4(dipeptidyl peptidase-4) inhibitor quickly degrades incretin hormones and results in an imbalance of glucose and insulin homeostasis [1,2].
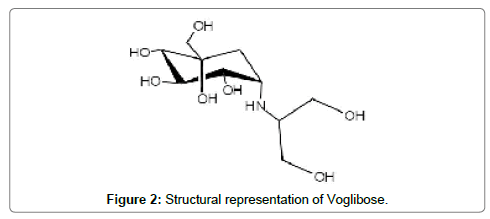
Voglibose (Figure 2), chemically is (1S,2S,3R,4S,5S)-5-(1,3- dihydroxypropan-2-ylamino)-1-(hydroxymethyl)cyclohexane-1,2,3,4- tetraol. It is an alpha-glucosidase inhibitor. Voglibose delays gut carbohydrates absorption and digestion [2,3].
Deng et al. reported an LC-ESI-MS for determination of Alogliptin in monkey plasma. Plasma aliquots were processed using ethyl acetate liquid-liquid extraction method [4]. In another study, Alogliptin and Metformin were simultaneously quantified. Chromatographic conditions included using Hypersil Gold column and gradient elution. Linearity was observed between 5 and 400 ng/ml. Precision and accuracy results were within the acceptable limits [5].
Numerous reported methods for Alogliptin quantification in human plasma are available either for single analyte or in combination with other drugs [6-11].
Analytical methods were also reported for Voglibose quantification using electrospray ionization in positive mode, establishing linearity at concentration of 25.0 ng/ml to 1200.0 ng/ml [12,13].
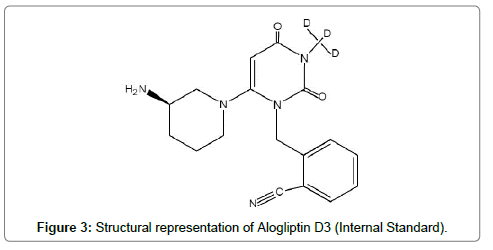
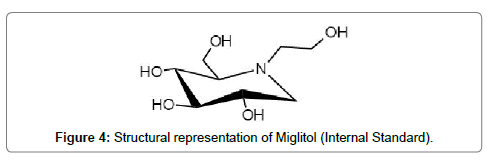
Miglitol (Figure 3) and Alogliptin D3 (Figure 4) both being azasugar analogs are being used as internal standards for Voglibose and Alogliptin respectively.
Maximum of the reported methods were appropriate for single analyte determination and/or consumed a substantial quantity of plasma volume. Thus, the present study was taken up and reported. Sensitivity as well as specificity involving isocratic mode of elution and faster elution were the plus points of this study. This method can be further utilized successfully in human pharmacokinetic studies.
No method similar to the present study has been reported for simultaneous determination of Alogliptin and Voglibose by LC-MS/ MS. The proposed method is validated as per guidelines [14].
Experimental
Chemicals and reagents
Alogliptin (purity 99.3%) and IS - Alogliptin D3 were procured from Clearsynth, India. Voglibose (purity 99.2%) and Miglitol were purchased from Sigma-Aldrich. India. Acetonitrile and Methanol (HPLC grade) were purchased from J T Baker, India. Analytical grade Ethyl acetate and Formic acid were purchased from Merck and Spectrochem, India respectively. DMSO (Dimethyl sulfoxide) and Phenacetin were procured from Sigma-Aldrich, India. All other chemicals and reagents were of analytical grade. Microcaps® Disposable Micropipettes (50 μL, catalog number: 1-000-0500) were purchased from Drummond Scientific Company, USA. The control human K2EDTA (Di-Potassium Ethylene Diamine Tetra Acetic acid) plasma samples were obtained from Red Cross society, Bangalore.
Instrumentation and chromatographic conditions
A Shimadzu HT (Shimadzu, Japan) LC system accommodating an auto-sampler, degasser and binary pump was used as potential part of instrumentation. Aliquots measuring 10 μL were injected on Welchrom XB C18 column with specifications of 50 × 4.6 mm, 5 μm. The Column Oven Temperature was fixed at 40 ± 1°C. The mobile phase included Acetonitrile and 5 mM Ammonium formate mixed in the ratio 50:50 v/v. This isocratic mobile phase was filtered using a 0.45 μm membrane filter (Millipore, USA or equivalent). The filtered mobile phase was then degassed by ultra-sonication for 5 min. The mobile phase was controlled at a flow rate of at 0.700 ml/min directed to the mass spectrometer electro spray ionization chamber.
The analytes Voglibose and Alogliptin along with the IS were detected by MS/MS detection set in positive ion mode. To achieve the quantification, MDS Sciex, API-4000 Mass spectrometer provided with a Turbo ion spray interface was used as the instrumentation. Temperature was maintained at 500°C and ion spray voltage of 5500 V was fixed. The source parameters were maintained at pressure of 50 psi (GS1) and 60 (GS2) psi.
The compound parameters viz., DP (declustering potential), EP (entrance potential), CE (collision energy) and CXP (collision cell exit potential) were 95, 10, 45 and 10 V for Alogliptin; 95, 10, 50 and 10 V for Alogliptin D3 (IS) and 60, 10, 32 and 16 V for Miglitol (IS) and 60, 10, 28 and 12 V for Voglibose respectively.
For detection of ions, the process of Multiple Reaction Monitoring (MRM) mode was used. For the analyte Alogliptin, the transition witnessed for Precursor ion to product ion was found to be m/z 340.30 to m/z 116.10; for Voglibose m/z 268.20 (Precursor ion) to the m/z 92.10 (Product ion), for IS (Alogliptin D3) m/z 344.30 (Precursor ion) to the m/z 166.10 (Product ion) and for IS (Miglitol) m/z 208.20 (Precursor ion) to the m/z 146.2 (Product ion). Quadrupole Q1 and Q3 were set on unit resolution. The dwell time was set as 200 msec. The analytical data were processed by Analyst software (version 1.4.2).
Standard solutions
The analytical micro balance was used to accurately weigh Alogliptin, Voglibose and IS (Alogliptin D3 and Miglitol). The primary stock solutions of Alogliptin, Voglibose and IS solution were prepared at 1212, 1267 and 1000 μg/mL, respectively in Methanol. The stock solutions were stored at a temperature of -20°C. The stock solutions were found to be stable for one month. Methanol: water (50:50 v/v) diluent was used to prepare the secondary stock solutions and working solutions were prepared by diluting the Alogliptin and Voglibose stock solutions. For constructing the calibration curve (CC), the working solutions and secondary stock solutions were used. All the solutions were stored at 4°C for a week. Working stocks were used to prepare plasma calibration standards. The concentration of 150 ng/mL working Internal Standard solution was prepared using the Methanol: water (50:50 v/v) diluent. The blank plasma was screened prior to spiking to check for the endogenous interference at retention times of analytes and IS. Concentrations of 5.09-509 ng/mL and 2.03-203 ng/mL for Alogliptin and Voglibose respectively were used to prepare eightpoint calibration standards samples by spiking the blank human plasma with appropriate concentration of Alogliptin and Voglibose. At appropriate concentrations (5.25 and 2.11 ng/mL LLOQ (lower limit of quantitation), 25.0 and 10.0 ng/mL LQC (low quality control) Alogliptin and Voglibose, 200 and 83.6 ng/mL MQC (medium quality control) and 400 and 152 ng/mL HQC (high quality control) for Alogliptin and Voglibose respectively). Accuracy and precision were prepared by spiking the controlled human plasma. Plasma aliquots of volume 250 μL were introduced into the Radio Immuno Assay vials which were pre-labelled and preserved at a temperature of -80 ± 10°C.
Sample preparation
Following protein precipitation extraction method, Alogliptin and Voglibose were extracted from K2EDTA human plasma. Plasma sample (200 μl) was taken into respectively labeled RIA vial and vortexed. To it 100 μl of Milli-Q water was added and vortexed. 50 μL of IS was added except blank. Acetonitrile (800 μL) was added and vortexed for 2 min and then centrifuged at 5000 rpm for 5 min. Following centrifugation ~500 μL supernatant was aliquoted and transferred into labeled RIA vials and placed in the auto sampler at 10°C ± 4°C. 10 μL was injected onto LC-MS/MS system for analysis.
Method validation
A full validation procedure for the assay in K2EDTA human plasma was performed according to the ICH guidelines [14].
Specificity and selectivity
At least six dissimilar lots of K2EDTA blank human plasma samples were analyzed to examine the interferences at the retention time of analytes and IS. In order to meet the acceptance criterion, minimum of four lots out of six lots in the same matrix should have an area response of <20% compared to that of the LLOQ level response.
In addition to ensuring specificity against potential biological interferences, two lots of hemolyzed plasma were analysed.
Recovery
The extraction efficiency of analytes and IS from human plasma was determined by comparing the analytes extracted from replicate QC samples (n=6) responses with that of neat standard solutions which were spiked in post extracted human plasma blank sample at equivalent concentrations extracted by using protein precipitation method. Single concentration was used to determine recovery of IS whereas in case of analytes (Alogliptin and Voglibose), the recovery was determined at LQC as well as HQC concentrations.
Matrix effect
Matrix effect was determined by assessing the effect of matrix i.e., the human plasma constituents over the ionization of analytes and IS by following post-column infusion method [15]. A constant amount of analyte into LC system outlet entering to mass spectrometer inlet is delivered by the infusion pump. The mass spectrometer was operated in MRM mode. Sample extracts was injected on LC column under similar chromatographic condition. A steady ion response was obtained as a function of time. Any endogenous compound eluted from the column and causing a variation in ESI (electro spray ionization) response of the infused analyte was perceived as a suppression or enhancement of infused analyte response. At a constant rate the analytes and IS solutions were infused. Blank matrix sample was injected through the LC. Six different lots of human plasma samples were spiked with analyte concentration levels at concentrations of LQC and HQC levels to evaluate matrix effect in addition to post-column infusion method. The acceptance criteria were ± 15% deviation from the nominal value for each back-calculated concentration [14].
Calibration curve
The eight-point calibration curve for the analytes (Alogliptin and Voglibose) at concentration range of 2.02-510 ng/ml was constructed. This was achieved by plotting the peak area ratio of each analyte: IS against the calibration standards nominal concentration in K2EDTA human plasma. The results were fit into linear regression analysis with the use of 1/X2 (X: concentration) weighing factor. The Expected correlation coefficient (r) was 0.99 or better for the calibration curve. 85-115% accuracy from the nominal value except at LLOQ, set at 80- 120% was considered as the acceptance criteria for each back-calculated standard concentration [14].
Precision and accuracy
The intra-assay precision and accuracy were estimated by analyzing six replicates containing Alogliptin and Voglibose at four different QC levels (5.28 ng/mL (LLOQ), 24.20 ng/mL (LQC), 184.26 ng/mL (MQC) and 370.06 ng/mL (HQC) for Alogliptin and 2.10 ng/mL (LLOQ), 8.42 ng/mL (LQC), 84.2 ng/mL (MQC) and 168 ng/mL (HQC) for Voglibose) in human plasma. Similarly, inter-assay precision was determined by analyzing the four level QC samples on four different runs. 85-115% accuracy from the nominal value except at LLOQ, set at 80-120% was considered as the acceptance criteria for each backcalculated standard concentration [14].
Stability experiments
Stability tests were performed to assess the stability of Alogliptin and Voglibose in human plasma samples under diverse conditions. At each level for LQC and HQC samples, six replicates were used for the following stability parameters:
1. Bench top stability (8 hours),
2. Auto-sampler stability (26 hours at 10°C),
3. Freeze Thaw stability completed for three cycles,
4. Long-term stability done for 30 days at -80 ± 10°C.
The acceptance criteria for the analytical runs include the following: (i) the accuracy values must lie within 85-11 5% of the nominal concentration for 67% of the QC samples and (ii) not less than 50% of QC concentration at individual level must fall within the acceptance criteria [14].
Dilution integrity
Dilution integrity (DI) was examined to confirm that samples could be diluted with blank matrix without disturbing the final concentration. It is the test executed for those study sample concentrations which overpassed the ULOQ (upper limit of quantitation). Alogliptin and Voglibose spiked human plasma samples were prepared at two concentrations (168 and 336 ng/ml) of Alogliptin and Voglibose and were diluted with pooled human blank plasma at dilution factors of 2T and 4T in six replicates and analyzed. The back-calculated standard concentrations had to comply to have both precision of <15% and accuracy of 100 ± 15% similar with other QC samples (1). The criteria for acceptance of the analytical runs encompassed the following: 67% of the Quality Control samples accuracy must be within ± 15% of the nominal concentration and at each Quality Control concentration level not less than 50% must meet the acceptance criteria [14].
Results and Discussion
Results
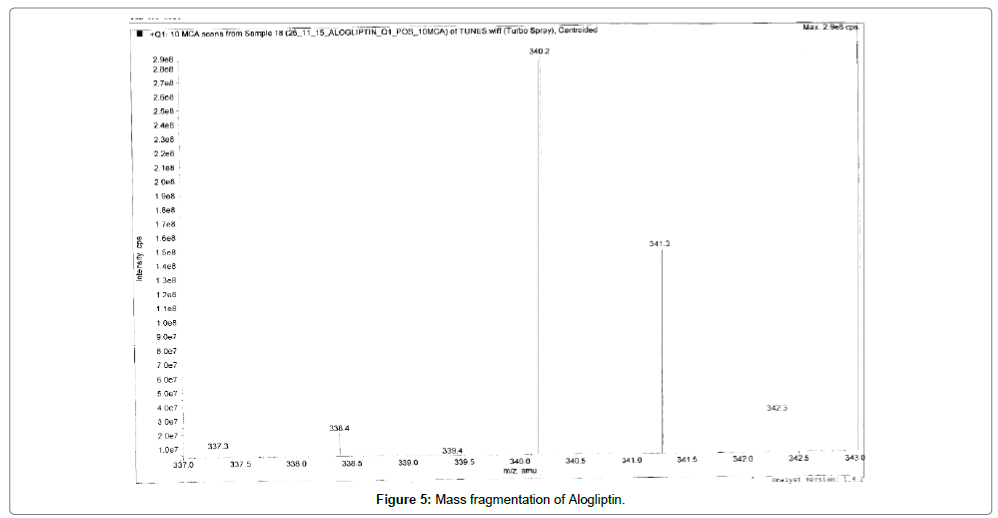
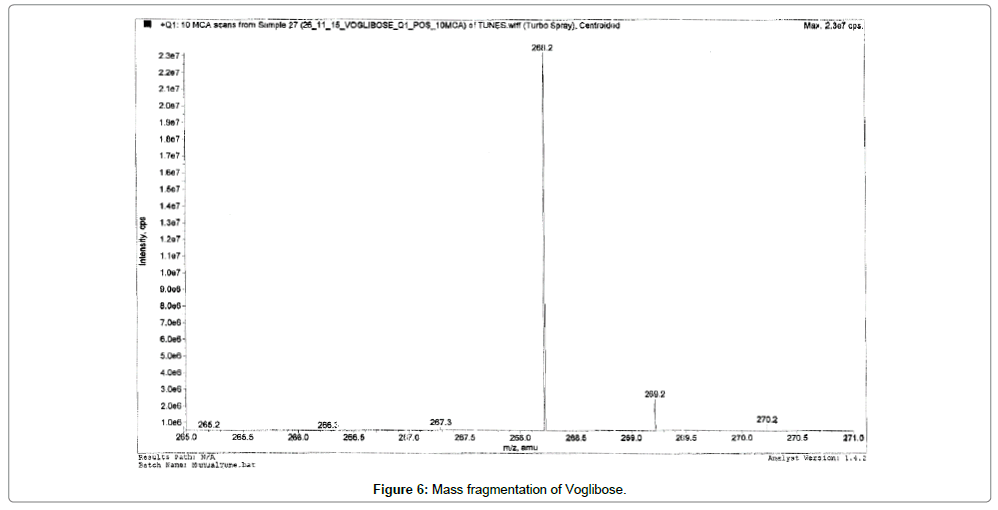
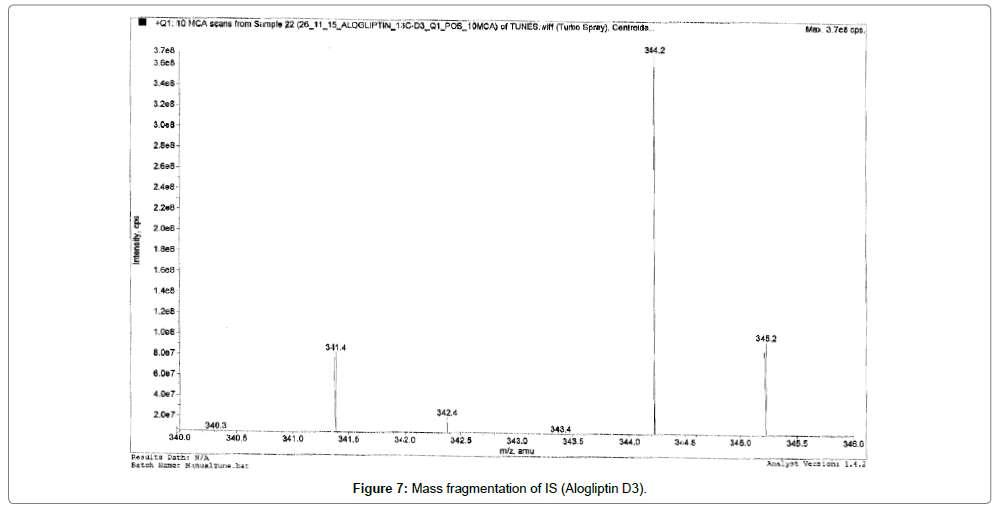
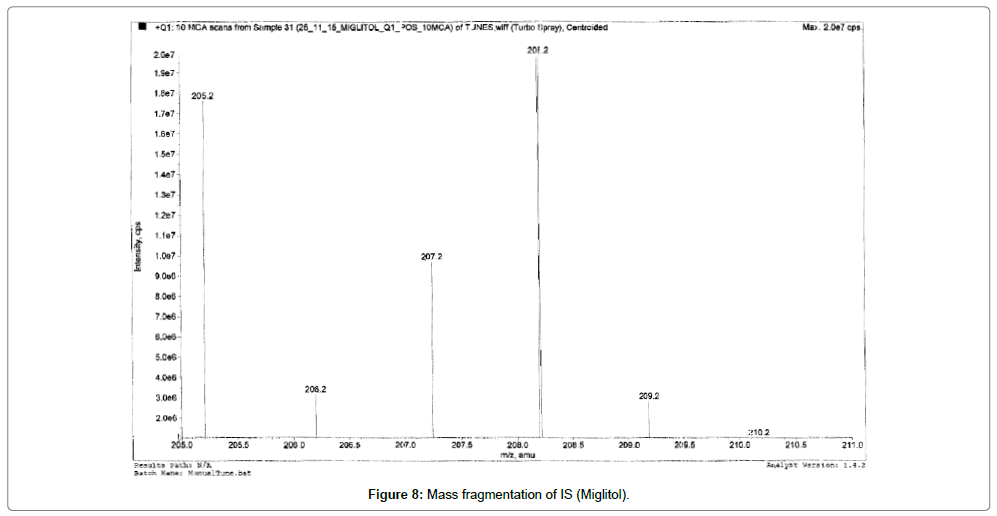
Alogliptin, Voglibose and IS eluted at ~1.03, 0.8, 0.80 and 0.81 min, respectively. During a direct infusion experiment, the mass spectra for Alogliptin, Voglibose and IS revealed peaks at m/z 340, 268, 344 and 208 respectively as protonated molecular ions (M+H) +.
Succeeding the complete optimization of mass spectrometry settings, MRM reaction pair of m/z 340.30 precursor ion to the m/z 116.10 was used for quantification for Alogliptin; m/z 268.20 precursor ion to the m/z 92.10 was used for quantification for Voglibose. Similarly, for IS MRM reaction pair of m/z 344.30 precursor ion to the m/z 116.10 for Alogliptin D3 and m/z 208 precursor ions to the m/z 146.20 for Miglitol was used for quantification purpose. The fragmentation pattern of Alogliptin, Voglibose, Alogliptin D3 and Miglitol are shown in Figures 5-8.
Table 1 shows the mean recovery for Alogliptin and Voglibose at LQC and HQC. The recovery of IS was 54.6%.
The results have shown that the precision and accuracy for analyzed samples were within acceptance range (Table 1).
| Concentration ng/mL | Mean recovery (%) Mean ± SD (n=6) |
Mean absolute matrix effect Mean ± SD (n=6) |
|---|---|---|
| LQC | ||
| Alogliptin – 25.0 | 53.9 ± 2.43 | 102 ± 1.89 |
| Voglibose – 10.0 | 60.4 ± 4.17 | 101 ± 1.72 |
| HQC | ||
| Alogliptin - 400 | 50.9 ± 1.20 | 102 ± 1.08 |
| Voglibose - 152 | 62.8 ± 1.68 | 100 ± 1.53 |
Table 1: Recovery and matrix data for Alogliptin and Voglibose.
Figures 9-12 shows chromatograms for the blank human plasma (free of analytes and IS), blank human plasma along with IS; blank human plasma spiked with Alogliptin at LLOQ concentration along with IS; blank human plasma spiked with Alogliptin at ULOQ concentration along with IS.
Similarly, Figures 13-16 shows chromatograms for the blank human plasma (free of analytes and IS), blank human plasma along with IS; blank human plasma spiked with Voglibose at LLOQ concentration along with IS; blank human plasma spiked with Voglibose at ULOQ concentration along with IS.
The retention time of Alogliptin, Voglibose and IS were ~1.03, 0.80 and 0.80 min, respectively. The total chromatographic run time achieved was 3.0 min.
In the calibration range, a worthy reproducibility over the standard concentrations was observed for the calibration standard curve. An average regression (n=3) value >0.990 was obtained for the both the analytes (Voglibose and Alogliptin). LLOQ was considered as the lowest concentration with RSD <20% and was found to be 5.25 ng/ mL and 2.11 ng/mL for Alogliptin and Voglibose respectively. The % accuracy observed for the mean of back-calculated concentrations for three calibration curves for Alogliptin and Voglibose was within 51.0 - 63.0; while the precision (% CV) values ranged from 0.40-6.92 and 1.13-8.38 respectively.
Accuracy and precision data for intra- and inter-day plasma samples for Alogliptin and Voglibose are presented in Table 2.
| Intra-day variation (Six replicates at each concentration) | |||
|---|---|---|---|
| Nominal concentration (ng/mL) |
Mean ± SD | RSD | Accuracy (%) |
| Alogliptin – 5.25 | 4.70 ± 0.20 | 4.35 | 89.5 |
| Voglibose – 2.11 | 1.87 ± 0.20 | 10.8 | 89.0 |
| Alogliptin – 25.0 | 22.8 ± 0.69 | 3.02 | 91.0 |
| Voglibose – 10.0 | 9.47 ± 0.29 | 3.11 | 94.4 |
| Alogliptin – 200 | 179 ± 2.21 | 1.23 | 89.7 |
| Voglibose – 83.6 | 75.7 ± 1.26 | 1.66 | 90.6 |
| Alogliptin – 400 | 361 ± 3.38 | 0.94 | 90.3 |
| Voglibose - 152 | 141 ± 1.99 | 1.41 | 92.5 |
| Inter-day variation (Eighteen replicates at each concentration) | |||
| Alogliptin – 5.25 | 4.99 ± 0.19 | 3.89 | 95.0 |
| Voglibose – 2.11 | 1.99 ± 0.15 | 7.75 | 94.6 |
| Alogliptin – 25.0 | 23.4 ± 0.51 | 2.21 | 93.5 |
| Voglibose – 10.0 | 9.37 ± 0.25 | 2.62 | 93.4 |
| Alogliptin – 200 | 181 ± 2.54 | 1.41 | 90.3 |
| Voglibose – 83.6 | 76.1 ± 1.45 | 1.90 | 91.1 |
| Alogliptin – 400 | 363 ± 3.30 | 0.91 | 90.8 |
| Voglibose - 152 | 141 ± 2.89 | 2.05 | 92.9 |
RSD: Relative standard deviation (S.D × 100/Mean)
Table 2: Intra- and inter-day precision and accuracy determination of Alogliptin and Voglibose quality controls in human plasma.
The predicted concentrations for Alogliptin and Voglibose at LQC and HQC levels deviated within ± 15% of the fresh sample concentrations in a battery of stability tests viz., in-injector (22 h), bench-top (7 h) and repeated four freeze/thaw cycle’s stability (Table 3). The results were found to be within the assay variability limits during the entire process.
| Nominal concentration (ng/mL) |
Stability | Alogliptin | Voglibose | ||||
|---|---|---|---|---|---|---|---|
| Mean ± S.Dº (n=6) |
Accuracy (%)• |
Precision (% CV) |
Mean ± S.Dº (n=6) |
Accuracy (%)• |
Precision (% CV) |
||
| 0 h | 23.0 ± 0.33 | 92.1 | 1.41 | 9.32 ± 0.20 | 92.8 | 2.12 | |
| Alogliptin - 25.0 | 7 h (bench-top) | 23.2 ± 0.67 | 100 | 2.89 | 9.56 ± 0.23 | 103 | 2.6 |
| Voglibose - 10.0 | 22 h (in-injector) | 23.8 ± 0.41 | 103 | 1.72 | 9.47 ± 0.51 | 102 | 4.95 |
| 4 F/T cycles | 23.4 ± 0.57 | 102 | 2.44 | 9.10 ± 0.51 | 97.6 | 5.57 | |
| 0 h | 363 ± 3.76 | 90.7 | 1.04 | 141 ± 1.75 | 92.5 | 1.24 | |
| Alogliptin – 400 | 7 h (bench-top) | 359 ± 4.13 | 98.9 | 1.15 | 142 ± 2.83 | 101 | 1.99 |
| Voglibose – 152 | 22 h (in-injector) | 359 ± 5.00 | 98.9 | 1.39 | 142 ± 2.39 | 101 | 1.68 |
| 4 F/T cycles | 360 ± 1.34 | 99.2 | 0.37 | 141 ± 2.43 | 100 | 1.72 | |
ºBack-calculated plasma concentrations; •Mean assayed concentration/mean assayed concentration at 0 h) × 100; F/T: freeze-thaw
Table 3: Stability data of Alogliptin and Voglibose quality controls in human plasma.
Discussion
Liquid chromatography
Liquid Chromatographic separation of Alogliptin has been carried out using various combinations of mobile phases consisting of different aqueous solutions and methanol or acetonitrile as the organic phase [16]. Methanol when used as organic mobile phase, achieved shorter retention times and better resolution of Alogliptin [17].
In the present study optimization and critical evaluation of buffer, mobile phase composition, flow-rate and analytical column were important to obtain good resolution of peaks of interest from the endogenous components, which in turn affect reproducibility and sensitivity of the method.
Selection of chromatographic conditions for the proposed method was optimized to suit the preclinical pharmacokinetic studies. We have kept the plasma volume (200 μL) in order to lower usage of solvent and ease in sample preparation in micro tubes. Initial feasibility experiments of a various mixture(s) of solvents such as Acetonitrile and Methanol using different buffers such as Ammonium acetate, Ammonium formate and formic acid along with altered flow-rates (in the range of 0.1-0.5 mL/min) were performed to optimize an effective chromatographic resolution of Alogliptin, Voglibose and IS. Various analytical columns (Zorbax, Inertsil, Prodigy, Kromasil, Atlantis, Hypersil etc.) were tested to obtained good and reproducible response with short run time. The resolution of peaks was best achieved with an isocratic mobile phase comprising acetonitrile and 2mM Ammonium formate in water (50:50 v/v) delivered at a flow rate of 0.70 mL/min. Welchrom XB C18 column (50 × 4.6 mm, 5 μm) was found to be suitable for sharp and symmetric peak shapes among few other columns tested in the method optimization process (data not shown). Alogliptin, Voglibose and IS eluted at ~1.03, 080 and 0.81 min, respectively. The injection volume was set at 10 μL, since low injection volume was expected to result in increased ionization and decreased possible chemical noise.
The purpose of sample extraction optimization is mainly to achieve high extraction recovery with negligible or low matrix effects in order to improve sensitivity and reliability of LC-MS/MS analysis. The presence of endogenous interference in sample extracts, due to poor extraction procedure which is not efficiently cleaned up, decreases method robustness. With time-saving advantage and simplicity, the protein precipitation extraction method was chosen as an extraction method. The attained LLOQ is sufficient to quantify Alogliptin and Voglibose in low dose for pharmacokinetic studies.
Mass spectroscopy
Quadrupole full scans were carried out both in positive and negative ion detection mode to optimize electro spray ionization (ESI) conditions for the analytes and IS. and found that Worthy response was attained in positive ionization mode. MRM reaction pair of m/z (mass to charge ratio) 340.30 precursor ion to the m/z 116.10 was used for quantification for Alogliptin; m/z 268.20 precursor ion to the m/z 92.10 was used for quantification for Voglibose. Similarly, for IS, MRM reaction pair of m/z 344.30 precursor ion to the m/z 116.10 for Alogliptin D3 and m/z 208 precursor ions to the m/z 146.20 for Miglitol was used for quantification purpose. The fragmentation pattern of Alogliptin, Voglibose and IS are shown in Figures 5-8.
Recovery
One step protein precipitation extraction process proved to be robust and provided clean samples. The comparisons of plasmaextracted standards versus the neat solution spiked into post extracted blank sample at equivalent concentration were estimated for Alogliptin and Voglibose and IS.
Matrix effect
No significant matrix effect was observed in the region of elution of Alogliptin and Voglibose and IS. The results have shown that the precision and accuracy for analyzed samples were within acceptance range. Overall it was found that there was no impact on the ionization of analyte and IS.
Specificity and selectivity
Figures 9 and 11 shows chromatograms for the blank human plasma (free of analytes and IS), blank human plasma spiked with Alogliptin at LLOQ concentration. Similarly, Figures 13 and 15 shows chromatograms for the blank human plasma (free of analytes and IS), blank human plasma spiked with Voglibose at LLOQ level. At the retention times of Alogliptin, Voglibose and IS, no interfering peaks from endogenous compounds were observed in the matrix. The specificity parameter was performed in order to determine the potential interferences for analytes and IS at the peak region using human plasma samples from six dissimilar lots. Cleanest blank samples were used to prepare six replicates of LLOQ samples. The analyzed samples were found to be acceptable with precision (% CV) resulting less than 10%.
Calibration curve
The plasma calibration curve was constructed in the linear range using eight calibration standards (viz., 2.03, 4.05, 21.9, 36.5, 73.0, 122, 162 and 203 ng/mL for Alogliptin and 5.09, 10.2, 55.0, 91.6, 183, 305, 407 and 509 ng/mL for Voglibose). A reliable reproducibility over the standard concentrations across the calibration range was observed for the calibration standard curve.
Accuracy and precision
The assay values on both the occasions (intra- and inter-day) were found to be within the accepted limits.
Stability
The predicted concentrations for Alogliptin and Voglibose at 8.17 and 163 ng/ml deviated within ± 15% of the fresh sample concentrations in a battery of stability tests viz., in-injector (22 h), bench-top (7 h) and repeated four freeze/thaw cycles stability (Table 3).
Dilution effect
The dilution integrity parameter was determined for those quality control samples that outwent the upper limit of the standard calibration curve. 8 and 16 times dilutions of test samples were found to have precision and accuracy within the acceptance range (% CV values were between 5.23 and 2.35 for both the dilutions).
Conclusion
In summary, a highly sensitive, specific, reproducible and highthroughput LC-MS/MS assay was developed and validated to quantify Alogliptin and Voglibose in human plasma as per the regulatory guidelines. The present method involved a simple sample preparation method, which gave consistent as well as reproducible recoveries. The study fulfills the requirement of supporting the possibility to study the full pharmacokinetic profile in individuals. Also, the rationale for selecting the combination of Alogliptin and Voglibose is justifiable. The combination therapy of DPP-4 inhibitors and α-glucosidase inhibitors is well established in suppressing postprandial hyperglycemia and highly effective [18]. Combined treatment with α-glucosidase inhibitor strongly inhibits the early phase of postprandial hyperglycemia and DPP-4 can yield complementary and synergistic effects and therefore represent a better anti-hyperglycaemic therapy [19,20]. Hence the combination was taken up for developing a bioanalytical method development and validation so that further it would be useful for performing pharmacokinetic studies.
Acknowledgements
The authors would like to thank the Faculty of Pharmacy, KLE College of Pharmacy and Nortrox Bioanalytical Laboratory, Bangalore for their incessant support and guidance.
References
- Yoshifumi S (2015) Alogliptin benzoate for management of type 2 diabetes. Vascular Health and Risk Management 11: 229-243.
- White WB, Pratley R, Fleck P, Munsaka M, Hisada M, et al. (2013) Cardiovascular safety of the dipeptidyl peptidase-4 inhibitor alogliptin in type 2 diabetes mellitus. Diabetes, Obesity and Metabolism 15: 668-673.
- Yusuke M, Koji T, Masatoshi H (2009) Voglibose, an Alpha-glucosidase Inhibitor, to Increase Active Glucagon-like Peptide-1 Levels. Mol Cell Pharmacol 1: 188-192.
- Mi Young L, Dong Seop C, Moon Kyu L, Hyoung Woo L, Tae Sun P, et al. (2014) Comparison of Acarbose and Voglibose in Diabetes Patients Who Are Inadequately Controlled with Basal Insulin Treatment: Randomized, Parallel, Open-Label, Active-Controlled Study. J Korean Med Sci 29: 90-97.
- Jifeng D, Jiayin G, Renke D, Guicheng Z, Hui X (2016) Determination of a novel dipeptidyl peptidase IV inhibitor in monkey plasma by HPLC-MS/MS and its application in a pharmacokinetics study. J Pharmaceutical and Biomedical Analysis 117: 99-103.
- Shereen M, Ehab Elkady F, Mohamed Elmazarc M, Bassam Ayoub M (2017) Enhanced LC-MS/MS determination of alogliptin and metformin in plasma: Application to a pharmacokinetic study. J Microchemical 130: 360-365.
- Mithlesh R, Meenakshi D, Premlata K, Kamini K, Manjeet A, et al. (2011) Method Development and Validation for Determination of Voglibose in Tablet Formulation Using LC-MS/MS. E-Journal of Chemistry 8: 1770-1783.
- Todkar SB, Mohite SK, Patil SK, Khochage SR (2013) Spectrophotometric determination of voglibose in bulk and tablet dosage form by absorption maxima, first order derivative spectroscopy and area under curve method. Intl J Pharma Research and Development 5: 200-206.
- Rao MN, Bagyalakshmi J, Ravi TK (2010) Development and Validation of UV Spectroscopic Method for estimation of Voglibose in Bulk and Tablet dosage form. J Chemical and Pharmaceutical Research 2: 350-356.
- Sai KV, Chakravarthy KT, Naik VS, Reddy H (2013) Development and validation of RP-HPLC Method for Quantitative analysis of Voglibose in pure and pharmaceutical formulation. Intl J Pharmaceutical, Chemical and Biological Science 3: 336-341.
- Deswadkar SC, Whalode SG (2013) Stability Indicating RP-HPLC method for estimation of Voglibose in bulk and tablet dosage form. J Pharmacophore an International Research 4: 160-165.
- Rao MN, Bagyalakshmi J, Ravi TK (2010) Development and validation of spectrofluorimetric method for the estimation of voglibose in bulk and pharmaceutical dosage form. Intl J Pharmaceutical Sciences and Research 1: 190-194.
- Rajput M, Dahiya M, Kumari P, Kalra K, Aggarwal M, et al. (2011) Method Development and Validation for Determination of Voglibose in Tablet Formulation Using LC-MS/MS. J Chemistry 8: 1770-1783.
- Harmonised Tripartite Guideline: Validation of Analytical Procedures: Methodology (Q2B) (2005) Intl Conference on Harmonisation (ICH).
- Armen Boldi M (2006) Combinatorial Synthesis of Natural Product-Based Libraries Critical Reviews in Combinatorial Chemistry, CRC Press, Taylor and Francis Group, LLC. 6000 Broken Sound Parkway NW, Suite 300 Boco Raton, FL 33487-2742: London New York.
- Bonfiglio R, King RC, Olah TV, Merkle K (1999) The Effects of Sample Preparation Methods on the Variability of the Electrospray Ionization Response for Model Drug Compounds. Rapid Commun Mass Spectrom 13: 1175-1185.
- Mokhtar M, Mabrouk M, Sherin F, Hammad Fotouh R, Mona Amer M, et al. (2016) Development and validation of a reversed phase HPLC method for simultaneous determination of antidiabetic drugs alogliptin benzoate and pioglitazone HCl. Pelagia Research Library Der Pharmacia Sinica 7: 32-40.
- Supriya P, Madhavi Latha N, Rohith KBV, Ramana GV, Harini U, et al. (2016) Development and validation of UV spectrophotometric and reversed phase high performance liquid chromatography da methods for the estimation of Alogliptin benzoate. Asian J Pharm Clin Res 9: 282-287.
- Akira K, Yosuke O, Hiroko M, Tadashi A, Yoshiya T (2013) Efficacy of a-glucosidase inhibitors combined with dipeptidyl-peptidase-4 inhibitor (alogliptin) for glucose fluctuation in patients with type 2 diabetes mellitus by continuous glucose monitoring. J Diabetes Investigation 4: 393-398.
- Yukio H, Mayumi E, Katsumi I, Gui YC, Shin-ichi K, et al. (2011) Synergistic effect of a-glucosidase inhibitors and dipeptidyl peptidase 4 inhibitor treatment. J Diabetes Investigation 2: 200-203.
Relevant Topics
Recommended Journals
Article Tools
Article Usage
- Total views: 4590
- [From(publication date):
April-2017 - Jul 15, 2025] - Breakdown by view type
- HTML page views : 3565
- PDF downloads : 1025

