Research Article Open Access
Seismic and Sequence Stratigraphic Analysis of Ewan and Oloye Fields (Middle Miocene), Northwestern Niger Delta: Implications for Deltaic Depositional Sequences
Durogbitan A Abimbola*
Petrfac IES, Research and Development, Manchester, UK
- Corresponding Author:
- Durogbitan A Abimbola
Principal Geoscientist
Petrfac IES, Research and Development, Manchester, UK
Tel: +447545822428
E-mail: adewoledurogbitan@yahoo.co.uk
Received date: May 05, 2016; Accepted date: May 16, 2016; Published date: May 23, 2016
Citation: Abimbola DA (2016) Seismic and Sequence Stratigraphic Analysis of Ewan and Oloye Fields (Middle Miocene), Northwestern Niger Delta: Implications for Deltaic Depositional Sequences. J Marine Sci Res Dev 6:197. doi: 10.4172/2155-9910.1000197
Copyright: © 2016 Durogbitan AA. This is an open-access article distributed under the terms of the Creative Commons Attribution License, which permits unrestricted use, distribution, and reproduction in any medium, provided the original author and source are credited.
Visit for more related articles at Journal of Marine Science: Research & Development
Abstract
The main aim of this works is to define local sequence variability and its implications for deltaic depositional sequences within the studied area. This research work makes use of depth converted three dimensional seismic cube, well logs, core photography descriptions and biostratigraphic reports. Recognition and interpretation of stratal surfaces were based on facies shifts and stacking patterns and reflection terminations derived from the interpretation of seismic data and wireline logs integrated with core photography and biostratigraphic reports. Seismic stratigraphic analysis of well and seismic data suggests that middle Miocene- early Pliocene strata within the studied area were made of six depositional sequences. Sequences are made up aggradational to progradational HST that makes up about 50% of a sequence. TST are thin and widespread while LST are restricted to within WNWESE trending valley fills typically 4 km wide and an average 120 m deep. Outside the LST valleys, transgressive surfaces, maximum flooding surfaces and sequence boundaries are coincident on interfluves. This suggests that during LST times most of the area was periodically subaerially exposed and several incised valleys/canyons were developed. These incisions/canyons acted as a sand feeder that led to the deposition of high amplitude deposits (sandstones) on the slope and within the basin floor setting. Sequences mapped over the study area show local variation associated with growth faults. There is a strong local growth fault control on sequence variability. Further local controls on sequence geometry are shelf instability and slope scars which have a strong geomorphological impact on the area. The depth of incised valleys within the uppermost HST (up to 350 m) is difficult to explain in terms of sea level fall alone because eustatically-driven sea level variations during the Miocene are generally reported to be less than 100 m (330 ft). This suggests that the character of sequence development and depositional facies preserved within the study area depends on relative sea level changes, relative rates of regional structural collapse and sedimentation rate. The occurrence of several incisions in the middle Miocene succession is interpreted as evidence of significant relative sea level fluctuations, and the presence of type-1 sequence boundaries may be the stratigraphic signature of major drops in relative sea level during Miocene and Pliocene. Variability within the depositional sequences is said to be largely controlled by local growth faults, rapid relative sea level changes, basin physiography (shelf edge) and high rate of sediment influx.
Keywords
Miocene; Incisions; Depositional sequences
Introduction
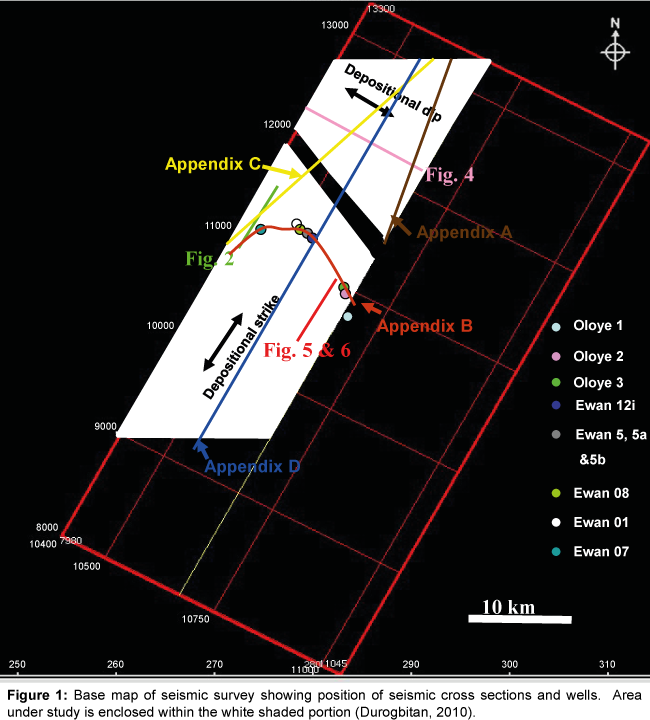
Recent research work has shown that there are variabilities within sequence stratigraphy concept caused by different factors interplay. However, this study documents a seismic and sequence stratigraphic variability framework for growth-faulted delta deposits of the Agbada Formation (Middle Miocene) within the Ewan and Oloye Fields, northwestern Niger Delta (Figure 1). The application of sequence stratigraphic methods to Niger Delta sequences is complex. These complexes are due to changes in relative sea level which are strongly influenced by the interplay between shoreline advance and retreat, concomitant isostatic loading and rebound of the continental shelf growth faulting and basin physiography [1].
Aims and Objectives
The aims and objectives of this are:-
• To identify the key stratal surfaces, the geometry relationship of the surfaces and the development of sequences.
• To analyse relative sea level changes, growth faulting, sediment loading and shelf instability in the study area.
• To define local sequence variability and its implications for deltaic depositional sequences.
Data and Methods
Sequence stratigraphic correlation was based on depth converted three dimensional seismic cube, well logs, core photography descriptions and biostratigraphic reports. The model developed for the study area is based on the recognition of key stratal surfaces, facies shifts and stacking patterns derived from the interpretation of seismic data and wireline logs. The stratigraphic section was sub divided into packages of sediments bounded by chronostratigraphically sequence boundaries. Where possible each depositional sequence was further divided into system tracts based on reflection patterns (stratal surfaces) and well log stacking patterns.
Recognition of stratal surfaces was based on facies shifts and stacking patterns and reflection terminations derived from the interpretation of seismic data and wireline logs. In this study, the terminology developed by Exxon [2-7] has been adopted in the definition of key stratal surfaces and the sub division into lithogenetic units (system tracts).
Results
Characteristics of key stratal surfaces and packages
Four key surface types were delineated within the studied area. They are:-Sequence Boundaries, Transgressive, Flooding and Maximum Flooding Surfaces. Transgressive Systems Tracts, Highstand Systems Tracts and Lowstand Systems Tracts (in some case Lowstand Prograding Wedge) were recognised within the interpreted section.
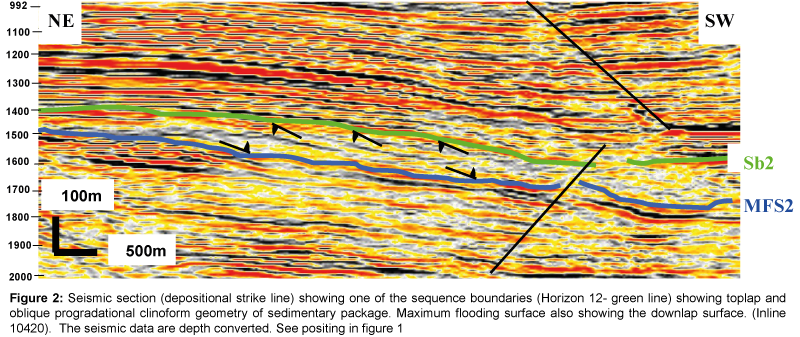
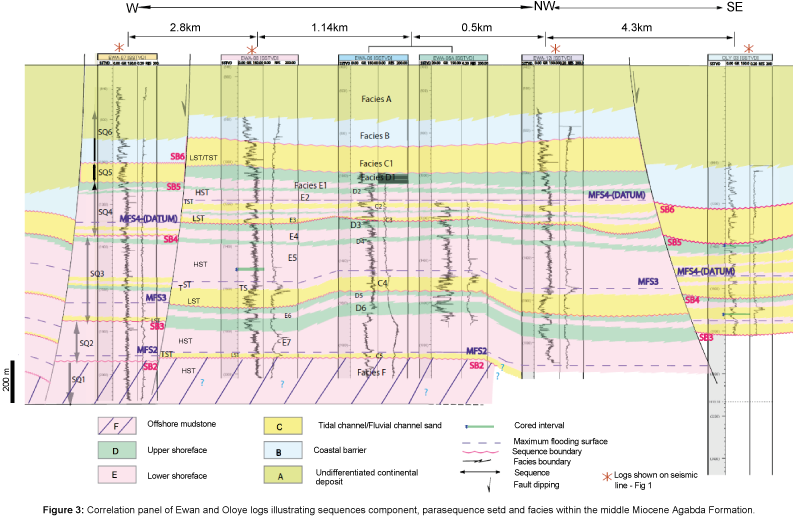
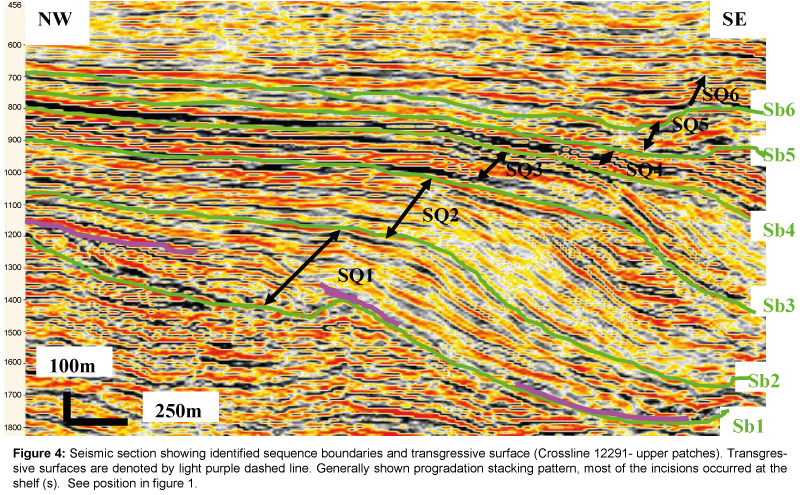
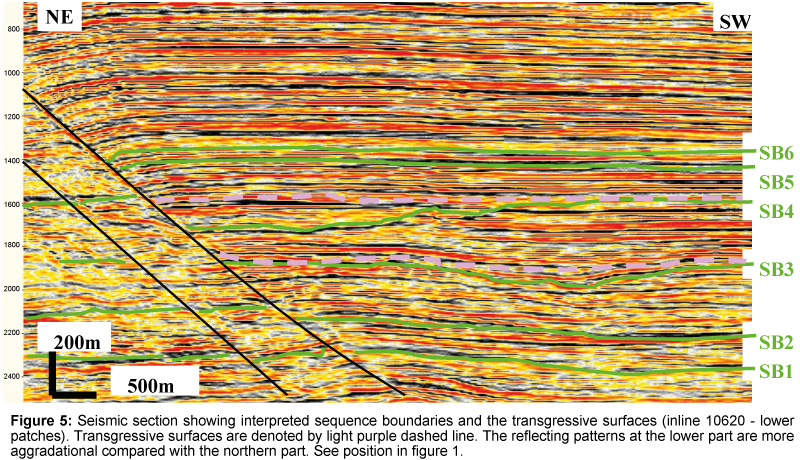
a) Sequence boundaries (unconformities and correlative conformities): Sequence boundaries were identified by the geometrical relationships of strata on seismic reflections. The unconformity surfaces is characterised by truncations and toplap below the stratal surface while coastal onlap terminations characterised above the stratal surface (Figure 2) (Appendix A). In some places in the seismic data they are also recognised by the presence of incisions. On well logs, the sequence boundary is identified as a facies dislocation i.e. a sharp or occasionally gradational base overlain by fluvial/tidal channel fills and slope channel sand. The sequence boundary shows the lowest relative neutron-porosity values and the corresponding highest resistivity values as interpreted from well logs section (Figure 3); well Ewan 08- SB2-3). Six sequence boundaries have been identified and interpreted based on the seismic data (Figures 4 and 5). This has been integrated with well data (Appendix B).
Figure 2: Seismic section (depositional strike line) showing one of the sequence boundaries (Horizon 12- green line) showing toplap and oblique progradational clinoform geometry of sedimentary package. Maximum flooding surface also showing the downlap surface. (Inline 10420). The seismic data are depth converted. See positing in Figure 1
Figure 4: Seismic section showing identified sequence boundaries and transgressive surface (Crossline 12291- upper patches). Transgressive surfaces are denoted by light purple dashed line. Generally shown progradation stacking pattern, most of the incisions occurred at the shelf (s). See position in Figure 1.
Figure 5: Seismic section showing interpreted sequence boundaries and the transgressive surfaces (inline 10620 - lower patches). Transgressive surfaces are denoted by light purple dashed line. The reflecting patterns at the lower part are more aggradational compared with the northern part. See position in Figure 1.
b) Transgressive surfaces: The Transgressive Surface (TS) is referred to originally as the first significant marine flooding surface across the shelf at the top of lowstand system tract [6,7]. From the seismic data, the transgressive surface marks the tops of most of the incisions/incised valleys. On well log it is marked by the turn around surface from cleaning upward stacking pattern to dirtying up ward stacking patterns (Figure 3, well 08-SB3 underlain by slope channel sand). From this study, it is possible to define the TS based on the stratigraphic relationship with the incised valleys i.e. they commonly cap the incised valleys. Based on stratal geometry the TS is defined as a conformable surface that separates regressive strata (LST) from subsequent transgressive strata (TST) (Figure 4). With a definition based on water deepening, it represents the beginning of marine influence i.e. the first significant flooding surface when the water depth is at its shallowest [7]. On seismic data, outside the lowstand system tract valleys, the transgressive surfaces and sequence boundaries are coincident at interfluves (Figure 5). This indicates that, during the time of sea level fall, the sea level fall reaches the shelf edge before transgression begins. Within this study, transgressive surface is diachronous and reflects the landward migration of the shoreline.
c) Maximum flooding surfaces: On the seismic profiles, the surface is recognised as downlap surface (Figure 2 and Appendix A), i.e. the base of prograding clinoforms of the highstand system tract.
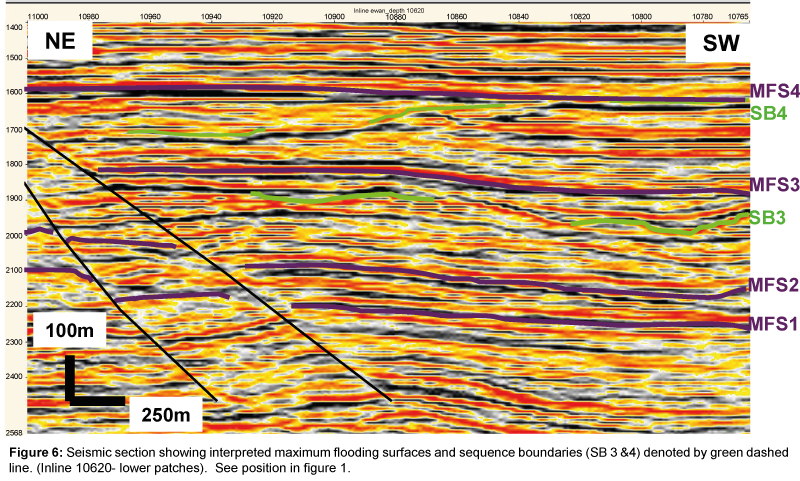
Four maximum flooding surfaces have been interpreted on the seismic data capping the erosional valleys and coincide with the sequence boundaries at interfluves (Figure 6). On well logs, recognition of maximum flooding surfaces within the Niger Delta cannot be based on gamma ray pattern alone, as interbedded thin sandstone and shale of shoreface deposits normally exhibit high levels of radioactivity similar to that of marine shale. This is due to high content of mica, potassium feldspar and heavy minerals within the sandstones. On well logs, maximum flooding surface is characterised by the highest gamma ray values within the muddy interval. Using a combination of logs (gamma ray, resistivity), maximum flooding surfaces can be identified by the highest relative neutron-density values and the corresponding lowest resistivity values relative to other surrounding flooding surfaces [8] (Figure 3; well Ewan 08).
d) Lowstand system tract (LST): From seismic interpretation LST is characterised by prograding to aggrading reflection patterns bounded at the base by erosional surfaces (sequence boundaries) which is characterised by lowstand incision/ incised valley e.g. Figures 4-6. From well log correlations, it is characterised as cleaning upward stacking pattern bounded below by sequence boundaries and above the surface that marked turn around between cleaning upward and dirtying upward log motifs TS. From this study, where there is incised valley LST and Transgressive System Tract (TST) deposits are inferred with reflection pattern characterised by mostly aggradational clinoform geometry in filled the incised valleys. In this case the LST is localised within the valleys (Table 1), overlain by retrogradational TST. The localisation of lowstand system tract (LST) favour the position of the study area to be shelf-edge, where most of the LST are deposited basinward and the incised valleys within the sub aerial are filled with LST deposit.
| Depositional Units | External Form | Internal Form | Amplitude | Continuity | Lateral Distribution | Lower Boundary |
|---|---|---|---|---|---|---|
| LST | Sheet | Variable reflection patterns | Low | Low, more discontinuous | localised | Concordant |
| TST | Sheet | Variable reflection patterns/aggrad-ation | Moderate | Moderate, more discontinuous | Thin and widespread | Concordant |
| HST | Sheet/ | Progradational–Oblique offlap | Moderate | Moderate | Widespread | Downlap |
Table 1: Characteristics seismic facies of depositional sequences recognised in the study area.
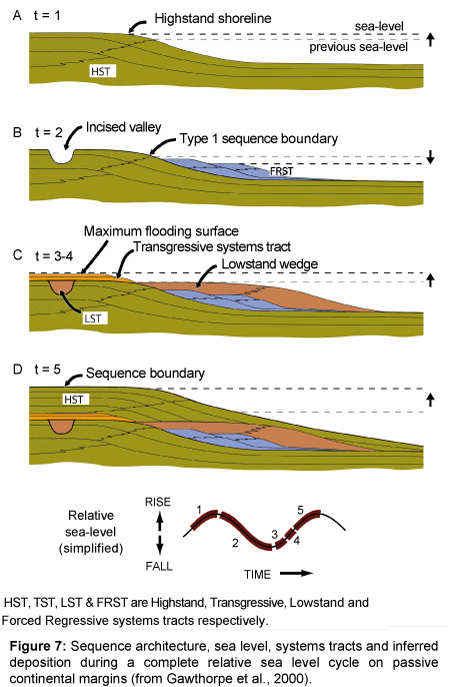
e) Transgressive systems tract: This systems tract within the study area is characterised by aggradational reflection patterns with little retrogradational bounded at the top by downlap of the toes of overlying clinoforms. This unit is thin, widespread and traceable within the study area (Table 1). Where there is incision, it forms part of the incised fills, generally overlie the LST, in such places the upper bounding surface coincided with the transgressive surfaces and sequence boundary. Generally, reflections of clinoform sets within the transgressive system tracts are discontinuous and they are of low amplitude and variable reflection patterns. On well logs, it is characterised by high serrated increasing gamma ray motif bounded by a turn around from cleaning upward to dirtying upward and at the top maximum flooding surface. TST is assumed to be deposited at a time during which there is a rise in the relative sea level, i.e. when topset accommodation volume is increasing faster than the rate of sediment supply [4] (Figure 7).
f) Highstand systems tract: The Highstand System Tract within the study area is characterised by strong aggradational to progradational clinoform geometry and its downlap on the maximum flooding surface (Figure 2 and Appendix A). It is bounded at the base by downlap surface (MFS) and at the top by the sequence boundaries which always truncate the HST . Generally, reflections of the clinoform set within the HST are continuous and they are of moderate amplitude and oblique progradational clinoform geometry (Table 1). HST generally prograde over the underlying LST/TST (Figures 2 and 4). On a well log, highstand system tract is recognised by deposit form after maximum flooding as the relative sea level rise slows down during the late part of a relative sea level rise. At this time, the rate of creation of accommodation is typically less than the rate of sediment supply (Figure 7).
Depositional sequences
Seismic and sequence stratigraphic analysis has helped in defining six depositional sequences that can be recognised within the Ewan and Oloye fields, north-western Niger Delta. These sequences are illustrated in Appendices A-D and Figures 3 and 4; described below in order of the sequence development. The boundaries of these sequences are marked by reflections that represent unconformities.
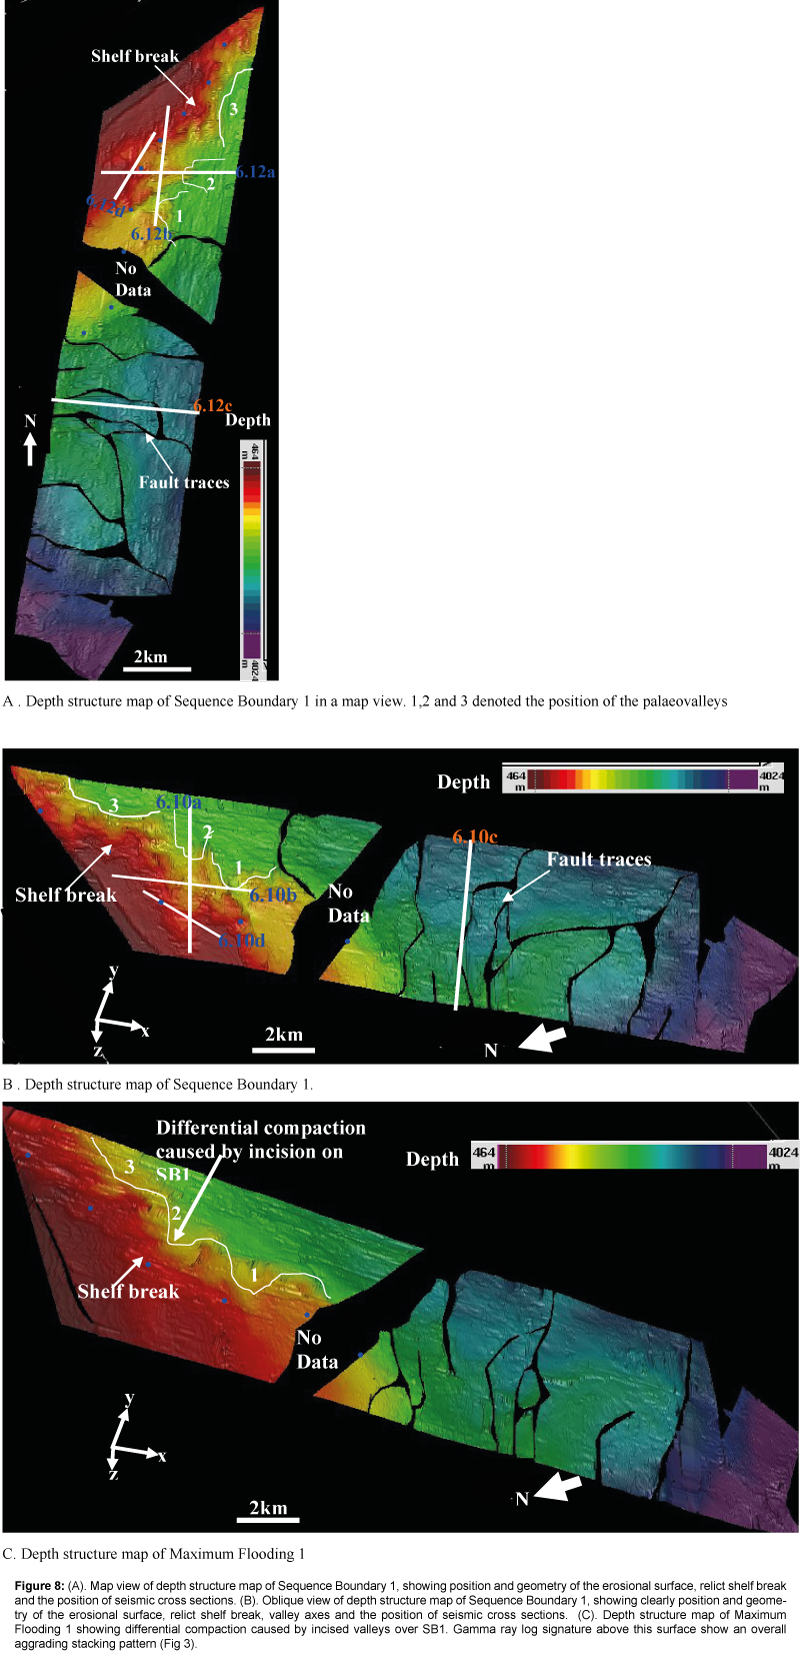
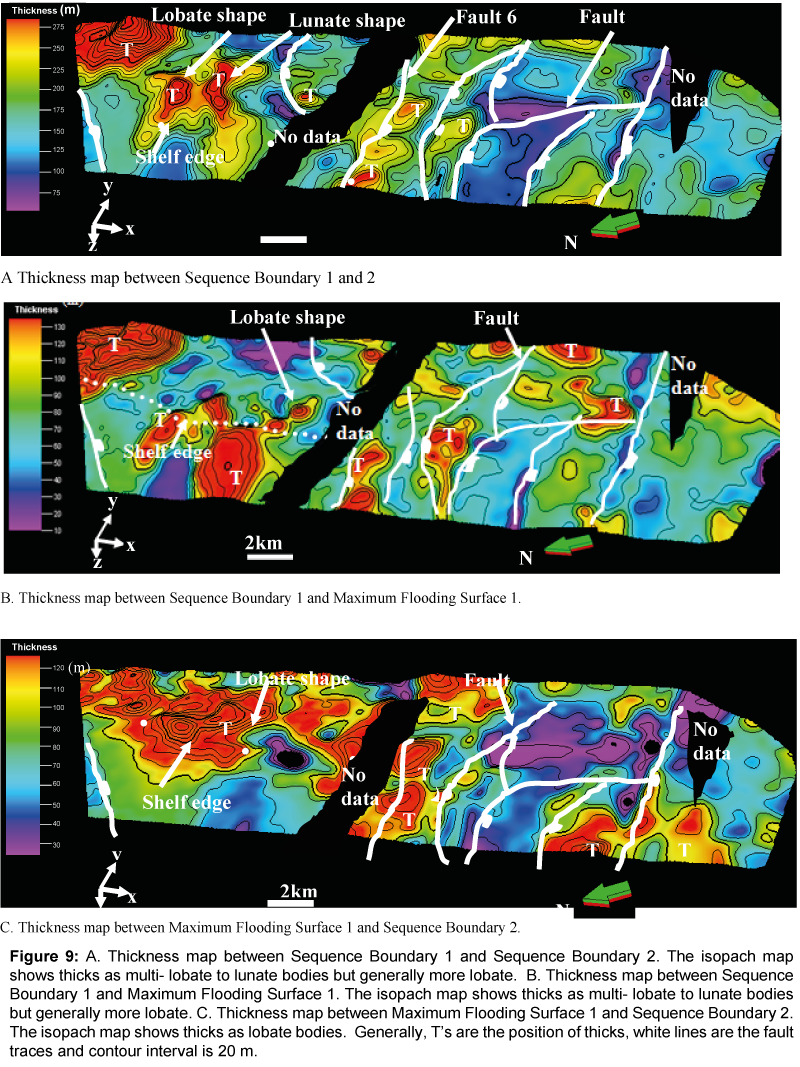
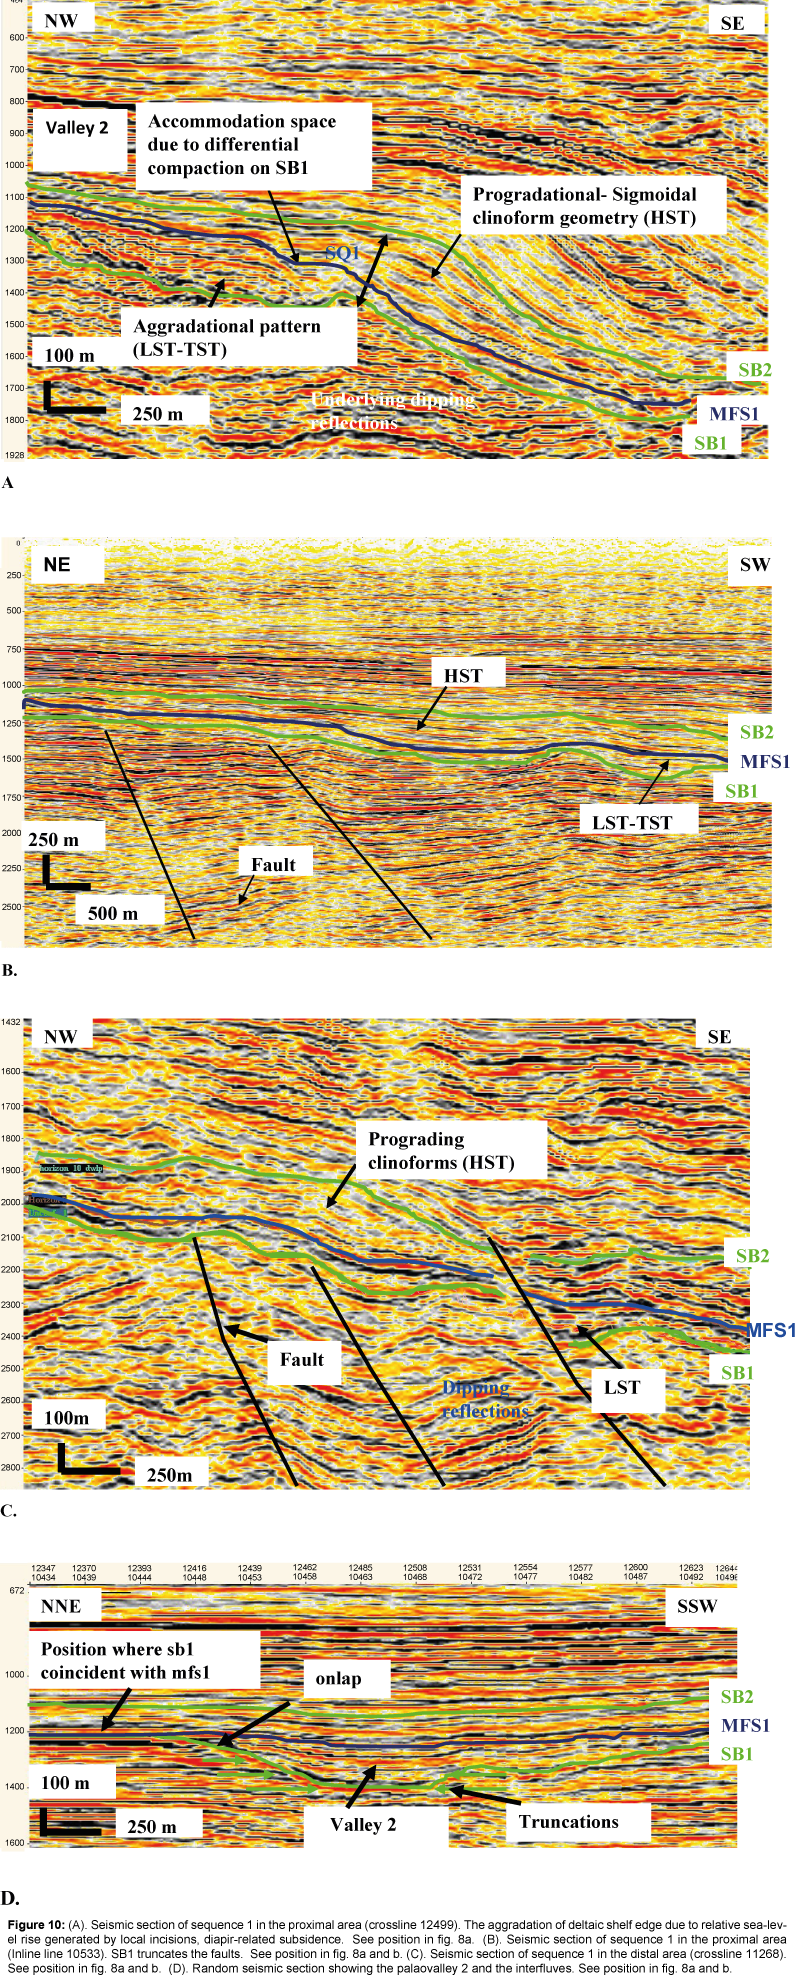
Depositional sequence 1: Depositional Sequence 1 is bounded by Sequence Boundary 1 (Figure 8) at its base and at the top by Sequence Boundary 2. The sequence has maximum thickness of about 480 m (Figure 9). This sequence was partly penetrated by wells Ewan 07 and 08 and the gamma ray log signature within this sequence reflect a monotonous mudstone-dominated interval. The sequence is characterised by major valley incisions at its base and contains aggrading and prograding clinoforms (Figure 10). The aggrading valley fills is up to 100 m thick immediately overlying Sequence Boundary 1, located landward of the shelf break. Maximum Flooding Surface 1 overlies the prograding-aggrading clinoforms that downlap onto the sequence boundary. Towards the top of sequence 1 prograding clinoform downlap on top of Maximum Flooding Surface 1 (Figure 10). These clinoform are up 120 m thick and have a sigmoidal geometry. In the southern part of the study area Sequence 1 is less incised but more complexly faulted (Appendices C and D).
Figure 8: (A) Map view of depth structure map of Sequence Boundary 1, showing position and geometry of the erosional surface, relict shelf break and the position of seismic cross sections. (B) Oblique view of depth structure map of Sequence Boundary 1, showing clearly position and geometry of the erosional surface, relict shelf break, valley axes and the position of seismic cross sections. (C) Depth structure map of Maximum Flooding 1 showing differential compaction caused by incised valleys over SB1. Gamma ray log signature above this surface show an overall aggrading stacking pattern (Figure 3).
Figure 9: A. Thickness map between Sequence Boundary 1 and Sequence Boundary 2. The isopach map shows thicks as multi- lobate to lunate bodies but generally more lobate. B. Thickness map between Sequence Boundary 1 and Maximum Flooding Surface 1. The isopach map shows thicks as multi- lobate to lunate bodies but generally more lobate. C. Thickness map between Maximum Flooding Surface 1 and Sequence Boundary 2. The isopach map shows thicks as lobate bodies. Generally, T’s are the position of thicks, white lines are the fault traces and contour interval is 20 m.
Figure 10: (A) Seismic section of sequence 1 in the proximal area (crossline 12499). The aggradation of deltaic shelf edge due to relative sea-level rise generated by local incisions, diapir-related subsidence. See position in Figure 8a. (B) Seismic section of sequence 1 in the proximal area (Inline line 10533). SB1 truncates the faults. See position in Figures 8a and 8b. (C) Seismic section of sequence 1 in the distal area (crossline 11268). See position in Figures 8a and 8b. (D) Random seismic section showing the palaovalley 2 and the interfluves. See position in Figure 8a and b.
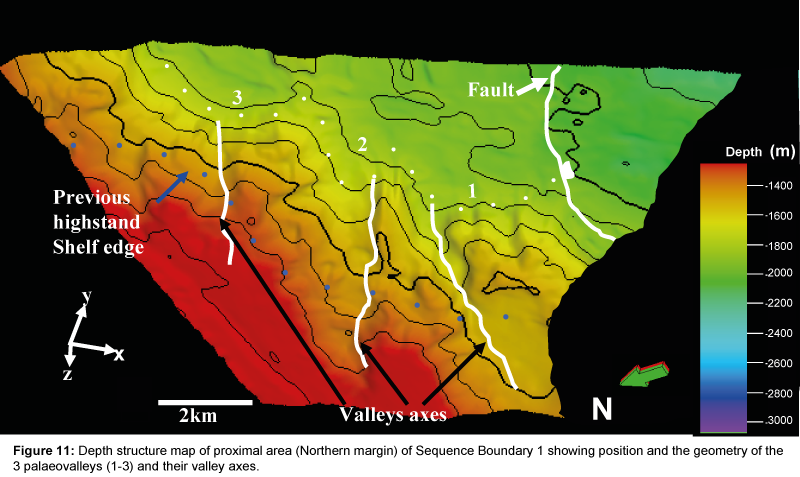
The Sequence Boundary 1 is an irregular unconformity that erosionally truncates dipping reflections. At the proximal area (northern part), three WNW-ESE trending erosional lows, interpreted as palaovalleys, are cut into the underlying strata (Figures 8b and 11; valleys 1, 2 and 3). Valley 1 is the deepest of all with up to 220 m of erosional relief with valleys 2 and 3 having up to 150 m and 120 m of erosional relief respectively. All valleys have tributary-like features and asymmetric cross-sections, with steeper slopes along the northern margins compared to the southern margins (Figures 8 and 11). Truncations of the underlying stratal and onlap characterised Sequence Boundary 1. This sequence boundary is traceable across the study area and truncates underlain growth faults in the proximal area (Appendices A-D), which indicates there is rapid progradation of sediment basinward, where the sedimentation is controlled by faults
The Maximum Flooding Surface (MFS1) is defined by a prominent downlap surface within Depositional Sequence 1, separates the sequence into two seismic packages (Figure 10). The thickness between Sequence Boundary 1 (SB1) and Maximum Flooding Surface 1 (MFS1) is on average approximately 360 m and thins towards the SE. The Maximum Flooding Surface 1 coincides with sequence boundary 1 between the palaeovalley 2.
Depositional Sequence 1 shows a variable and irregular internal reflections pattern characterised by low to moderate amplitude, low frequency reflectors with prograding clinoforms geometry that suggest southward progradation (Appendices A, C and D) (Figure 10). Between SB1 and MFS1 seismic facies consist of variable and progradational aggaradational reflection pattern locally infilling palaeovalleys in the proximal-northern part of the survey with the maximum thickness of about 360 m. In the distal southern part of the survey, seismic facies also consist of variable and aggradational-progradational reflections and they are highly faulted (Appendices A- D) (Figure 10). Above MFS1, the seismic facies consist of progradational clinoforms, with moderate amplitude and reflection continuity (Appendix. A) (Figures 10a and 10c). The maximum thickness of the unit MFS1-SB2 is 270 m (Figure 9c). Thickness variations within the Depositional Sequence 1 (Figure 9a) mostly occur along shelf break of highstand prograding clinoforms with height of above 200 m (Figure 10a). This thickness variation within this Depositional Sequence is as a result of the incisions/incised valleys, HST prograding clinoforms geometry and syn-depositional faulting. Thickness map between SB1 and MFS1 also show evidence of thicks which account for the erosional relief and the unfilling of these incisions resulting in elongate thicks along the palaeovalley axes on SB1. The ESE-WNW trending linear thicks in the northern part of the study are coincident with main palaeovalley axes. Thickness map between MFS1 and SB2 (Figure 9c) also show evidence of thicks which reflects HST prograding clinoform geometry, differential compaction caused by the incision on SB1 and the fault throw (thicks at the hanging wall). The height of HST prograding (about 200 m) thick determined from prograding clinoforms geometry on the shelf break suggesting an increase in accommodation space caused by increase in relative sea level and sediment influx. The isopach maps of sequence 1 show thick bodies as multi-lobate to lunate bodies, but generally more lobate in geometry (Figure 9). The thick bodies show an elongation along the HST 1, and are about 1 km to 4 km wide.
Based on their stratigraphic position within the sequence and reflection geometry, the palaeovalleys fill seismic facies are interpreted to be Lowstand System Tract (LST) and Transgressive System Tract (TST). The unit above MFS1 is interpreted as a Highstand System Tract (HST) that is truncated by the overlying Sequence Boundary 2. The HST prograde over the underlying LST in the down dip.
Interpretation shows that, during the time of lowstand, several incised valleys/canyons were developed. These incised valleys/canyons acted as a sand feeder that led to the deposition sandstones on the slope and within the basin floor setting. The above observations show that the development of this Depositional Sequence is characterised by fall of relative sea level below the previous HST shelf edge, where the sands influx to the slope and basin floor by forced regression, followed by a sea level rise. Sea level fall have led to pronounced incisions on the shelf edge which also in turn caused instability at the shelf margin. The striking feature within this Depositional Sequence is the depth of palaeovalleys cuts on the Sequence Boundary 1 i.e. up to 220 m; partially reflect underlying structural control (Figure 10a). This might be caused by uplift due to the shale diapir.
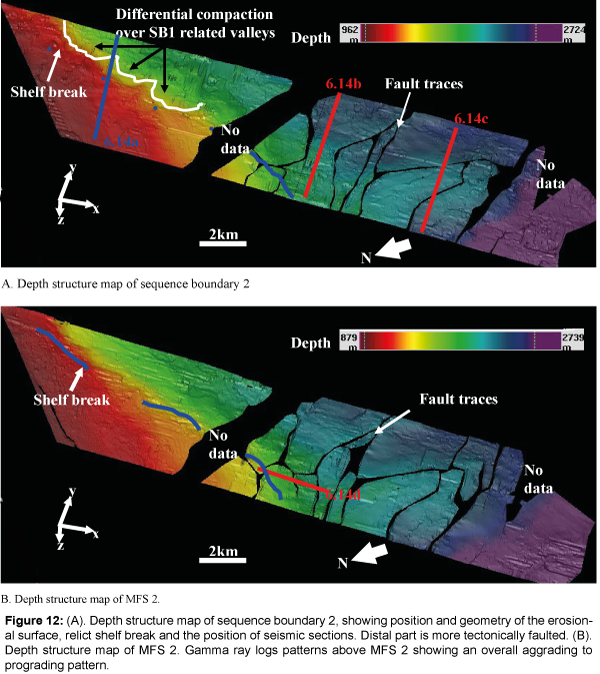
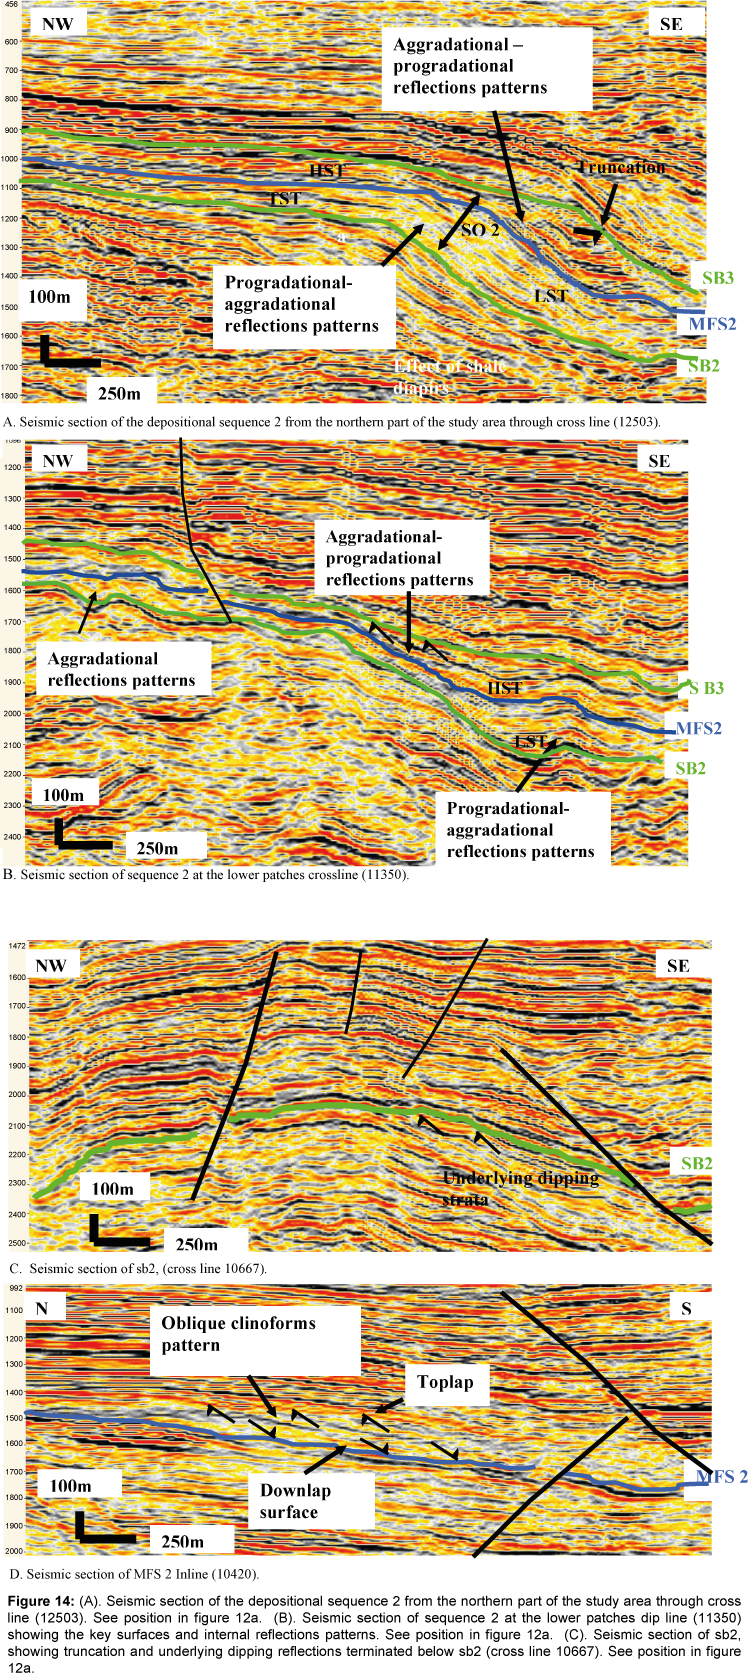
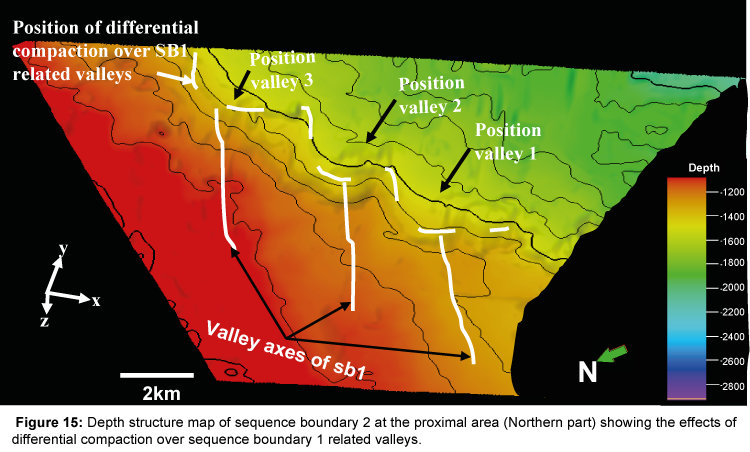
Depositional sequence 2: Depositional Sequence 2 has a maximum thickness approximately 410 m and is bounded at the base by Sequence Boundary 2 and at the top by Sequence Boundary 3. This sequence is penetrated by all the Ewan wells that show high gamma ray serrated and cleaning upward motifs (Appendix B) (Figure 3). Internally, Depositional Sequence 2 is characterised by aggrading and prograding clinoforms geometry on dip direction. Maximum Flooding Surface 2 overlies the prograding-aggrading clinoforms that downlap onto the sequence boundary while the highstand prograding clinoforms downlap onto the Maximum Flooding Surface 2 on dip direction (Appendix A). At the shelf break of the previous HST, clinoforms geometry is up to 200 m thick. At the proximal part of the study area (northern area) SB2 is characterised by an irregular erosional surface (Figure 12). This irregular erosional surface is similar to Sequence Boundary 1 (Figure 8b). This can be viewed in respect of the position and geometry of palaovalleys. These subsidences do not prove they are valley as described in SB1 but they are effect differential compaction over SB1 related valleys. These related valleys also have asymmetric cross-sections with a steeper geometry at the northern margin compared to southern margin. Truncations of the underlying Sequence 1 strata and onlap of younger Sequence 2 strata characterise Sequence Boundary 2.
Figure 12: (A). Depth structure map of sequence boundary 2, showing position and geometry of the erosional surface, relict shelf break and the position of seismic sections. Distal part is more tectonically faulted. (B). Depth structure map of MFS 2. Gamma ray logs patterns above MFS 2 showing an overall aggrading to prograding pattern.
Maximum Flooding Surface (MFS2) lies within Depositional Sequence 2 and is a defined by downlap surface at the down dip (Appendices A and C) (Figures 2 and 12b). The stratal unit between SB2 and MFS2 with maximum thickness of 250 m (Figure 13). The second seismic unit is between MFS2 and SB3 with thickness up to 300 m. From well logs, this Maximum Flooding Surface was encountered at approximately 1925 m in Ewan 07 and at a progressively shallower depth in Ewan 08, 05, 05b and 12i at about 1894 m, 1870 m, 1854 m and 1810 m respectively. Gamma ray log signature within this surface is defined by high serrated gamma ray log motif.
Figure 13: A. Thickness map of Sequence Boundary 2 and 3. The isopach map shows thicks along shelf break and basinward. B. Thickness map between Sequence Boundary 2 and Maximum Flooding Surface 2. The isopach map shows thicks as lobate bodies. C. Thickness map between Maximum Flooding Surface 2 and Sequence Boundary 3. The isopach map shows thicks as lobate bodies. Generally, T’s are the position of thicks, white lines are the fault traces and contour interval is 20 m.
Depositional Sequence 2 is characterised by three distinct seismic facies (i) moderate amplitude, variable and irregular internal reflections, (ii) low frequency reflectors and (iii) internal aggrading and prograding clinoforms (Figure 14). Between SB2 and MFS2, facies consist of progradational-offlap clinoforms onlapping onto SB2 at the shelf edge and downlapping seaward (Appendices A and C). Gamma ray logs within this interval show a cleaning up motif (up to 35 m thick) terminated by a flooding surface in the Ewan 07, 08, 05 and 12i wells. The facies within this interval is interpreted to be slope channel sands overlying by lower shoreface muddy sandstones within the Ewan Field. In the Ewan 07 well, the facies is characterised by monotonous fine sand with no deposition of slope channel sand. This indicates that the slope channel sand has thinned out or faulted out.
Figure 14: (A) Seismic section of the depositional sequence 2 from the northern part of the study area through cross line (12503). See position in Figure 12a. (B) Seismic section of sequence 2 at the lower patches dip line (11350) showing the key surfaces and internal reflections patterns. See position in Figure 12a. (C) Seismic section of sb2, showing truncation and underlying dipping reflections terminated below sb2 (cross line 10667). See position in Figure 12a.
Between MFS2 and SB3, the seismic unit comprises aggrading to prograding clinoforms, characterised by moderate amplitude that downlap onto MFS2. This package is truncated by Sequence Boundary 3 and more complexly faulted in the distal area compared to proximal area, which indicates that they are more tectonically active in the down dip (Appendices A, C, and D) (Figure 14). Well logs within Ewan field, indicate that this interval is characterised by high serrated gamma ray motifs intercalated with cleaning upward stacking patterns. Sand development is prominent in the other Ewan wells (Ewan 08, 05, 05a, 05b and 12i) except Ewan 07. From the well log correlation, gamma ray logs through the up thrown blocks within this succession (Ewan 08), suggest a mix of upward cleaning, blocky and upward fining successions. At the down-thrown side of the same fault block, the gamma ray log motif through this sequence shows monotonous mudstone and fine grained sandstone as observed from Ewan 07 (Figure 3 and Appendix B). This reflects local variability in type of sediment influx and grain size distribution. Thickness variations within Depositional Sequence 2 (SB2-SB3; Figure 13) mostly occurred along the shelf break of highstand prograding clinoforms. This thickness variation is as a result of HST clinoform geometry, accommodation space created by differential compaction and syn-deposition faulting. The HST prograding thick is determined by the height of prograding clinoforms geometry on the shelf break. Thickness map between SB2 and MFS2 show evidence of thickening mostly along the previous HST shelf break, where there is evidence of incision/incised valley and in the hanging wall of the growth faults at the distal part. This thickness variation reflects effect of differential compaction coupled, with relative sea level fall and fault movement (thickening within the hanging wall block) (Figure 13b). Thickness map between MFS2 and SB3 show evidence of thickening along Sequence 1 HST shelf break. This reflects Sequence 2 HST aggrading-prograding clinoforms geometry and also syn-depositional fault movement during Sequence 2 development (Figure 13c). Thicks bodies show lobate bodies along shelf break. Thick are about 6-7 km wide.
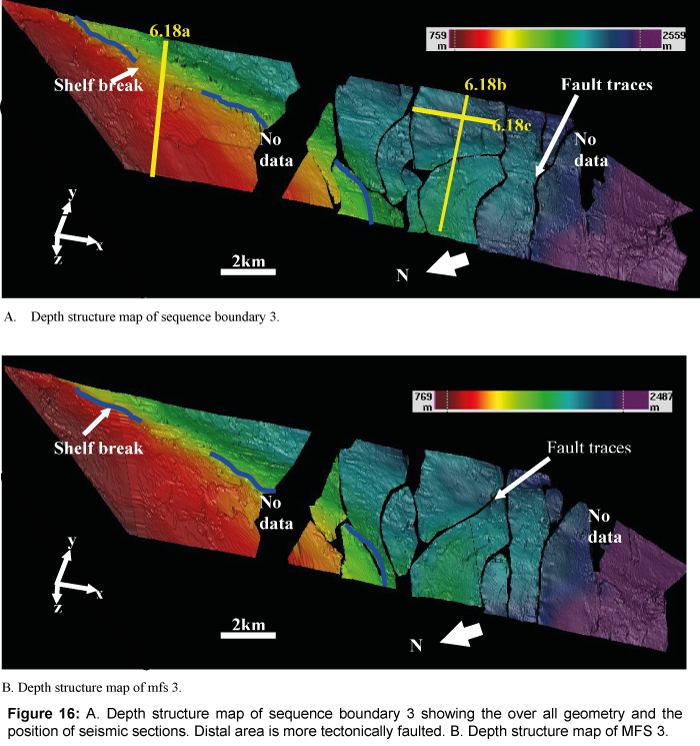
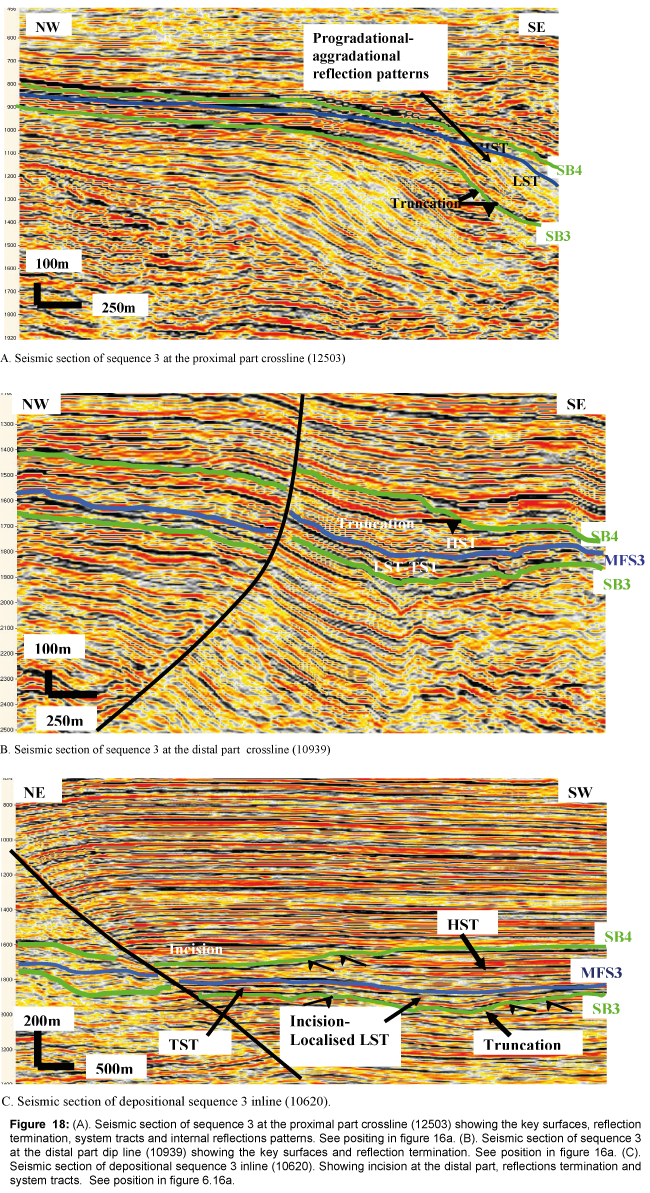
Depositional sequence 3: Depositional Sequence 3 has a maximum thickness of about 380 m and is bounded at its base by Sequence Boundary 3 (Figure 15) and at the top by Sequence Boundary 4. These two bounding surfaces show a clearly defined incision along their interpreted surfaces. Seismically, this sequence consists of aggrading and prograding clinoform patterns (Appendices A, C and D). MFS 3 (Figure 16) overlies the prograding-aggrading clinoforms that downlap onto the sequence boundary 3 while the highstand prograding clinoforms downlap onto the Maximum Flooding Surface 3 (Appendix A). The highstand prograding clinoforms reflection patterns is up to 200 m thick and it thickens basinward. This sequence is penetrated by all the Ewan wells and partially penetrated by Oloye 03 well. Gamma ray log motifs shows high serrated gamma, cleaning upward and dirtying upward motifs (Figure 3 and Appendix B).
Sequence Boundary 3 is characterised as an irregular erosional surface (Figures 6 and 16). This sequence boundary is characterised by incision up to 120 m. This incision is widening in the seaward direction. Truncations of the underlying stratal and onlap characterised Sequence Boundary 3 (Appendix A). Seismic reflection above the sequence boundary is characterised by progradational-aggradational reflection patterns. Gamma ray log signatures above this surface within Ewan and Oloye fields shows a turn around from cleaning upward and dirtying upward motifs (Figures 17 and 18).
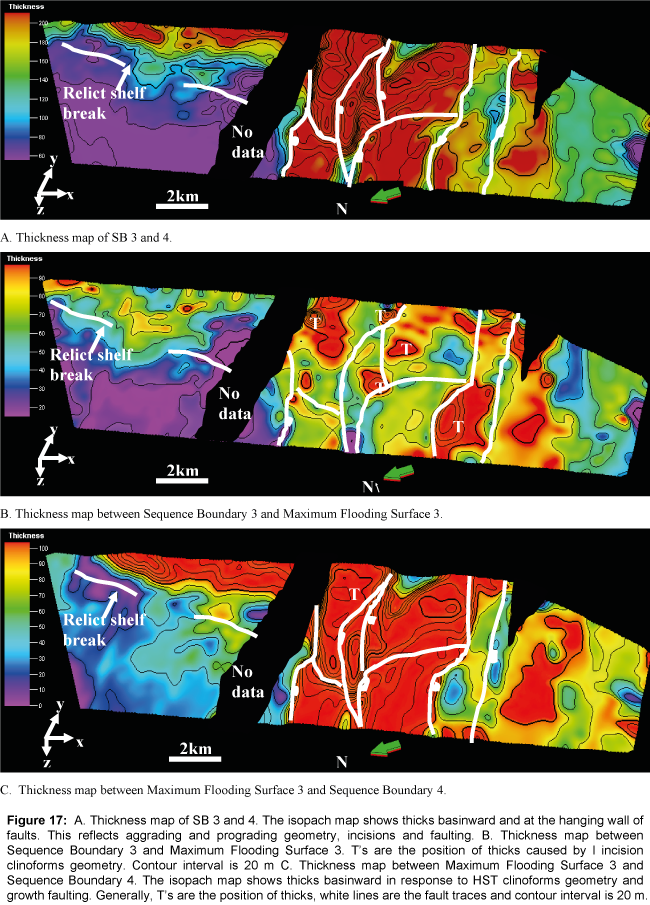
Figure 17: A) Thickness map of SB 3 and 4. The isopach map shows thicks basinward and at the hanging wall of faults. This reflects aggrading and prograding geometry, incisions and faulting. B) Thickness map between Sequence Boundary 3 and Maximum Flooding Surface 3. T’s are the position of thicks caused by l incision clinoforms geometry.
Figure 18: (A). Seismic section of sequence 3 at the proximal part crossline (12503) showing the key surfaces, reflection termination, system tracts and internal reflections patterns. See positing in Figure 16a. (B). Seismic section of sequence 3 at the distal part dip line (10939) showing the key surfaces and reflection termination. See position in Figure 16a. (C). Seismic section of depositional sequence 3 inline (10620). Showing incision at the distal part, reflections termination and system tracts. See position in Figure 6.
The Maximum Flooding Surface within this sequence is defined by a downlap surface. At the distal area incision directly overlies the SB3 on interfluves. Gamma ray log signature within this surface is defined by high serrated gamma ray log motif.
Depositional Sequence 3 is characterised by moderate to high amplitude, variable and irregular reflection patterns with internal prograding and aggrading clinoforms geometry that suggest northsouth progradation (Appendices A, C and D) (Figures 18a and 18b). Seismic facies between SB3 and MFS3 consist of variable, progradational-aggradational reflection patterns overlying by MFS3 in the proximal area (Figure 18). At the distal part where there is incision the package is characterised by aggrading reflections patterns infilling the incised valleys (Figure 18c). Gamma ray log signature within this unit is characterised by dirtying upward, which has been interpreted to be slope channel sand overlain by a transgressive (Figure 3). Above MFS3 the seismic facies consists progradational clinoforms of moderate amplitude that downlap directly on MFS3. This unit is truncated by the overlying erosional surface of SB4 (Appendix A) (Figure 18c). Gamma ray log motifs within this interval generally show high serrated gamma ray which are intercalated with gradual cleaning upward motifs in the upper part of the unit (Figure 3). The high gamma ray serrated motifs have been interpreted to be lower shoreface deposit while the gradual cleaning upward motifs have been interpreted to be upper shoreface deposits. Thickness variations within Depositional Sequence 3 (Figures 17a-17c) mostly occurred at the basinward part and the thicks reflect clinoform geometry, incision and syn-depositional faulting. The maximum thickness between the SB3 and MFS3 is about 170 m (Figure 17b). Thick occurs as lobate bodies mostly where there incision and at the down thrown side of the growth faults (Figure 17b). The maximum thickness between the MFS3 and SB4 is about 260 m (17c) thicks are located seaward which reflects prograding clinoforms geometry of HST and accommodation space created by tectonic activities (growth faulting).
The development of lowstand prograding wedge within this sequence (Figure 18a) indicates reestablish of delta at the shelf edge during rise of relative sea level, after a period of lowstand below the shelf edge, [2]. Area where the surface is deeply incised, (Figure 18c) LST deposits are restricted to the valley fills and the maximum flooding surface (MFS3) marks the top of the incision. Outside the LST valleys, MFS3 and SB3 are coincident on interfluves. This suggests that during LST times most of the area was periodically subaerially exposed. The incision along the bounding sequence boundaries at the distal area suggests the locus of erosion and deposition were shifted basinward during the development of the sequence. From seismic data, this sequence thickens basinward; this may also reflect basinward shifts in depocentres coupled with the effect of accommodation created by incision/canyons basinward. From the well log (Figure 3) (Appendix 6B) the slope channel sand unit overlying the SB3 is also thin on the hanging wall of the fault block as observed from Ewan 07; this might be faulted out or shale out.
Contour interval is 20 m C. Thickness map between Maximum Flooding Surface 3 and Sequence Boundary 4. The isopach map shows thicks basinward in response to HST clinoforms geometry and growth faulting. Generally, T’s are the position of thicks, white lines are the fault traces and contour interval is 20 m.
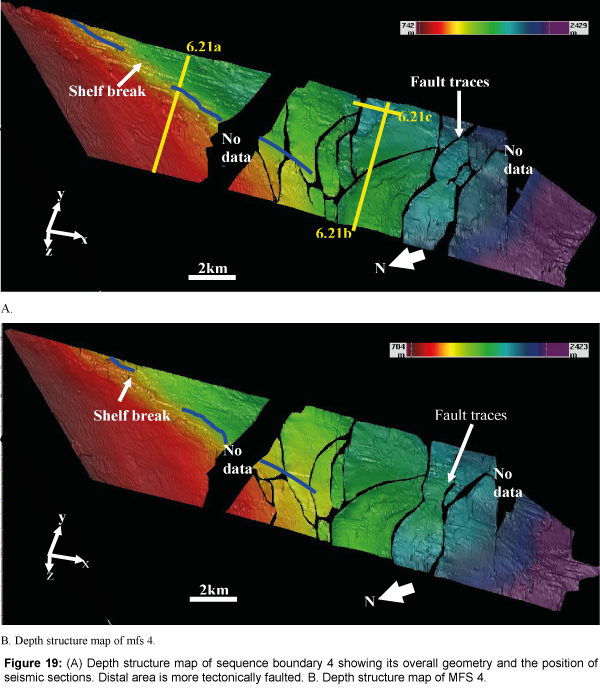
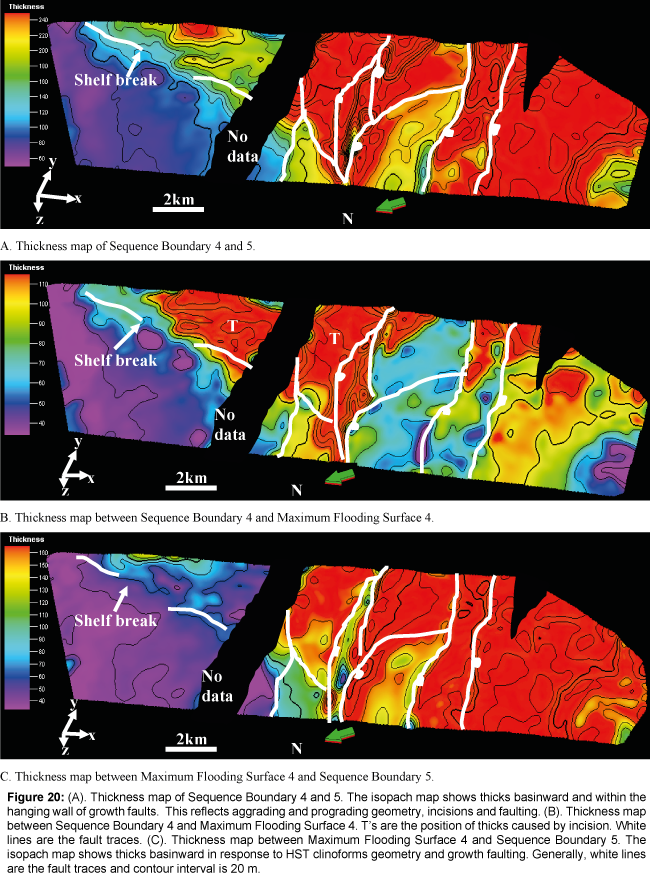
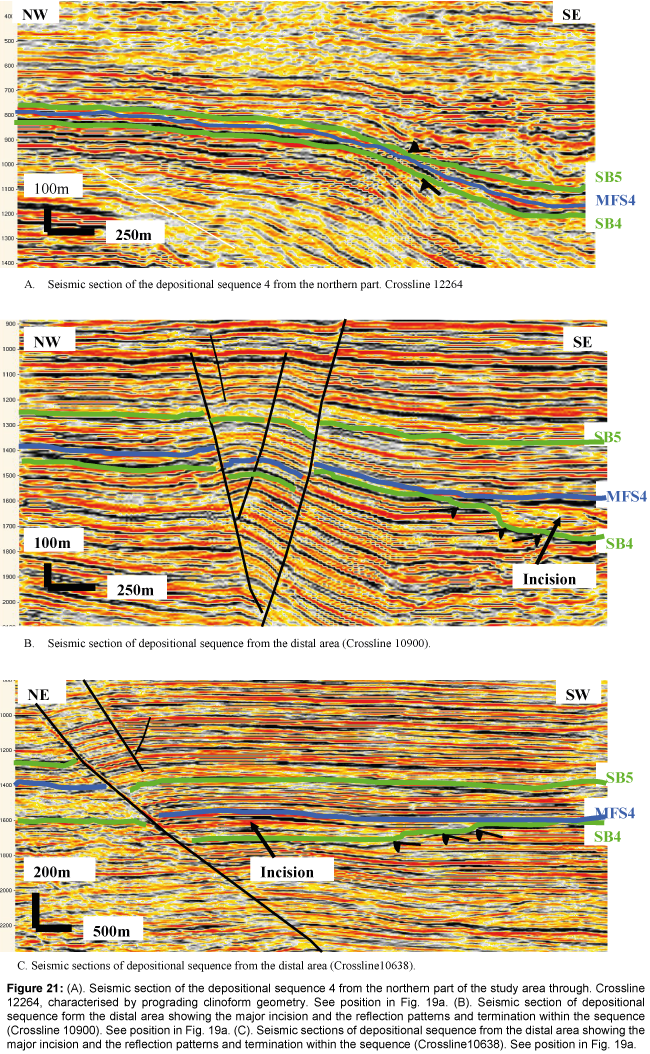
Depositional sequence 4: Depositional Sequence 4 is bounded by Sequence Boundary 4 at the base and Sequence Boundary 5 at the top. This sequence is fully penetrated by all the Ewan wells and Oloye 03 well (Appendix B) (Figure 3). Seismically, this sequence consisting of two units characterised by aggrading and prograding clinoforms (Appendices A, C and D) and gamma ray log signatures show a variety of blocky, high serrated gamma and cleaning upward motifs. Maximum Flooding Surface 4 overlies prograding-aggrading clinoforms that downlap onto the sequence boundary 4 while the highstand prograding clinoforms downlap onto the Maximum Flooding Surface 4 (Appendix A) Sequence Boundary 4 is characterized by an irregular erosional surface with evidence of truncation of inclined reflection on the shelf edge break. In the distal area of seismic data, the sequence boundary is characterized by d incision which is up to 110 m of localized truncation in the underlying HST (Figures 19-21). Above SB4 in some places i.e., where there is incision Maximum Flooding Surface 4 coincide with SB4 Figures 21b and 21c) and gamma ray log signatures above this surface within Ewan and Oloye fields show blocky stacking patterns. The Maximum Flooding Surface (MFS 4; Figure 19b) within this sequence is defined by downlap surface and where there is an incision, the maximum flooding surface caps the top of the incision (Figures 21b and 21c). This surface separates this sequence into two seismic packages (i) aggrading unit and (ii) prograding unit. Gamma ray log signature above this surface is defined by high serrated gamma ray log motif (Figure 3 and Appendix B).
Figure 20: (A) Thickness map of Sequence Boundary 4 and 5. The isopach map shows thicks basinward and within the hanging wall of growth faults. This reflects aggrading and prograding geometry, incisions and faulting. (B) Thickness map between Sequence Boundary 4 and Maximum Flooding Surface 4. T’s are the position of thicks caused by incision. White lines are the fault traces. (C) Thickness map between Maximum Flooding Surface 4 and Sequence Boundary 5. The isopach map shows thicks basinward in response to HST clinoforms geometry and growth faulting. Generally, white lines are the fault traces and contour interval is 20 m.
Figure 21: (A) Seismic section of the depositional sequence 4 from the northern part of the study area through. Crossline 12264, characterised by prograding clinoform geometry. See position in Figure 19a. (B) Seismic section of depositional sequence form the distal area showing the major incision and the reflection patterns and termination within the sequence (Crossline 10900). See position in Figure 19a. (C) Seismic sections of depositional sequence from the distal area showing the major incision and the reflection patterns and termination within the sequence (Crossline10638). See position in Figure 19a.
Seismically, Depositional Sequence 4 is characterised by low to moderate amplitude, overall prograding clinoforms that suggest southward progradation (Appendices A, C and D) (Figure 21). Between SB4 and MFS4 seismic facies consist of variable and progradationalaggaradational clinoforms. Within incised valley fill, seismic character is defined as low to moderate amplitude and variable reflections (Figure 21). Gamma ray logs motifs within this interval show an upward cleaning to blocky log motif trend overlain by high gamma serrated log motif. This seismic facies have been interpreted to be slope channel sand and lower shoreface deposits respectively [9,10].
Above MFS4, seismic facies consist of aggradational-progradational clinoforms, moderate amplitude and reflections continuity both at the proximal and distal areas. Gamma ray logs signatures within this interval show high serrated trace, overlain by a gradual cleaning upward trend which has been interpreted to be lower shoreface muddy sandstone and upper shoreface sand respectively. Thickness variations with this sequence (SB4-SB5) reflect highstand aggrading-prograding clinoforms geometry, incisions and growth faulting (Figure 20a). Between SB4 and MFS4 (Figure 20b) show thicks reflect incision and accommodation space created within the subsidence in the hanging wall of growth faults (Figure 20b). Thickness map between MFS4 and the overlying sequence boundary SB5, (Figure 20c) show thicks which reflects aggrading-prograding clinoforms of HST and accommodation space created by tectonic activities (growth faulting).
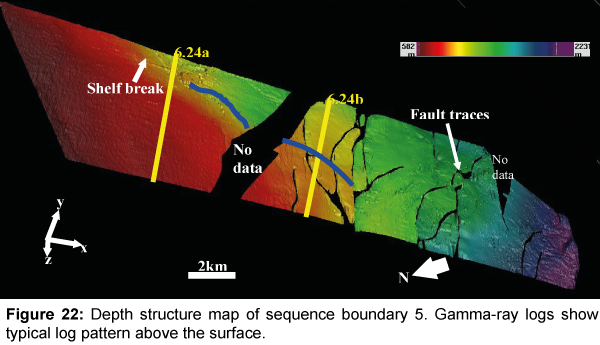
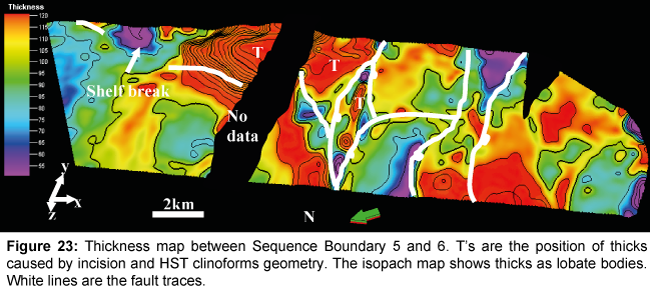
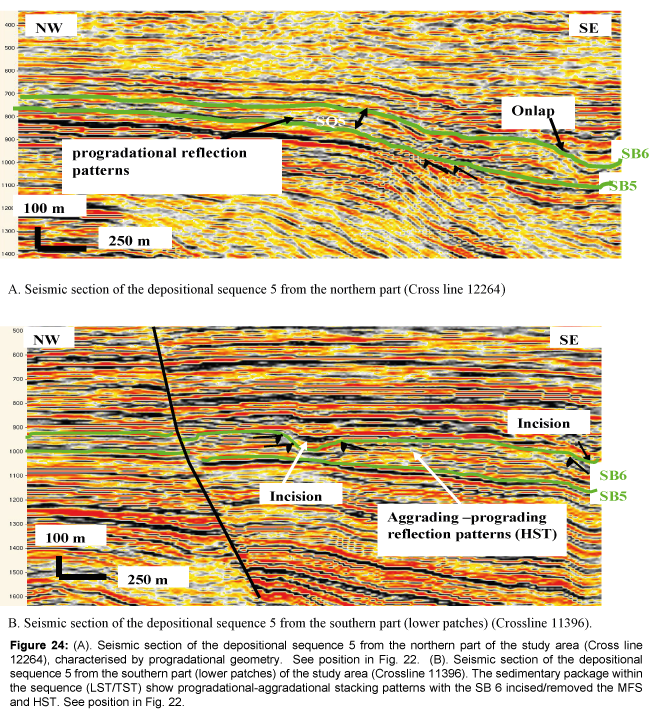
Depositional sequence 5: Depositional Sequence 5 is bounded at the base by Sequence Boundary 5 (Figures 22 and 23) and at the top by Sequence Boundary 6. This sequence is characterized by progradational geometry (Appendices A, C and D) (Figure 24a). In seismic cross section, this sequence is also characterized by low to moderate amplitude, moderate continuity reflection and widespread lateral distribution (Figure 24). This sequence is fully penetrated by all the Ewan wells and Oloye 03 well. Gamma ray log signatures within this sequence show dirtying and cleaning upward signature and it is described as bow shape geometry (Figure 3 and Appendix B).
Figure 24: (A) Seismic section of the depositional sequence 5 from the northern part of the study area (Cross line 12264), characterised by progradational geometry. See position in Figure 22. (B) Seismic section of the depositional sequence 5 from the southern part (lower patches) of the study area (Crossline 11396). The sedimentary package within the sequence (LST/TST) show progradational-aggradational stacking patterns with the SB 6 incised/removed the MFS and HST. See position in Figure 22.
Sequence Boundary 5 (Figure 22) is an irregular unconformity with some evidence of incisions (Figures 24a and 24b). At the southern part of the survey, further evidence of erosion along this surface is provided by the truncation of moderately inclined reflections (Figure 24b). Within this sequence, no evidence for the presence of a maximum flooding surface was observed, may be, the mfs is likely to be outside of the data or cut by a major candidate sequence boundary (SB6), and probably the transgressive surface has been eroded at this location. Gamma ray log signature above this surface marked the base of cleaning upward motif (Figure 3) (Appendix B) (Figures 22-25).
Thickness map between SB5 and SB6 is average 320 m maximum (Figure 23). Thickening mostly occurred at the shelf break and extends basinward, which reflect LST incision and HST aggrading-prograding clinoforms geometry (Appendix A). These thicks occurred as lobate bodies and are about 1-6 km wide. The dirtying upward followed by cleaning upward gamma ray log signatures (bow-shape log motif) within this sequence suggests waxing and waning of sand sedimentation rate (Emery and Myers, 1996) Figure 3, Appendix B). The sequence is sandy than all the lower sequences, and is interpreted as tidal/fluvial channel sand [10]. The increase in sand content upwardly, (Figure 3) indicates that we are at the uppermost section of the interpreted section (Agbada Formation), grading into the fully continental sand interval of the Benin Formation.
Depositional sequence 6: This Depositional Sequence is bounded at its base by Sequence Boundary 6 overlying by coastal barrier sands while the upper part of the sequence is made up of undifferentiated continental deposit. This sequence is penetrated by all the wells except Ewan 05, 5a and 5b (Figure 3) (Appendix B). Reflection patterns within this sequence are defined by the progradational-aggradational stacking patterns (Appendices A, C and D). Their gamma ray logs reflect a stacked of cleaning up stacking patterns (Figure 3).
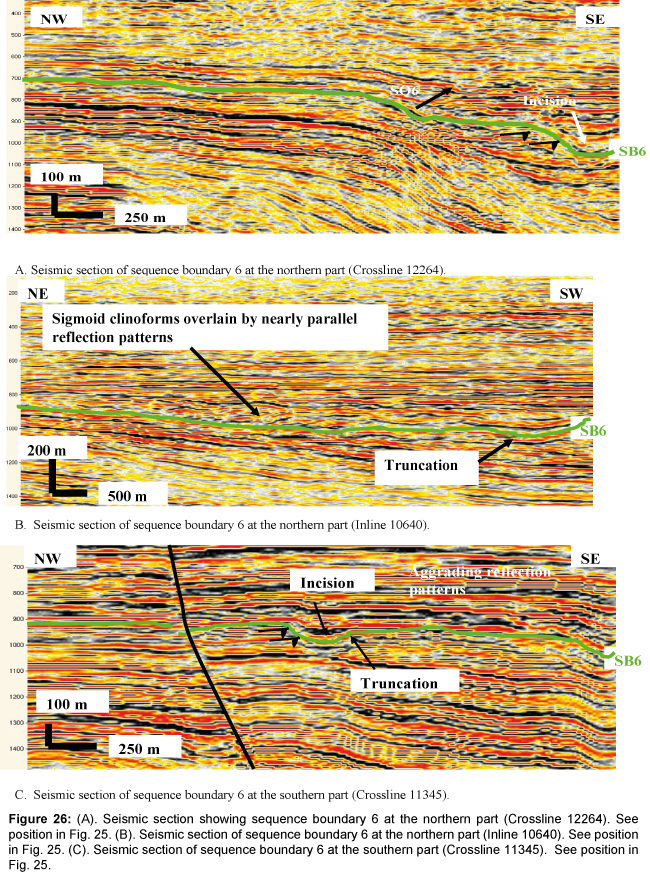
Sequence Boundary 6 is characterised by an irregular erosional surface, truncations of the underlying stratal and onlap (Figure 25). There is evidence of incisions up to 150 m deep and up to 16 km wide that cut into the underlying LST/TST of sequence 5 (Figure 26) (Appendix A). In more distal areas, this incision are less pronounced but further evidence of erosion along this surface is provided by the truncation and incision of moderately inclined reflections (Figure 26). Gamma ray log signature above this surface marked the base of cleaning upward motif. Within this sequence, no evidence for the presence of a maximum flooding surface was observed, may be, the mfs is likely to be outside of the data.
Figure 26: (A) Seismic section showing sequence boundary 6 at the northern part (Crossline 12264). See position in Figure 25. (B) Seismic section of sequence boundary 6 at the northern part (Inline 10640). See position in Figure 25. (C) Seismic section of sequence boundary 6 at the southern part (Crossline 11345). See position in Figure 25.
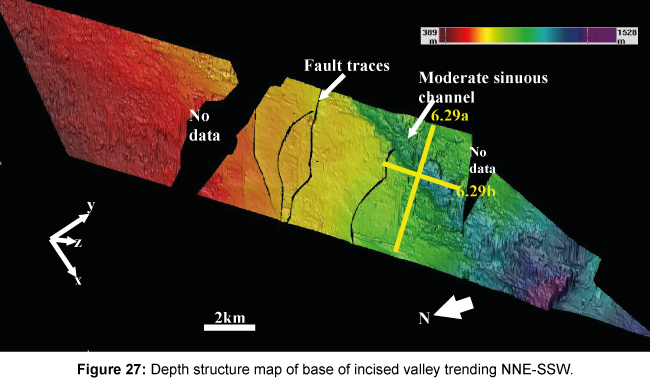
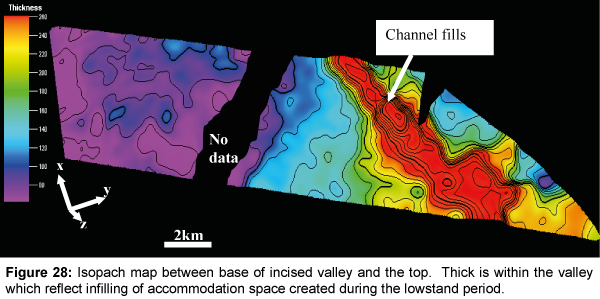
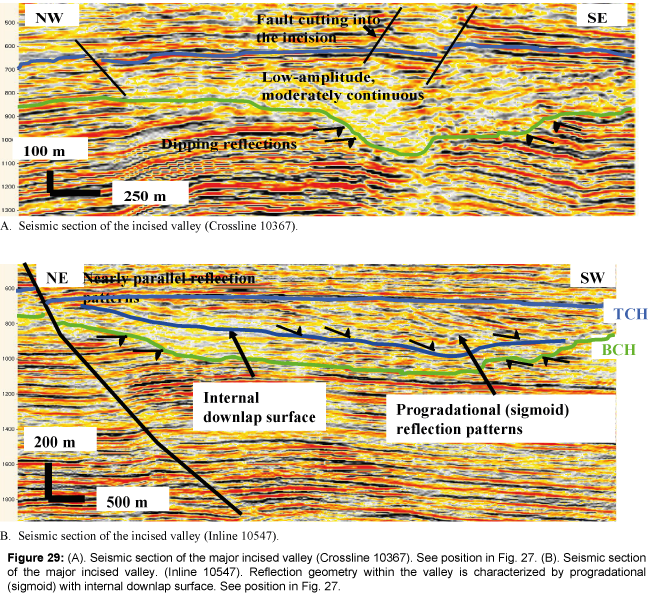
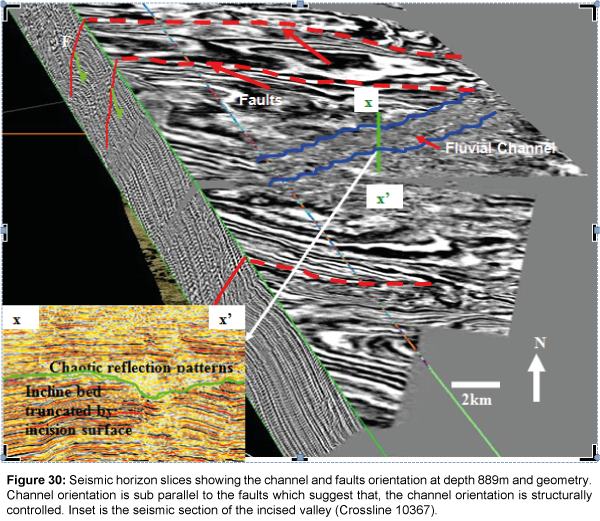
Seismically, this sequence is characterised by moderate amplitude, reflection continuity. There is a major erosional incision (incised valley) cuts into this sequence in the distal area located at the upper part of the sequence. The depth of this incised valley is up to 350 m deep and greater than 15 km wide, but it is difficult to know the overall width due to the incision extending beyond the area of the survey (Appendices C and D) (Figures 27 and 28). Seismic reflections within this incision are of low amplitude, moderately continuous-chaotic and progradational (sigmoid) while the reflections above the valley fill are nearly parallel, with moderate-high reflection amplitude (Figure 29). Seismic horizon slices through this incised valley at depth 889 m show northwest-southeast orientation of straight to sinuous channels within a more chaotic and low amplitude background (Figure 30). The magnitude of the incised valley increases southward truncating the underlying rollover anticline strata. This suggests the locus of erosion and deposition shifted basinward and it is structurally controlled. This major incised valley surface truncates some of the growth faults, and some faults are cut into the valley at the top. This suggests that some of the faults were inactive during the creation of sequence boundary 6. Fault cutting into the valley fills. Thickness map between base of the valley (BCH) and top of the valley (TCH) is 260 m maximum (Figure 28). Thicks are coincident with main axis of the incised valley which reflects accommodation space created by relative sea level fall which caused the valley to be incised couple with shelf instability. This incised valley created significant accommodation space which is filled by a progradational-aggradational of deltaic system during the early sea level rise. From well logs, this uppermost sequence is dominantly sandy and exhibits progradational parasequences coastal barrier and undifferentiated continental deposit, identified from wireline stacking patterns. An increase in the sand content upwardly within the sequence indicates that we are at the uppermost section of the interpreted section (Agbada Formation), grading into fully continental sands deposits interval (Benin Formation).
Figure 29: (A) Seismic section of the major incised valley (Crossline 10367). See position in Figure 27. (B) Seismic section of the major incised valley. (Inline 10547). Reflection geometry within the valley is characterized by progradational (sigmoid) with internal downlp surface. See position in Figure 27.
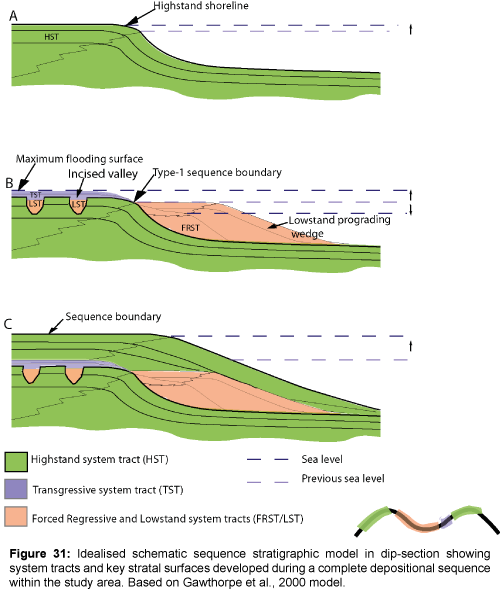
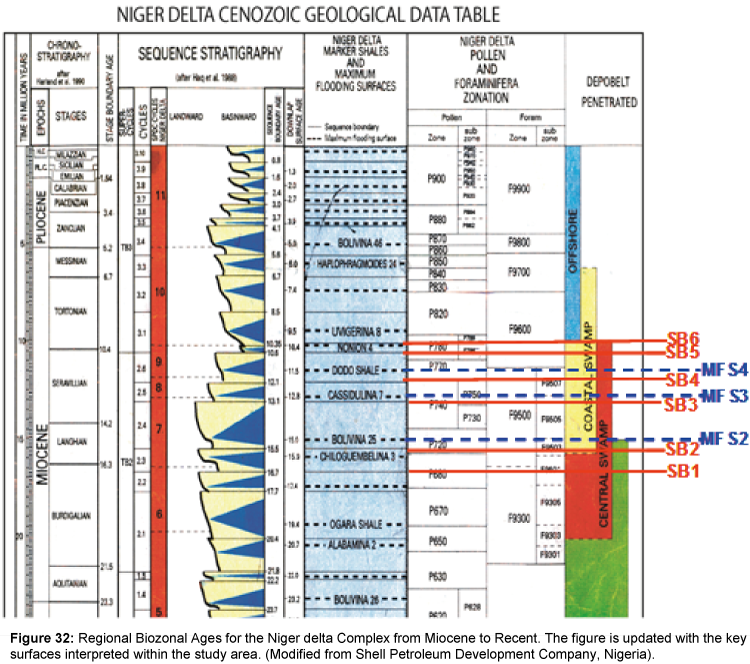
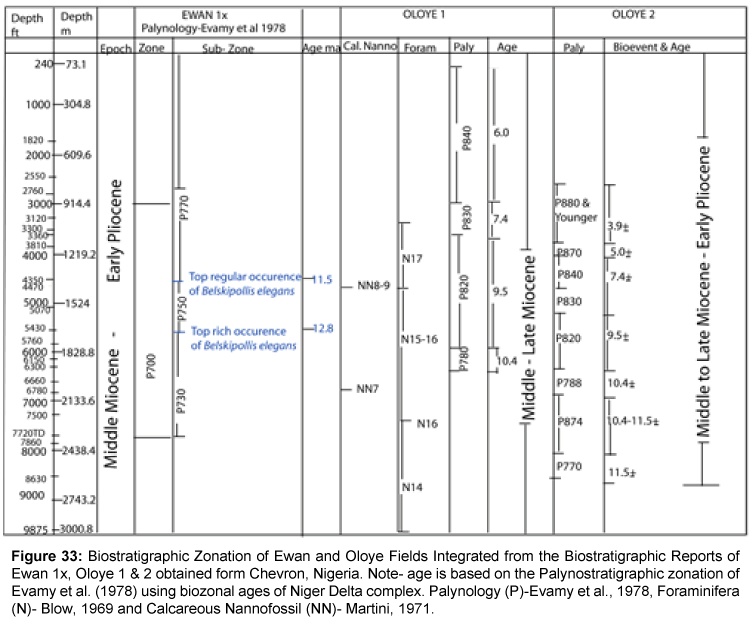
Idealized sequence stratigraphic development model within the study area are summarized in Figures 31-33.
Figure 33: Biostratigraphic Zonation of Ewan and Oloye Fields Integrated from the Biostratigraphic Reports of Ewan 1x, Oloye 1 and 2 obtained form Chevron, Nigeria. Note- age is based on the Palynostratigraphic zonation of [9] using biozonal ages of Niger Delta complex. Palynology (P)-[9], Foraminifera (N)- Blow and Calcareous Nannofossil (NN)- Martini.
Discussion
Specific ages are assigned to the key surfaces based on the integration of biostratigraphic report with documentation by Doust and Omatsola, 1990 and the regional biozonal ages of Niger delta complex proposed by Shell Nigeria. The difficulty with a subsurface study in the Niger Delta is that most of the subsurface data especially the biostratigraphic data, is not publicly available. Therefore, the age constraint within this studies relies upon integration of the biostratigraphic report from three wells (Ewan 1x, Oloye 1 and 2). The age dating is based on palynostratigraphic zonation of Niger Delta documented by Evamy [9]. It should be noted that Ewan 1x is at the proximal end and is higher in the stratigraphic section compared to Oloye 1 and 2 (Figure 1).
The age of the MFS4 surface that defines the downlap surface of depositional sequence 4 is constrained by the palynostratigraphic zonation of [9] within Ewan 1x at a depth 1326 m as the top of regular occurrence of Belskipollis elegans which is 11.5 Ma (middle Miocene).
The age of MFS3 is constrained to be the top rich occurrence of Belskipollis elegans at depth 1655 m. However, based on the above constrains, the base of the sequence 4 will be the unconformity below MFS4 which is constrained to be 12.1 Ma while the immediate sequence boundary is dated as 10.6 Ma (Figures 32 and 33). The base of sequence boundary 3 will be older in age compared with the age of MFS3 and it is interpreted to correspond to 13.1 Ma. The ages of the key surfaces mapped below this sequence will be older in age. Based on the biostratigraphic zonation report above, the age of the studied section is middle Miocene to early Pliocene (Figure 33).
Based on above constraints, the four depositional sequences recognised from the well logs and the maximum flooding surfaces identified are;-11.5 Ma MFS, 12.8 Ma MFS, and 15.0 Ma MFS at depth c1260 m, c1650 m and c1925 m respectively on Ewan 07 (Figure 3). The MFS of other wells was extrapolated and correlated using well log stacking patterns.
Interpretations and descriptions of depositional sequences suggest that most sequence boundaries are eroded by sea level lowstand incision of the shelf, coupled with increased shelf instability and slope collapse structures. Patterns of sequence erosion occur both on the footwalls and hanging walls (but deeper mostly in the hanging wall) and deposits thickens across downthrown fault blocks, suggesting that most of these faults were active during the middle Miocene time of Agbada Formation deposition. The restriction of lowstands system tract deposits to within the valley fills across the entire study area, and the occurrence of deep incisions, suggests that the entire shelf region became periodically subaerially exposed during the successive relative sea level falls.
Within the study area, a general thinning of the sequences upward and basinward were observed. The thinning of the sequences basinward from the shelf edge occurred over a few kilometres. This supports a shelf-edge deltaic depositional setting. Thickness changes between stratigraphic surfaces within the formation are strongly influenced by structural deformation, with sediment thinning away from faults and over the crest of rollover anticlines. These thickness variations also strongly reflect the varying depth and magnitude of incision along the bounding sequence boundaries and the HST progradational clinoforms geometry. An upward decrease in thickness in the hanging wall of the fault blocks is observed between the isopach of successive sequence boundaries and maximum flooding surfaces within the studied area. This may be due to upward decrease in movement along some faults tips which in turn reduced the accommodation space. Progressive increase in local incision at the successive sequences and decrease in the thickness of successive sequences reflects rapid accommodation infilling, increased rates of sediment bypass, and decreased local rates of sediment loading. As a result of this accommodation infilling, the locus of sediment deposition and location of rapid sediment loading would also have shifted seaward. This is revealed by strong erosion and rapid progradation of sediments over the inactive faults updip, and this has led to rapid sedimentation and initiation of growth faults basinward (Appendices A, C and D). This reflects larger-scale deltaic progradation into the basin. Observation from seismic cross sections shows that areas of deepest incision follow onshore-offshore elongate trends and they do occur at the shelf break. Interpretations of these sequences cut by incised valley fills suggest relative sea level fall below the shelf edge which have resulted in shelf instability and structural collapse.
The depth of incision within the uppermost sequence (Depositional Sequence 6; up to 350 m) (Figures 27- 30) is difficult to explain in terms of sea level fall alone because eustatically-driven sea level variations during the Miocene are generally reported to be less than 100 m (330 ft) [11]. This suggests that local controls on incision, sequence development and the depositional facies preserved depend on relative sea level fall controlled by a complex interaction of eustacy, regional shelf/slope subsidence and structural collapse, shelf instability and rates of sedimentation. Sea level falls may facilitate delivery of large volumes of sediment that can destabilise the shelf and slope and eventually lead to slumping [12]. As a result of instability within the shelf, the deposits within the incised valleys in turn become unstable causing the infills to be eroded and transported to deeper water. This headward erosion caused the valleys to be deeply incised as a result of shelf instability. The edge-ward erosion assumed to have ceased incising when the shelf became stable and the gradient within the shelf area become gentle (landward of shelf). These developments of deep incision at the shelf edge have some implication for deltaic depositional sequences variability.
It is not possible to extract an analysis of longer-term fault behaviour and evolution using the isopachs generated in this study, due to the length of the observation period (about 16.7 – 10.35 myr) and length of the faults, because most of the faults extend beyond the study area and the full length of the faults is not imaged. Observation from the sequence analysis shows that throughout sequence development within the study area, the shelf margin has been controlled also by growth faults which have migrated basinward through time (Appendices A, C and D). In a case where the shelf margin is being controlled by growth faults, one of the processes of transporting sand into the basin is shelf collapse, with resultant slumping. However, there is an observed reduction in the upward propagation of faults. This may be due to changes in sediment deposition rates and fluvial discharge locations causing minor faults to become buried and truncated; fault segmentation and differential displacement on adjacent segments. Sedimentation patterns suggest that faulting, local incision and HST clinoform geometry dominate the formation of depocentres across the shelf.
The overall strong progradational character of the study area as evidenced from the overall seismic geometry, prograding of shoreline break as observed from GDE maps, structural maps of the sequence boundaries and dip line section at the proximal part. They are interpreted to reflect a long time decrease in accommodation triggered by a combination of tectonic uplift of the north-western Niger delta and the middle Miocene eustatic fall [1,13]. Increase in the proportion of sandstone relative to mudstone up section within the study area clearly also shows long-term progradation and graduation from the paralic Agbada Formation into continental sand Benin Formation.
Conclusion
Detailed sequence stratigraphic analyses showed that the middle Miocene-early Pliocene strata in the Ewan and Oloye fields of the northwestern Niger delta consist of six depositional sequences (Appendices A-D) (Figures 4 and 5). In general, sequences are widespread. They are made up of progradational HST, TST are thin but widespread, and LST are restricted to within valley fills. Outside the LST valleys, transgressive surfaces and sequence boundaries are coincident on interfluves. This suggests that during LST times most of the area was periodically subaerially exposed. During lowstand period, shorelines and facies belts prograde basinward (south) and there are a development of canyons which serve as a conduit for high amplitude deposit (deep water sand) on the slope and within the basin floor. This mechanism is interpreted to have led to the deposition of considerable amount of sandstones basinward [14,15].
Individual sequences can be mapped across the study area and biostratigraphic data allow a correlation with regional biozonal ages for the Niger delta complex. However, there is strong local growth fault control on sequence variability. Further local controls on sequence geometry are shelf instability and slope collapse structures which have a strong geomorphological impact on the area. The slope scars act as a locus for lowstand incision and affect overall sequence thickness. The incisions are narrower and deeper in lower sequences whereas those at the higher sequences are broader and less deeply incised. The additional accommodation space above slope scars allows local development of thick HST with seismically resolvable clinoforms. The occurrence of the several incisions in the middle Miocene succession is interpreted as evidence of significant relative sea level fluctuations, and the presence of type-1 sequence boundaries may be the stratigraphic signature of major drops in relative sea level during Miocene and Pliocene.
Sequences developed within the middle Miocene in the study area are interpreted to be controlled locally by episodic shelf instability, basin physiography (shelf edge), fault growth and linkage. Relative sea level changes provide the major control on sequence development and deep valley incisions. The latter have a strong geomorphological impact on the area and a strong control on sequence variability. Idealized schematic sequence stratigraphic development models have been generated for the study area and are summarized in Figure 31.
References
- Doust H, Omatsola E (1990) Niger Delta in JD Edwards and PA Santogrossi (eds) Divergent/Passive Margin Basin AAPG 48: 201-238.
- Vail PR, MitchumJr RM, Thompson S (1977) Seismic stratigraphy and global changes of sea level, part 4: global cycles of relative changes of sea level. In: Payton CE (Ed), Seismic Stratigraphy – Applications to Hydrocarbon Exploration. AAPG Memoir 26: 83-97.
- Posamentier HW, Jervey MT, Vail PR (1988) Eustatic Controls on Clastic Deposition I: Conceptual Framework: In Wilgus CK, Hastings, CG, St C Kendall, HW Posamentier, CA Ross and Van Wagoner, JC eds. Sea-Level Changes: An Integrated Approach: Society of Economic Paleontologists and Mineralogists Special Publication No 42 pp: 109-124.
- Posamentier HW, Vail PR (1988) Eustatic Controls on Clastic Deposition II: Sequence and Systems Tract Models: In Wilgus CK, Hastings, CG, StC. Kendall, HWPosamentier, CA Ross and Van Wagoner, JC eds Sea-Level Changes: An Integrated Approach: Society of Economic Paleontologists and Mineralogists Special Publication No 42: 124-154.
- Van-Wagoner JC, Posamentier HW, Mitchum RM, Vail PR, Sarg JF, et al. (1988) An Overview of the Fundamentals of Sequence Stratigraphy and Key Definition: In Wilgus, C.K, Hastings, CG, St C Kendall, HW Posamentier, CA Ross and Van Wagoner, JC eds. Sea-Level Changes: An Integrated Approach: Society of Economic Paleontologists and Mineralogists Special Publication No 42: 39-45.
- Van-Wagoner JC, Mitchum RM, Campion KM, Rahmanian VD (1990) Siliciclastic Sequence Stratigraphy in Well Logs, Cores, and Outcrops: Concepts for High-Resolution Correlation of Time and Facies. AAPG Methods in Exploration series No 7.
- Posamentier HW, Allen GP (1999) Siliciclastic Sequence Stratigraphy-Concepts and Application. SEPM Concepts in Sedimentology and Paleontology no pp: 7 210.
- Williams H, Berge C, Hartung M, De Ruiter R, Ugueto GA (1997) Prediction of Nigerian reservoir sands through integration of seismic imaging and sequence stratigraphy. In: Shanley, K.W and Perkins, BE (Eds) Shallow Marine and Non-marine Reservoirs. GCSSEPM pp: 401-408.
- Evamy BD, Haremboure J, Kimberling P, Knap WA, Molloy FA, et al. (1978) Hydrocarbon habitat of Tertiary Niger delta. AAPG Bull 62: 1-39.
- Durogbitan AA (2010) Seismic, Sequence Stratigraphic and Structural Analysis of Ewan and Oloye Fields (Middle Miocene), Northwestern Niger Delta. PhD Thesis unpubl. Earth Science Department, The University of Manchester pp: 337.
- Haq BU, Hardenbol J, Vail PR (1987) Chronology of fluctuating sea levels since the Triassic. Science 235: 1156-1167.
- Colleman JM, Prior DB, Lindsay JF (1983) Deltaic influences n shelf-edge instability processes. In Stanley, DJ Moore GT (Eds). The Shelf Break: Critical interface on Continental Margins. Spec PublSoc Econ Paleontol. Mineral 33: 121-137.
- Weber K.J, Daukoru EM (1975) Petroleum Geology of the Niger Delta Proc. Ninth World Petrol. Congress 2: pp. 209-221.
- GawthorpeRL, Hall M, Sharp I, Dreyer T (2000) Tectonically enhanced forced regressions: example from growth fold in extensional and compressional settings, the Miocene of the Suez rift and the Eocene of the Pyrenees. In Hunt D, Gawthorpe, RL (Eds.). Sedimentary Response to Forced Regression, vol 172 GeolSoc London Special Publpp: 177-191.
- OomkensE (1974) Lithofacies relations in the Late Quaternary Niger Delta complex. Sedimentology 21: 195-22 2.
Relevant Topics
- Algal Blooms
- Blue Carbon Sequestration
- Brackish Water
- Catfish
- Coral Bleaching
- Coral Reefs
- Deep Sea Fish
- Deep Sea Mining
- Ichthyoplankton
- Mangrove Ecosystem
- Marine Engineering
- Marine Fisheries
- Marine Mammal Research
- Marine Microbiome Analysis
- Marine Pollution
- Marine Reptiles
- Marine Science
- Ocean Currents
- Photoendosymbiosis
- Reef Biology
- Sea Food
- Sea Grass
- Sea Transportation
- Seaweed
Recommended Journals
Article Tools
Article Usage
- Total views: 14388
- [From(publication date):
June-2016 - Jul 05, 2025] - Breakdown by view type
- HTML page views : 13196
- PDF downloads : 1192

