Research Article Open Access
Role of Nano Zirconia Addition on Photodegradation of LLDPE/LDPE/PLA Blend Films
Priti Dubey1*, Smita Mathur1, Navin Chand2 and Pradeep Upadhyaya1
1Central Institute of Plastic Engineering and Technology, Lucknow, Uttar Pradesh, India
2CSIR - Advanced Materials and Processes Research Institute (AMPRI), Bhopal, Madhya Pradesh, India
- *Corresponding Author:
- Priti Dubey
Central Institute of Plastic Engineering and Technology
Lucknow, Uttar Pradesh, India
Tel: +91-8765923053
E-mail: priticipet14@gmail.com
Received date: August 23, 2016; Accepted date: September 08, 2016; Published date: September 09, 2016
Citation: Dubey P, Mathur S, Chand N, Upadhyaya P (2016) Role of Nano Zirconia Addition on Photodegradation of LLDPE/LDPE/PLA Blend Films. Ind Chem 2:121.doi: 10.4172/2469-9764.1000121
Copyright: © 2016 Dubey P, et al. This is an open-access article distributed under the terms of the Creative Commons Attribution License, which permits unrestricted use, distribution, and reproduction in any medium, provided the original author and source are credited.
Visit for more related articles at Industrial Chemistry
Abstract
In this present study observed the effect of Nano filler (titanate coupling agent treated Nano-zirconia) on degradation behavior of PLA filled LLDPE/LDPE/MA-g-PE modified blend. Blown Films were exposed to UV light by using an accelerated weather meter (QUV). Results show that with the loading of Nano-zirconia in the LLDPE/LDPE/ PLA/MA-g-PE blend, tensile strength reduced to 47-54% before total rupture. Nano composite films lose weight by 4 to 6% in 144 hrs. However, without the addition of Nano filler, blends lose their weight only 0.76%. Thermal behavior of degraded Nano composite blown films was studied by using Differential Scanning Calorimetry (DSC) and Thermo Gravimeter Analyzer (TGA). The morphological changes were observed by the Scanning Electron Microscope (SEM). FTIR was used for change in functional group study.
Keywords
Nano-filler; Zirconia; FTIR; DSC; MA-g-PE
Introduction
It is difficult for polymers to be treated after use due to their resistance to the environment. When polymers are disposed of in a natural environment, they remain for a long time without degradation. It is frequently asserted by environmental pressure groups that the polyolefins can not biodegrade since the molecular weight must be less than 500 for this to occur. Due to low cost and good mechanical properties as compare to other commodity plastics polyethylene’s are world’s most extensively used commodity plastic of the 21st century [1-4]. Among the applications in all plastics, polyethylene consumption is 64% in packaging and bottles area [4]. In the packaging area, carry bags are regularly used product and are most visible [5]. For easy disposal of polymers naturally in an environment, photodegradable and biodegradable plastics in packaging materials are the best combination to decrease the accumulation of packaging waste in the environment [6]. Many authors reported that degradation rate of polyethylene is slow [7,8]. Biodegradable and photodegradable films may be the solution of visual pollution; these polymers broke into small pieces and reduce into low molecular weight. Natural photodegradation of polyolefin is a very slow process; however, many research papers have reported use of transition metals, which act as pro-oxidant. Addition of these pro-oxidants can promote the oxidation of polyolefin in the presence of oxygen and exposure to light/heat. Many pro-oxidant used with plastics include oxide or stearates of metals such as manganese iron, zinc, zirconium, cerium, titanium and cobalt [9-16].
In past few research articles the idea of increasing biodegradability achieved by adding natural biopolymer such as starch along with prooxidant in the presence of compatibilizer [17-19]. Further issues were raised regarding the toxicity of transition metals and accumulation of Nickel was inconsiderable [20]. Zirconium as a ceramic biomaterial and biocompatibility with polyethylene has been reported [21,22]. Earlier research papers report the enhanced mechanical, thermal and optical properties of films processed from the materials LLDPE /LDPE/ PLA/MA-g-PE and LLDPE/LDPE/PLA/MA-g-PE/nano zirconia blend [23,24]. The role of inorganic fillers on thermal, mechanical and degradation properties was also reported with many blends [17,18,25]. Several publications have been published on the effect of transition metals on photodegradation [9-11,14-16].
There is no literature based on the role of nano zirconia addition on photodegradation in LLDPE/LDPE/PLA blend films. In this present study effect of nanofiller zirconium oxide on photodegradation of MAg- PE compatibilized LLDPE/LDPE/PLA blown film in accelerated weatherometer has been studied. From the results, it was observed that with an increase of nanofiller amount support the degradation rate. Physical changes, weight loss, mechanical, thermal and morphological properties with degradation rate. By the FTIR analysis changes in functional groups during the photodegradation were also analyzed.
Materials and Methods
Materials
Blown films used in this study were developed earlier and provided for this study [24]. Blown film grade Butene-linear low density polyethylene (trade name: Sabic LLDPE 118W; Density=0.918 g/cm3, MFI=1.0 g/10 min at 190°C and 2.16 kg) was supplied by M/S Saudi Basic Industries Corporation, Saudi Arabia. General purpose film grade low density polyethylene (trade name: Relene 24FS040; Density=0.922 g/cm3, MFI=4.0 g/10 min at 190°C and 2.16 kg) produced by M/s Reliance polymers, India. Sheet extrusion grade Poly lactic acid (trade name: Revode 101, Density=1.250 g/cm3, MFI=2-10 g/10 min at 190°C and 2.16 kg) was obtained from M/s Zhejiang Hisun Biomaterials Co. Ltd., China. Maleic anhydride grafted polyethylene (MFI- 1.5 g/10 min, MAH content 0.5-0.8% and Density - 0.953 g/cm3) was supplied by M/s Plus polymers, India. Nano-Zirconia (surface area- 30 m/g, and bulk density - 0.42 g/cm) was supplied by M/s Zirox technologies, India. Titanate coupling agent (EB-1019A) was purchased by M/s IPMC, Pune, India [24].
Photodegradation analysis
Nanocomposite formulations are listed in Table 1. PLA filled and unfilled LLDPE/LDPE/MA-g-PE blend with and without nano zirconia blown films were cut into rectangular shaped samples of dimension 15 × 2.5 cm2. Blends were UV irradiated using an accelerated weathering tester (Model-Q-Lab QUV/Spray with solar eye irradiance control) following ASTM D-5208: standard practice for Operating Fluorescent Light Apparatus for UV exposer of nonmetallic materials, using irradiance of 0.66 W/m2 for 8 hrs. Irradiance cycle and 8 hrs. Condensation cycle. The samples were exposed upto 144 hrs.
| Formulation | Blendcode | LLDPE(wt%) | LDPE(wt%) | PLA(phr) | MA-g-PE (phr) |
NanoZrO2(phr) | Titanatecouplingagent(phr) |
|---|---|---|---|---|---|---|---|
| LLDPE/LDPE/PLA/MA-g-PE/nanoZrO2 | LnZ0 | 85 | 15 | 10 | 4 | 0 | 0 |
| LLDPE/LDPE/PLA/MA-g-PE/nanoZrO2 | LnZ1 | 85 | 15 | 10 | 4 | 0.5 | 1 |
| LLDPE/LDPE/PLA/MA-g-PE/nanoZrO2 | LnZ2 | 85 | 15 | 10 | 4 | 1.0 | 1 |
| LLDPE/LDPE/PLA/MA-g-PE/nanoZrO2 | LnZ3 | 85 | 15 | 10 | 4 | 1.5 | 1 |
Table 1: Nano composite films formulation.
Weight loss
Percent weight loss of nano zirconia filled and unfilled LLDPE/ LDPE/ PLA/MA-g-PE blend blown films were determined as:

Mechanical testing
Nano zirconia filled and unfilled LLDPE/LDPE/ PLA/MA-g- PE blend blown films were tested using universal testing machine (INSTRON) used to test the tensile strength of the developed specimens. The tensile test was carried out according to ASTMD-882. The rectangular shaped samples had the dimensions 2.5 cm in width and 15 cm in length were tested. Tensile strength was calculated in machine direction. The average of 5 tested samples was reported in the present research paper.
Thermal studies
LLDPE/LDPE/PLA/MA-g-PE blends modified with nanofillers blown films were tested on Differential Scanning Calorimetric (DSC), Perkin Elmer, which was used to find the thermal transitions in prepared blown film samples. DSC analysis was carried out from 50 to 200°C at heating rate of 10°C /min. The percentage of crystallinity was calculated from DSC result using the following relation. Hf for purely crystalline polyethylene is 276 J/g according to Da Costa and Ramos [26].

Fourier Transforms Infrared (FTIR) spectroscopy
PLA filled and unfilled LLDPE/LDPE/ MA-g-PE blend blown films were analyzed for functional group analysis and change in intensities of functional groups by using Fourier Transforms Infrared (FTIR) spectroscopy (Perkin Elmer).
Morphological studies
Surface morphology and compatibility of blends prepared from LLDPE/LDPE/PLA/MAgPE and its nanocomposites blown films were observed by using SEM Model ELU 430.
Results and Discussion
Mechanical properties
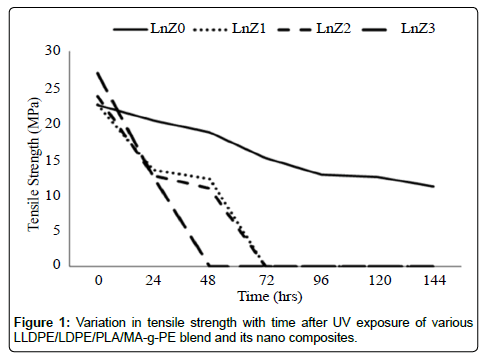
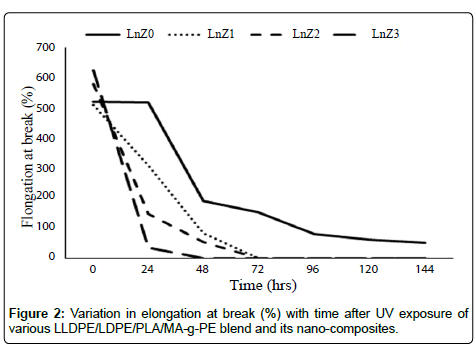
The Figures 1 and 2 illustrate the tensile strength and percentage elongation at break of the films. It is noted that the LLDPE/LDPE/ PLA/MA-g-PE and the LLDPE/LDPE/PLA/MA-g-PE/zirconia followed similar trends in the change in tensile properties over time. However, the degradation of tensile properties was 47% to 54% for the nanocomposites after 48 hrs before ruptured and for LLDPE/LDPE/ PLA/MA-g-PE blend was 50.2% after 144 hrs. And Tables 2 and 3 indicates that the presence of the nanofiller accelerates the degradation of the blend material, a fact that has also been observed in previous works [27,28]. The result also indicate that higher degradation rate was found in 1.5 phr containing nano zirconia (LnZ3) composite due to good dispersion in matrix. This effect can be explained in terms of the crystallinity increase observed by DSC, with the formation of new crystals.
| BlendCode | ChangeinTensilestrength(MPa)ondifferentTime(hrs) | ||||||
|---|---|---|---|---|---|---|---|
| 0 | 24 | 48 | 72 | 96 | 120 | 144 | |
| LnZ0 | 22.5 | 20.3 | 18.7 | 15.1 | 12.8 | 12.5 | 11.2 |
| LnZ1 | 22.56 | 13.48 | 12.23 | F | F | F | F |
| LnZ2 | 23.68 | 12.67 | 10.9 | F | F | F | F |
| LnZ3 | 26.85 | 12.53 | F | F | F | F | F |
Table 2: Change in tensile strength (MPa) of LLDPE/LDPE/PLA/MA-g-PE blend with nanozirconia before and after UV exposure at various time intervals.
| BlendCode | ChangeinElongationbreak(%)ondifferentTime(hrs) | ||||||
|---|---|---|---|---|---|---|---|
| 0 | 24 | 48 | 72 | 96 | 120 | 144 | |
| LnZ0 | 520 | 517 | 190.4 | 150.98 | 78.85 | 61.0 | 50.8 |
| LnZ1 | 510 | 308 | 82.7 | F | F | F | F |
| LnZ2 | 580 | 145.7 | 52.5 | F | F | F | F |
| LnZ3 | 625 | 35 | F | F | F | F | F |
Table 3: Change in elongation at break (%) of LLDPE/LDPE/PLA/MA-g-PE blend with nanozirconia before and after UV exposure at various time intervals.
Differential Scanning Calorimetry (DSC) screening
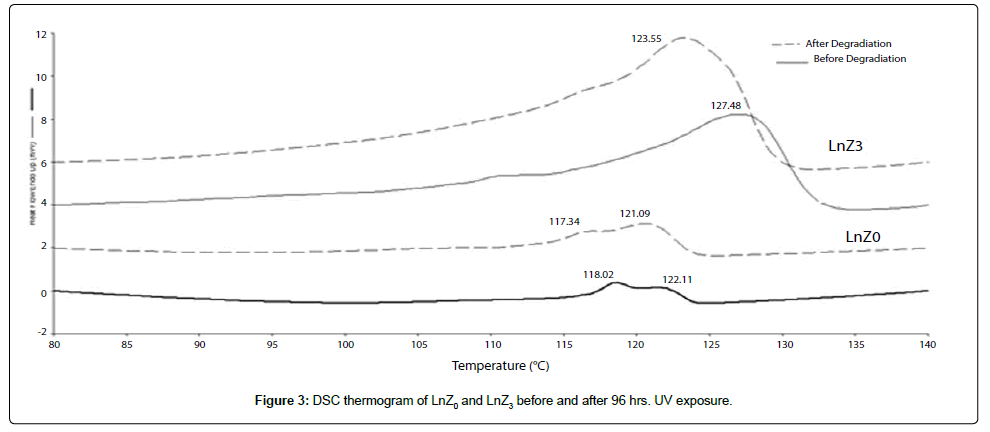
The Differential Scanning Calorimetry (DSC) results for the UV Exposed and unexposed LLDPE/LDPE/PLA/MA-g-PE blend and their nanocomposites are described in Table 4 and Figure 3 for all the samples, crystallinity (a property that gives improving the stiffness and thermal stability of the material) increased after 96 hrs. Of UV exposure. The DSC analysis was carried out in order to study the various temperature transitions of the prepared nanocomposites. Endothermic curves of DSC scan gives information about melting temperature and degree of crystallinity. The DSC scans of samples containing zirconia oxide, for treated and untreated samples, are plotted in Figure 3 and the related data are summarized in Table 4 and Figure 3 showed that the melting temperatures of both pure samples and LnZ3 samples underwent reduction after 96 hours of UV exposure. However, samples containing prooxidant melting temperature (Tm) show higher reduction than without nanofiller samples after treatment. The reduction of Tm could be due to the breakdown of LLDPE/LDPE blend chains and molecular weight reduction. As reported by Colom et al. [29] the decrease of the decomposition and melting temperatures is associated with breaking of polymeric chains leads to lower thermal stability of the prepared films. The crystallinity of without nanofiller samples increased around 1%, from 10.8 to 11.4, whereas with nanofiller LnZ3 samples underwent higher increase, about 8%, from 21.74 to 29.7 after 96 hours of UV exposure (Table 4). The increase of crystallinity is probably due to increased nucleation in the amorphous regions. The chain scission allowed the small segments resulted to crystallize. The increase of crystallinity could contribute in degradation products which possessed the lower Tm than before UV exposed samples. Furthermore, the increase of crystallinity, particularly LnZ3 samples, gives supporting evidence on the role of zirconia nanofiller in accelerating degradation process on UV exposure.
| SampleCode | BeforeUVexposure | Crystallinity | |
| Tm°C | ΔHfJ/g | ||
| LnZ0 | 122.11 | 29.35 | 10.8 |
| LnZ3 | 127.48 | 60.01 | 21.74 |
| SampleCode | AfterUVexposure | Crystallinity | |
| Tm°C | ΔHfJ/g | ||
| LnZ0 | 121.09 | 31.49 | 11.41 |
| LnZ3 | 123.56 | 81.9 | 29.7 |
Tm: Melting point (peak), °C; ΔHf, heat of fusion, J/g; Crystallinity: crystallinity index (%).
Table 4: Melting temperature and crystallinity of samples before and after 96 hours of UV exposure.
FTIR
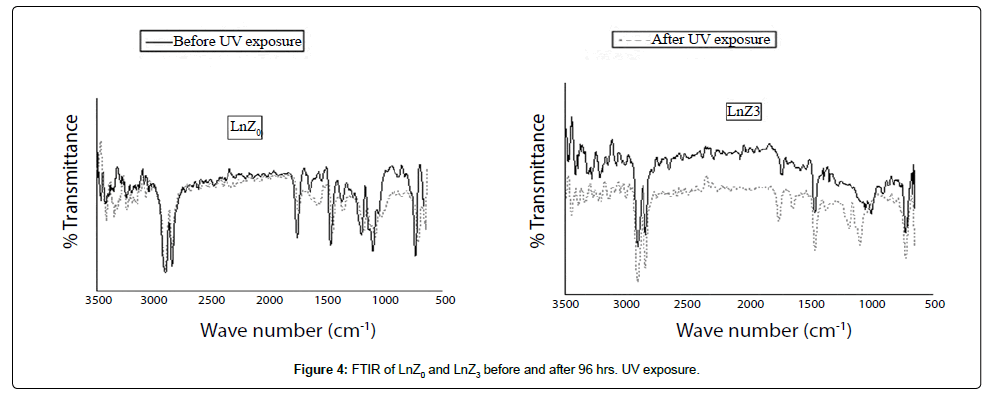
The Figure 4 illustrates Comparison spectra of LLDPE/LDPE / PLA/MA-g-PE and LLDPE/LDPE /PLA/MA-g-PE/zirconia before and after UV exposure and characteristic peak (wave number) are given in Table 5. Chain broadening was observed in LnZ3 at 1190-1090 cm-1 (O-C=O stretching) and in LnZ0 chain broadening was not observed. Chain broadening was due to the presence of more than one oxidation product which can be clearly observed in Figure 4 after 96 hrs UV exposure. Change in intensities of zirconia containing nanocomposite shows noticeable change at 2901 cm-1 and 2915 cm-1 (C-H stretching), 1756-1744 cm-1 (Ester carbonyl group), 1460 cm-1 (CH2 bending), and 722 cm-1 (Skelton vibration of CH2) whereas without nanofiller blend in LnZ0 showed slight changes in intensities which reveals autoxidation of LLDPE/LDPE/PLA/MA-g-PE blend in presence of metal oxide.
| PeakPosition(cm-1) | Characteristicgroup |
|---|---|
| 2914-2905,28cm-1 | CHsymmetricandasymmetricstretching |
| 1461cm-1 | CH2bending |
| 720cm-1 | vibrationofCH2 |
| 1756-1744cm-1 | Estercarbonylgroup |
| 1190-1090cm-1 | O-C=Ostretching |
| 1024 | C-Ostretching |
| 1639-1600cm-1 | C=Cbond |
Table 5: Segregation of individuals with use of TCD4+ lymphocytes at 350 TCD4+/μl level: FACSCan versus Dynabeads using study dyes.
SEM
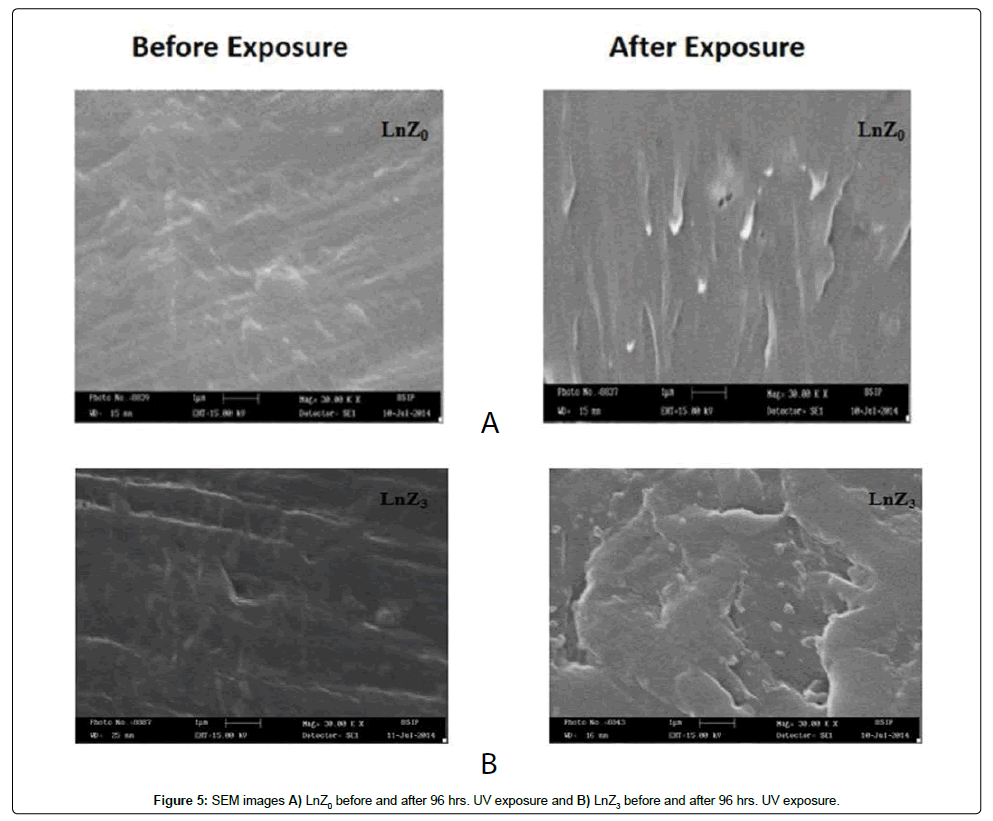
The Figures 5A and 5B shows the image for the LLDPE/LDPE/ PLA/MA-g-PE (Figure 5a) and its nano-composite containing 1.5 phr zirconia (LnZ3) after 96 hrs UV exposure. The morphological changes observed in LLDPE/LDPE/PLA/MA-g-PE (LnZ0) and its nanocomposite after exposure to the UV light, and observed that number of voids together with extended cracks running in-between and around the dispersed particles in nanofiller filled blend (Figure 5b). The formation of a large number of voids and cracks in the nanocomposite suggests that LLDPE/ LDPE/PLA/MA-g-PE degradation begins at the interface between the polymer matrix and the nanofiller particles. As a result, we can assume that a well-dispersed filler, which results in an increased interface region between matrix and filler and enhances degradation.
Physical changes
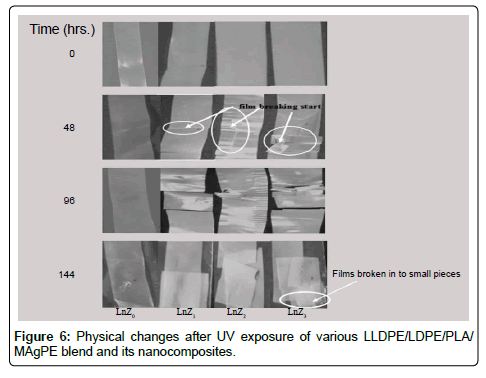
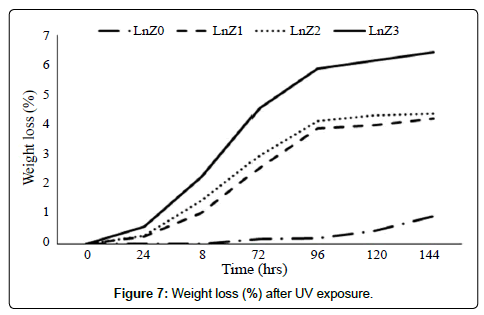
Physical and weight changes shown in Figures 6 and 7 and observed that samples were become brittle in nature and weight loss seen after the exposure of UV. With and without filler weight loss was 4% to 6.4%, 0.92% respectively after 144 hrs UV Exposure.
Conclusion
The influence of UV-irradiation on with and without nano zirconia filled LLDPE/LDPE/PLA/MA g PE blend blown films shows tremendous optimistic results. Which was supported by various techniques such as FTIR, SEM and DSC.
The following conclusions can be drawn from above experiments:
1. After UV exposure, the highest reduction in tensile and elongation at break properties was observed in the blend containing 1.5 phr nano zirconia in LLDPE/LDPE/PLA/MA g PE blend by 54% and 90.7% after 48 hrs before ruptured and in LLDPE/LDPE/PLA/MA-g-PE blend by 50.2% and 90.2% after 144 hrs UV exposure.
2. Degradation of LLDPE/LDPE/PLA/MA g PE blend with nano zirconia had occurred leading to crystallization.
3. The FTIR spectra show changes in intensities, especially in the carbonyl (1756-1749 cm-1), 1190 -1090 cm-1 (O-C=O stretching) and bands at 721 cm-1 and 1461 cm-1 corresponding to vibrations of -CH2 groups and bending vibrations of -CH2 bonds respectively on UV exposure. The change in intensity of these peaks is a result of the fracture of the polyethylene chain after UV exposure.
4. Surface cracks and voids were enhanced by addition of nano filler nano zirconia. It was clearly seen by SEM analysis at 1.5 phr containing nano zirconia LLDPE/LDPE/MA g PE blend (LnZ3) shows more cracks and voids than LLDPE/LDPE/MA g PE blend (LnZ0) after 96 hrs. UV exposure.
5. Weight loss 6.4% in LLDPE/LDPE/PLA/MAgPE/nano zirconia nanocomposite (LnZ3) and 0.92% in LLDPE/LDPE/PLA/MAg- PE blend (LnZ0) and physical changes were observed after UV exposure.
Acknowledgements
The authors would like to acknowledge for FTIR analysis to Mr. Deepak Sharma from CDRI (Central Drug Research Institute), Lucknow, Uttar Pradesh, India.
References
- Hakkarainen M, Khabbaz F, Albertsson AC (2005) Biodegradation of polyethylene followed by assimilation of degradation products. Biopolymers Online.
- Eggins HO, Mills J, Hol TA, Scott G (1971) Biodeterioration and biodegradation of synthetic polymers. Soc Appl Bacteriol Symp Ser,pp:267-279.
- Galli P, Vecellio G (2004) Polyolefins: the most promising large-volume materials for the 21st century. Journal of Polymer Science Part A: Polymer Chemistry42: 396-415.
- Sudhakar M, Doble M, Murthy PS,Venkatesan R (2008) Marine microbe-mediated biodegradation of low-and high-density polyethylenes.International Biodeterioration & Biodegradation 61: 203-213.
- Scott G (1999) Polymers and the Environment. Royal Society of Chemistry.
- Botelho G, QueirosA, MachadoA, FrangiosaP,Ferreira J (2004) Enhancement of the thermooxidative degradability of polystyrene by chemical modification. Polymer degradation and stability 86: 493-497.
- Albertsson AC (1977) Studies on Mineralization of 14C Labelled Polyethylenes in Aerobic Biodegradation and Aqueous Aging. Royal Institute of Technology.
- Albertsson AC (1978) Biodegradation of synthetic polymers. II. A limited microbial conversion of 14C in polyethylene to 14CO2 by some soil fungi.Journal of Applied Polymer Science 22:3419-3433.
- Amin M (1974) Photo-initiated oxidation of polyethylene effect of photo-sensitizers. European Polymer Journal10:1019-1028.
- Osawa Z, Kurisu N, Nagashima K, Nakano K (1979) The effect of transition metal stearates on the photodegradation of polyethylene. Journal of Applied polymer science 23: 3583-3590.
- Roy PK, Hakkarainen M, Varma IK, Albertsson AC (2011) Degradable polyethylene: fantasy or reality. Environmental science & technology45: 4217-4227.
- Chiellini E, Corti A, D'antone S, Baciu R (2006) Oxo-biodegradable carbon backbone polymers–oxidative degradation of polyethylene under accelerated test conditions. Polymer Degradation and Stability 91:2739-2747.
- Roy PK, Surekha P, Rajagopal C, Chatterjee SN, Choudhary V (2007) Studies on the photo-oxidative degradation of LDPE films in the presence of oxidised polyethylene. Polymer degradation and stability92: 1151-1160.
- Scott G, Islam S (1999) Polymer-bound UV activators for polyolefins.Polymer degradation and stability 63:61-64.
- Jakubowicz I (2003) Evaluation of degradability of biodegradable polyethylene (PE) Polymer Degradation and Stability80: 39-43.
- Jakubowicz I, Yarahmadi N, Petersen H (2006) Evaluation of the rate of abiotic degradation of biodegradable polyethylene in various environments.Polymer degradation and stability91:1556-1562.
- Griffin GJL (1974) Advances in chemistry series, 134. Fillers and Reinforcements for Plastics, p: 159.
- Griffin GJL (1980) Synthetic polymers and the living environment. Pure and Applied Chemistry52:399-407.
- Griffin GJL (1994) Starch polymer blends. Polymer degradation and stability45:241-247.
- Wolfe DW, Bache CA, Lisk DJ (1990) Analysis of dithiocarbamate and nickel residues in lettuce and peppers grown in soil containing photodegradable plastic mulch. Journal of Food Safety10: 281-286.
- Helmer JD, Driskell TD (1969) Research on bioceramics. In Symp. On use of ceramics as surgical implants. South Carolina (USA): Clemson University.
- Garvie RC, Nicholson PS (1972)Structure and Thermomechanical Properties of Partially Stabilized Zirconia in the CaO-ZrO2 System. Journal of the American Ceramic Society55:152-157.
- Singh O, Upadhyaya P, Chand N, Mishra TK (2012) Mechanical and optical properties of Poly Lactic Acid modified Linear-Low Density Polyethylene/Low Density Polyethylene (LLDPE/LDPE) blend blown film.International Journal of Mechanical and Industrial Engineering2:11-14.
- Kumar R, Upadhyaya P, Chand N. Effect of Chemically Modified Nano Zirconia Addition on Properties of LLDPE/LDPE/PLA/MA-g-PE Bio-nanocomposite Blown Films for Packaging Applications.
- Jongsomjit B, Panpranot J, Okada M, Shiono T,Praserthdam P (2006) Characteristics of LLDPE/ZrO~ 2 Nanocomposite Synthesized by In-situ Polymerization using a Zirconocene/MAO Catalyst. Iranian Polymer Journal15: 433-439.
- Da Costa HM, Ramos VD (2008) Analysis of thermal properties and rheological behavior of LLDPE/EPDM and LLDPE/EPDM/SRT mixtures.Polymer Testing 27: 27-34.
- Kontou E, Georgiopoulos P, Niaounakis M (2012) The role of nanofillers on the degradation behavior of polylactic acid. Polymer Composites33: 282-294.
- Morlat-Therias S, Fanton E, Gardette JL, Peeterbroeck S, Alexandre M, et al. (2007) Polymer/carbon nanotube nanocomposites: influence of carbon nanotubes on EVA photodegradation. Polymer Degradation and Stability92:1873-1882.
- Colom X, Canavate J, Sunol JJ, Saurina J, Carrasco F (2003) Natural and artificial aging of polypropylene–polyethylene copolymers.Journal of applied polymer science 87:1685-1692.
Relevant Topics
Recommended Journals
Article Tools
Article Usage
- Total views: 13831
- [From(publication date):
October-2016 - Apr 01, 2025] - Breakdown by view type
- HTML page views : 12977
- PDF downloads : 854

