Role of Magnetic Resonance Imaging Sequences in Timing of Brain Ischemic Strokes10.4172/2167-7964.1000
Received: 30-Jul-2023 / Manuscript No. roa-23-108515 / Editor assigned: 02-Aug-2023 / PreQC No. roa-23-108515 (PQ) / Reviewed: 16-Aug-2023 / QC No. roa-23-108515 / Revised: 21-Aug-2023 / Manuscript No. roa-23-108515 (R) / Published Date: 28-Aug-2023 DOI: 10.4172/2167-7964.1000483
Abstract
Stroke also known as a brain attack. It is a major cause of long-term disability that occurs, when blood supply to a part of the brain is blocked or a blood vessel in the brain bursts, resulting in damage or death to parts of the brain. Since stroke can lead to lasting brain damage, long-term disability, or death, the study focused on the time of the stroke. To investigate this, the research involved carrying out MRI examinations on 87 patients (48 males and 39 females) who were referred by specialist neurologists in Baghdad, Iraq. The exams were conducted using a Philips Achieva 1.5 tesla MRI machine, at the Academic Medical Center AMC and included four basic sequences (T1, T2, DWI, and FLAIR), with DWI being the most important. The correlation between symptom onset and time of stroke was analyzed using Spearman coefficient, revealing a significant relation with a high degree of 0.927 at a significance level of 1%. Chisquare tests were used to assess the relationships between symptom onset and time of stroke, age groups of patients with hypertension, and the time of stroke with the T1, T2, FLAIR, and DWI sequences.
Keywords
Strokes; Magnetic resonance imaging; Diffusion weighted imaging sequence
The Theoretical Side
Introduction to medical imaging
The rapid progress of medical science and the invention of various medicines have benefited man kind and the whole civilization [1].
Medical imaging produces the images of the internal structures of the body without invasive procedures [2].
Modern science also has been doing wonders in the surgical field. But, the proper and correct diagnosis of diseases is the primary necessity before the treatment.
Medical images play an important role in clinical diagnosis, therapy, teaching and researching.
Medical imaging is often thought of as a way to represent anatomical structures of the body with the help of X-ray computed tomography (CT-scan) and magnetic resonance imaging (MRI).
With the growth of computer and image technology medical imaging has greatly influenced medical field. As the quality of medical imaging affects diagnosis [1].
Brief overview of medical imaging is as follows
Diagnostic medical imaging started just over 100 years ago with the accidental discovery of X-rays by Roentgen in 1896, Conventional radiography has been the most widespread medical imaging technique ever since, from 1896 radionuclides were for therapy and for metabolic tracer studies rather than imaging. Then γ- ray imaging rectilinear scanner was invented.
During World War 2 Sonar Technology and in 1970’s ultrasound became widely available in medicine.
In 20th century the mathematical principles behind tomographic reconstruction have been understood and positron emission tomography (PET) and X-ray computed tomography (CT) have been developed. Nuclear magnetic resonance has been using for imaging in magnetic resonance imaging (MRI). In 21st century X-rays, MRI, ultrasound kept dominating but more interesting techniques especially imaging is getting included with microscopic as well as macroscopic biological structures (thermal imaging, electrical impedance tomography, scanned probe techniques etc) [3].
Therefore medical imaging is an essential part of the improved outcomes of modern medicine.
Medical imaging types
Different types of medical imaging procedures include:
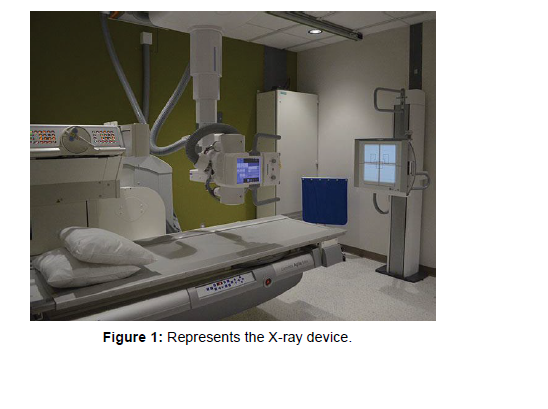
X-ray: It is imaging is the oldest but one of the most frequently used imaging types [4]. X-rays are quick painless tests that uses ionizing radiation to produce images of the structures inside the body especially bones [5] (Figure 1) shows the X-ray device.
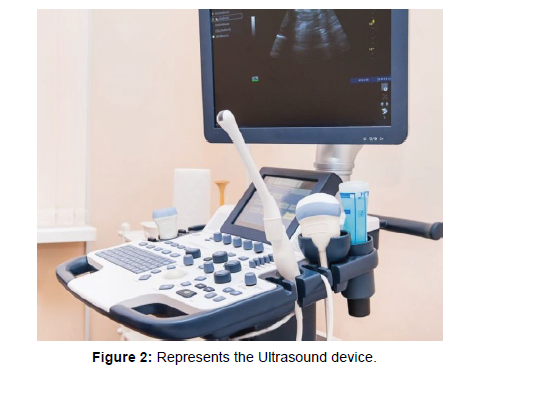
Ultrasound: It is typically a non-invasive and safe form of medical imaging that has a wide range of applications [6]. Ultrasound uses highfrequency sound waves to produce images of organs and structures within the body [5]. (Figure 2) shows the Ultrasound device.
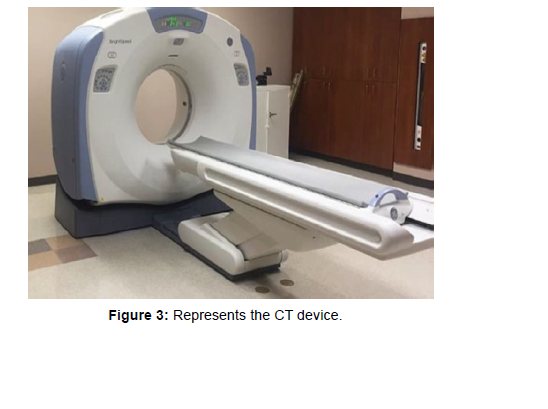
Computerized tomography (CT scan): CT scans use a series of x-rays to create cross-sections of the inside of the body providing greater clarity than conventional X-rays, producing more detailed images of the internal organs, bones, soft tissue and blood vessels within the body [5-7 ] (Figure 3) shows the CT scan device.
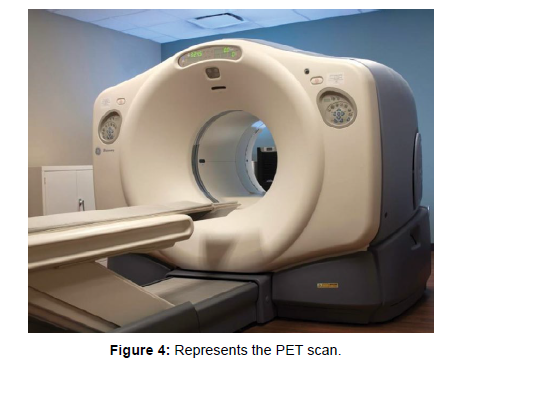
Positron Emission Tomography (PET): A Positron Emission Tomography (PET) scans uses radioactive drugs (called tracers) and a scanning machine to show how the tissues and organs are functioning [5] (Figure 4 and 5) shows the PET scan.
Magnetic Resonance Imaging and Strokes
Introduction
The contents of this chapter fall into two parts: the first part overviews magnetic resonance imaging (MRI). The second part overviews strokes generally and includes classifications of its types with live taken medical images by magnetic resonance imaging.
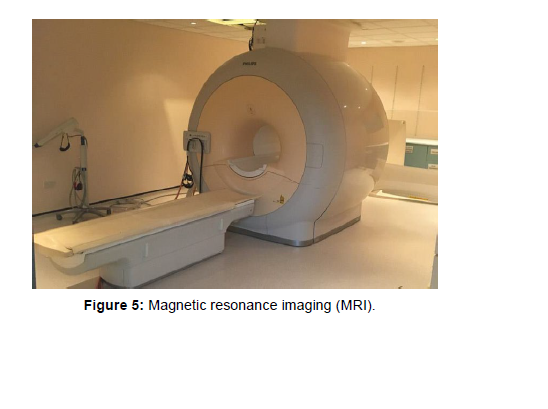
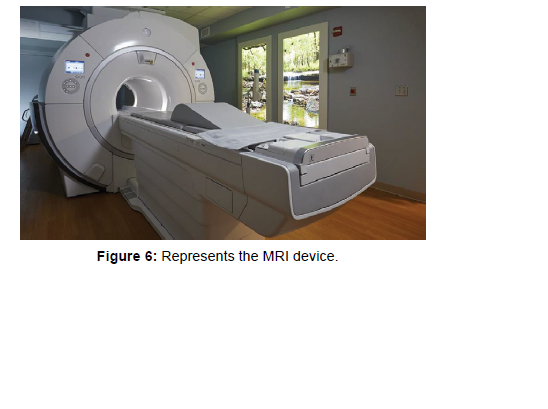
Magnetic resonance imaging (MRI): Magnetic resonance imaging (MRI) as shown in (Figure 6) is a wholly tomographic technique, just like X-ray and computed tomography (CT-scan), but it has no associated ionizing radiation hazard, and it provides a wider range of contrast mechanisms than X-rays and very much better spatial resolution in many applications [8].
Magnetic resonance imaging (MRI) pushes the image resolution to a few hundred microns and even higher, which can observe the structure of human tissue in mesoscopic, providing more detailed physiological information to support structural pathological diagnosis and brain function analysis [9-10] .
During an MRI exam, an electric current is passed through coiled wires to create a temporary magnetic field in a patient’s body. Radio waves are sent from and received by a transmitter/receiver in the machine, and these signals are used to make digital images of the scanned area of the body. A typical MRI scan last from 20 - 90 minutes, depending on the part of the body being imaged [11].
Magnetic resonance imaging applications: Magnetic resonance imaging (MRI) has ability to demonstrate and characterize soft tissues hence useful in heart, muscles, brain, spinal cord, some head and neck tumors [12 ,13] It can be used to examine almost any part of the body, including the [14].
• Brain and spinal cord
• Bones and joints
• Breasts
• Heart, blood vessels and internal organs such as the liver, womb or prostate gland
However, there are certain individuals who may not be able to undergo the magnetic resonance imaging (MRI) scan. Here are some of the contraindications or situations where the magnetic resonance imaging (MRI) scan may not be recommended [15-17].
• Individuals with pacemakers or other implanted electronic devices, as the magnetic field can interfere with these devices and cause harm.
• Individuals with certain types of metal implants, such as those made of iron, as these can be affected by the strong magnetic field.
• Pregnant women, during the first trimester, as there is a theoretical risk that the magnetic field and radio waves may harm the developing fetus.
• Individuals with severe kidney problems, as the contrast agents used in some magnetic resonance imaging (MRI) scans can be harmful to the kidneys.
• Individuals with severe claustrophobia or anxiety, as being in the confined space of the magnetic resonance imaging (MRI) machine for an extended period of time can be uncomfortable and distressing.
Principle of magnetic resonance imaging
Magnetic Resonance (MR) imaging technique is completely different from that of Computed Tomography as it uses energy sources as its imaging procedure rather than ionizing radiation technique of X-ray.
Magnetic resonance imaging uses the principle of nuclear magnetic resonance. The procedure requires the usage of a strong magnetic field for spin alignment of hydrogen nuclei (photons) in the body. The spin synchronizes as the radio-frequency (RF) pulse matches the nuclear resonance frequency of the photons [18].
A magnetic resonance system consists of the following components [19].
1. A large magnet to generate the magnetic field.
2. Shim coils to make the magnetic field as homogeneous as possible.
3. A radiofrequency (RF) coil to transmit a radio signal into the body part being imaged.
4. A receiver coil to detect the returning radio signals.
5. Gradient coils to provide spatial localization of the signals.
6. A computer to reconstruct the radio signals into the final image.
Magnetic resonance imaging physics
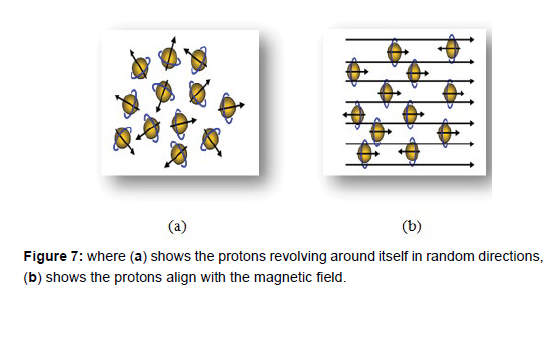
Powerful magnet which produces a strong magnetic field that forces protons in the body to align with that field, as shown in the (Figure 7),when a radiofrequency current is then pulsed through the patient, the protons are stimulated, and spin out of equilibrium, straining against the pull of the magnetic field. When the radiofrequency field is turned off, the MRI sensors are able to detect the energy released as the protons realign with the magnetic field. The time it takes for the protons to realign with the magnetic field, as well as the amount of energy released changes depending on the environment and the chemical nature of the molecules. Physicians are able to tell the difference between various types of tissues based on these magnetic properties [20].
Magnetic resonance imaging sequences
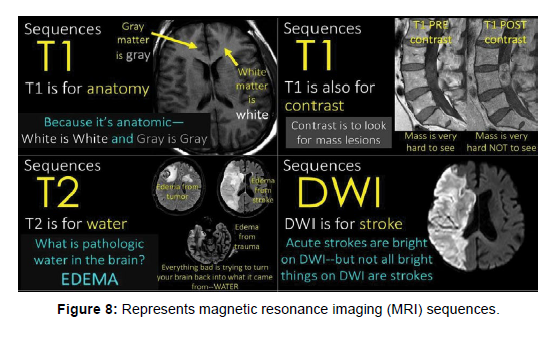
Magnetic Resonance Imaging (MRI) uses different sequences as shown in (Figure 8) to generate images of the body. These sequences manipulate the magnetic field and radio waves to create images with different contrasts and resolutions, the imaging power and versatility of MRI arises from the variety of contrast mechanisms that the resonance process provides, there are three primary parameters or flavours that contribute to contrast in a typical image. These are the ‘free water density’. Longitudinal relaxation time (T1), and transverse relaxation time (T2). The water proton resonance can also be made sensitive to fluid flow and tissue magnetic susceptibility [8]. Diffusion-weighted imaging (DWI) this sequence is used to detect changes in the movement of water molecules in tissues, which can help in the diagnosis of stroke and other conditions, fluid-attenuated inversion recovery (FLAIR) this sequence is used to suppress the signal from fluid, to improve the visibility of small lesions in the brain or spine [15-17].
Strokes
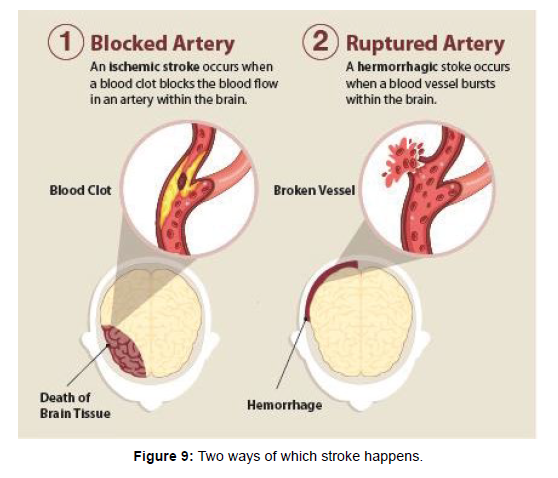
A stroke, sometimes called a brain attack, is a leading cause of serious long-term disability. It is occurs when something blocks blood supply to part of the brain or when a blood vessel in the brain bursts as shown in (Figure 9).
In either case, parts of the brain become damaged or die. A stroke can cause lasting brain damage, long-term disability, or even death [17].
Stroke is the third leading cause of death in the United States, Canada, Europe and Japan. The American Heart Association and the American Stroke Association estimate that approximately 800,000 new strokes occur each year, resulting in more than 130,000 annual deaths in the U.S. alone [22].
Strokes formation in the brain
The brain controls our movements, stores our memories, and is the source of our thoughts, emotions, and language. The brain also controls many functions of the body, like breathing and digestion. To work properly, the brain needs oxygen. The arteries deliver oxygenrich blood to all parts of the brain. If something happens to block the flow of blood, brain cells start to die within minutes, because they can’t get oxygen. This causes a stroke [21].
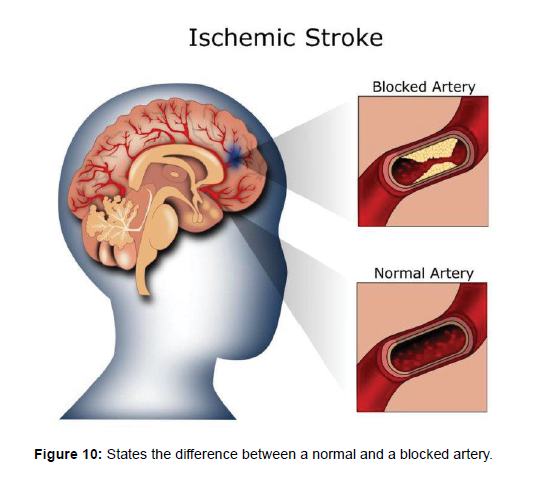
Stroke is caused by the reduction of the blood supply to the brain (usually a clot occluding a cerebral artery), which subsequently disrupts the supply of oxygen and nutrients to brain tissue. Ischemic strokes account for more than 80 % of strokes [22].
Types of Stroke
There are three types of stroke in the brain
Hemorrhagic stroke: This type of stroke occurs when a blood vessel in the brain ruptures or leaks, causing bleeding in or around the brain. Hemorrhagic strokes account for approximately 13% of all strokes [23].
Transient ischemic attack (TIA): Also known as a “mini-stroke,” a TIA is a temporary blockage of blood flow to the brain that resolves on its own within a few minutes to a few hours. While TIAs do not usually cause permanent brain damage, they are often a warning sign of a more serious stroke to come [24f].
Ischemic stroke: Most strokes are ischemic strokes, an ischemic stroke occurs when blood clots or other particles block the blood vessels to the brain [25], leading to a reduction or cessation of blood flow to a portion of the brain. This lack of blood flow can lead to brain damage and can result in various symptoms such as weakness or numbness on one side of the body, difficulty speaking or understanding speech, and sudden changes in vision or balance [26]. (Figure 10) shows the difference between a normal artery and a blocked artery.
Magnetic resonance imaging techniques for stroke detection and diagnosis
Magnetic resonance imaging (MRI) can help in determining when a stroke occurred as imaging features evolve in a reasonably predictable fashion. There is substantial heterogeneity in the terminology denoting time from onset, the following definitions are [27].
• Hyperacute: 0 to 24 hours
• Acute: 24 hours to 1 week
• Subacute: 1 to 3 weeks
• Chronic: more than 3 weeks those terms are used in clinical practice or in medical research to describe the duration of symptoms which will be explained later.
Classifying ischemic stroke types with magnetic resonance imaging (MRI)
Different magnetic resonance imaging sequences can be used to visualize the brain, such as T1-weighted, T2-weighted, and diffusionweighted imaging. Each sequence has its own strengths and limitations in terms of sensitivity and specificity for detecting ischemia at different stages. For example, diffusion-weighted imaging (DWI) is highly sensitive for detecting acute ischemia within minutes of onset, while T2-weighted imaging (T2WI) may be more sensitive for detecting subacute and chronic ischemia [28-29].
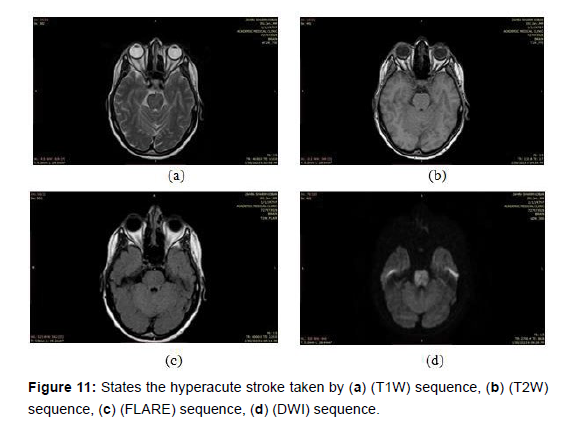
Hyperacute stroke: This refers to a very early stage of stroke that is in progress, with symptoms appearing within few hours typically the first 6 hours. In MRI, hyperacute strokes appear as areas of bright signal intensity on diffusion-weighted imaging (DWI) sequence [30-31]. As shown in the (Figure 11) below images took by a magnetic imaging resonance (MRI) scan that shows the hyperacute stroke by different sequences.
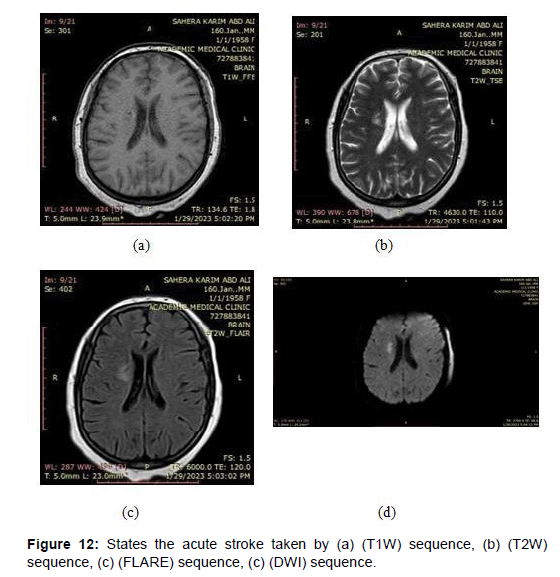
Acute stroke: This refers to a stroke that has occurred within the last few days. In MRI, acute strokes appear as areas of high signal intensity on T2-weighted imaging (T2WI) and fluid-attenuated inversion recovery (FLAIR) sequences [32], as shown in the (Figure 12) below images taken by a magnetic imaging resonance (MRI) scan that shows the acute stroke by different sequences.
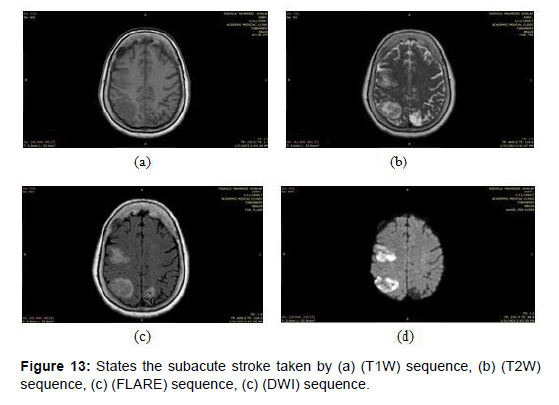
Subacute stroke: This refers to a stroke that has occurred between a few days to a few weeks prior. In magnetic resonance imaging (MRI), subacute strokes appear as areas of high signal intensity on T1-weighted imaging (T1WI) and low signal intensity on T2-weighted imaging (T2WI) and fluid-attenuated inversion recovery (FLAIR) sequences [33], as shown in the (Figure 13) below images taken by a magnetic imaging resonance (MRI) scan that shows the subacute stroke by different sequences.
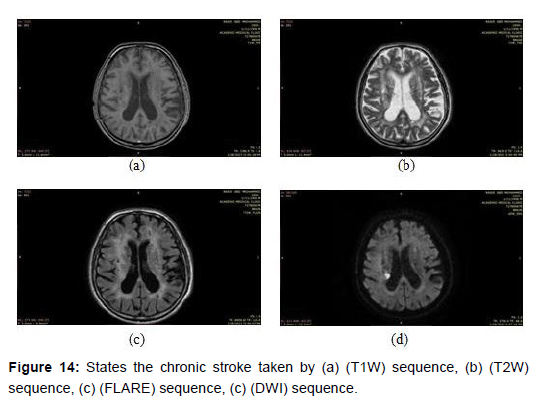
Chronic stroke: This refers to a stroke that has occurred more than a few weeks ago. In magnetic resonance imaging (MRI), chronic strokes appear as areas of low signal intensity on T1-weighted imaging (T1WI) and T2-weighted imaging T2WI sequences, with surrounding white matter hyper intensity on fluid-attenuated inversion recovery (FLAIR) sequences [34], as shown in the (Figure 14) below images taken by a magnetic imaging resonance (MRI) scan that shows the chronic stroke by different sequences.
The Practical Side
Introduction
The contents of the chapter fall into two parts: the first part represents all the statements of this research including the patients information and the device specifications, the second part represents the conclusions of this research.
Examinations statements
The magnetic resonance imaging (MRI) examinations of this research were carried out on 87 patients, including 48 males and 39 females, sent by specialist neurologists. These tests were conducted at the Academic Medical Center AMC, in Baghdad, Iraq, during the period from “November 2022 till May 2023”.
Four basic sequences were adopted in the research work, which are T1, T2, DWI, FLIAR, and the most dependent sequence was Diffusion Weighted Imaging (DWI).
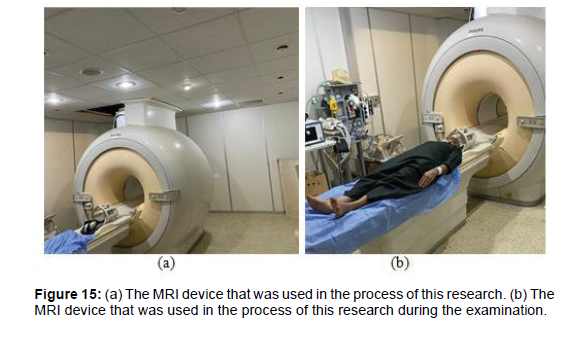
The examinations were carried out using a “Philips Achieva 1.5 tesla MRI machine”.
Specifications of the MR machine
Magnet Strength- 1.5 Tesla shown in the (Figure 15).
Magnet weight- 6400/2900 kg/lbs
Magnet System Open bore diameter- 60 cm
Typical homogeneity at 50x50x45 cm ≤ 0.5 ppm
Pulsars HP+gradients: Max. amplitude for each axis 33 mT/m
Max. slew rate for each axis- 122 T/m/s
Free wave RF: RF Chan 16 channels standard, Parallel Imaging & SENSE coils, SENSE factor up to 16 times acceleration.
Conclusions and Results
1. The correlation between symptom onset and time of stroke has been tested using Spearman coefficient and a significant relation was found with high degree 0.927 at significance of 1% (Table 1).
| Time of stroke | Symptoms onset | |||
|---|---|---|---|---|
| Spearman's rho | Time of stroke | Correlation Coefficient | 1.000 | 0.927 (**) |
| Sig. (2-tailed) | . | .000 | ||
| Symptoms onset | Correlation Coefficient | 0.927(**) | 1.000 | |
| Sig. (2-tailed) | .000 | . | ||
| **Correlation is significant at the 0.01 level (2-tailed). | ||||
Table 1: Shows the Correlation between symptom onset and time of stroke.
2. The correlation between symptom onset and time of stroke has been tested using Chi –square tests.
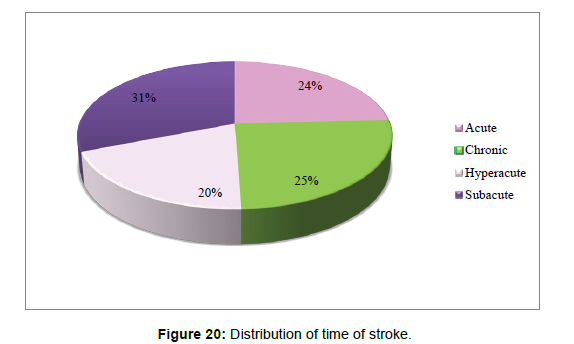
Time of stroke compared to symptoms onset Cross tabulation (Table 2).
| Symptoms onset | Total | |||||
|---|---|---|---|---|---|---|
| Acute | Subacute | Chronic | ||||
| Time of stroke | Acute | Count | 18 | 2 | 1 | 21 |
| % within time of stroke | 85.7% | 9.5% | 4.8% | 100.0% | ||
| % within symptoms on set | 51.4% | 8.7% | 3.4% | 24.1% | ||
| % of Total | 20.7% | 2.3% | 1.1% | 24.1% | ||
| Chronic | Count | 0 | 1 | 21 | 22 | |
| % within time of stroke | 0.00% | 4.50% | 95.50% | 100.0% | ||
| % within symptoms on set | 0.00% | 4.30% | 72.40% | 25.30% | ||
| % of Total | 0.00% | 1.1% | 24.1% | 25.3% | ||
| Hyperacute | Count | 17 | 0 | 0 | 17 | |
| % within time of stroke | 100.0% | .0% | .0% | 100.0% | ||
| % within symptoms on set | 48.6% | .0% | .0% | 19.5% | ||
| % of Total | 19.5% | .0% | .0% | 19.5% | ||
| Subacute | Count | 0 | 20 | 7 | 27 | |
| % within time of stroke | .0% | 74.1% | 25.9% | 100.0% | ||
| % within symptoms on set | .0% | 87.0% | 24.1% | 31.0% | ||
| % of Total | .0% | 23.0% | 8.0% | 31.0% | ||
| Total | Count | 35 | 23 | 29 | 87 | |
| % within time of stroke | 40.2% | 26.4% | 33.3% | 100.0% | ||
| % within symptoms on set | 100.0% | 100.0% | 100.0% | 100.0% | ||
| % of Total | 40.2% | 26.4% | 33.3% | 100.0% | ||
Table 2: Shows the Time of stroke compared to symptoms onset Cross tabulation.
Chi-square tests: 1 cell (8.3%) has expected count less than 5. The minimum expected count is 4.49 (Table 3).
| Value | df | Asymp. Sig. (2-sided) | |
|---|---|---|---|
| Pearson Chi-Square | 116.263(a) | 6 | j |
| Likelihood Ratio | 128.575 | 6 | .000 |
| N of Valid Cases | 87 |
Table 3: States the correlation between symptom onset and time of stroke using Chi–square tests.
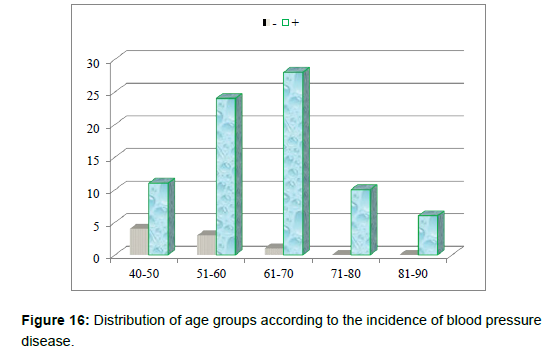
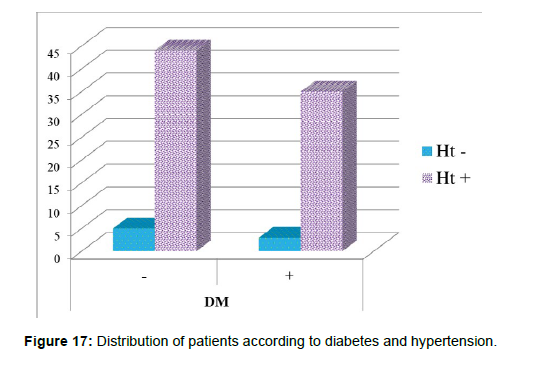
3. Age group patient divided whether having hypertension (+ve) or having hypotension (-ve) (Table 4andFigure 16).
| Hypertension | Total | |||
|---|---|---|---|---|
| -ve | +ve | |||
| age1 | ||||
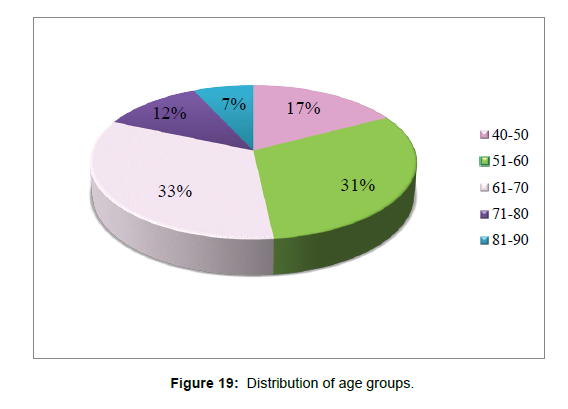
| 40-50 | 4 | 11 | 15 | |
| 51-60 | 3 | 24 | 27 | |
| 61-70 | 1 | 28 | 29 | |
| 71-80 | 0 | 10 | 10 | |
| 81-90 | 0 | 6 | 6 | |
| Total | 8 | 79 | 87 | |
Table 4: That states age group patient and whether they have hypertension (+ve) have hypotension (-ve).
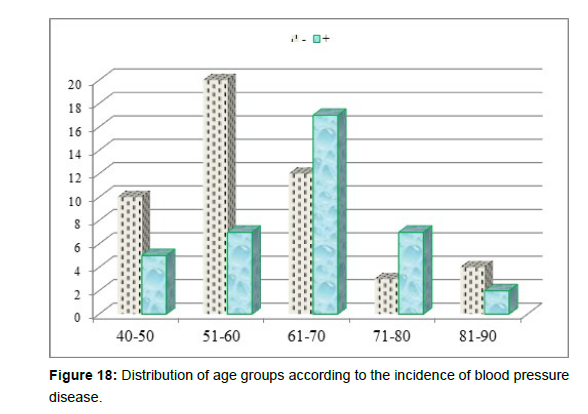
• Age group to incidence of having diabetes mellitus (+ve) or not having (-ve) (Table 5).
| Diabetes Mellitus | Total | ||||
|---|---|---|---|---|---|
| -ve | +ve | ||||
| age1 | 40-50 | Count | 10 | 5 | 15 |
| % within age1 | 66.70% | 33.30% | 100.00% | ||
| % within DM | 20.40% | 13.20% | 17.20% | ||
| % of Total | 11.50% | 5.70% | 17.20% | ||
| 51-60 | Count | 20 | 7 | 27 | |
| % within age1 | 74.10% | 25.90% | 100.00% | ||
| % within DM | 40.80% | 18.40% | 31.00% | ||
| % of Total | 23.00% | 8.00% | 31.00% | ||
| 61-70 | Count | 12 | 17 | 29 | |
| % within age1 | 41.40% | 58.60% | 100.00% | ||
| % within DM | 24.50% | 44.70% | 33.30% | ||
| % of Total | 13.80% | 19.50% | 33.30% | ||
| 71-80 | Count | 3 | 7 | 10 | |
| % within age1 | 30.00% | 70.00% | 100.00% | ||
| % within DM | 6.10% | 18.40% | 11.50% | ||
| % of Total | 3.40% | 8.00% | 11.50% | ||
| 81-90 | Count | 4 | 2 | 6 | |
| % within age1 | 66.70% | 33.30% | 100.00% | ||
| % within DM | 8.20% | 5.30% | 6.90% | ||
| 4.60% | 2.30% | 6.90% | |||
| Total | Count | 49 | 38 | 87 | |
| % within age1 | 56.30% | 43.70% | 100.00% | ||
| % within DM | 100.00% | 100.00% | 100.00% | ||
| % of Total | 56.30% | 43.70% | 100.00% | ||
Table 5: States the correlation between age groups and the possibility of having diabetes.
Chi-square tests: 3 cells (30.0%) have expected count less than 5. The minimum expected count is 2.62 (Table 6 and Figures 17-20).
| Value | df | Asymp. Sig. (2-sided) | |
|---|---|---|---|
| Pearson Chi-Square | 9.821(a) | 4 | .044 |
| Likelihood Ratio | 10.023 | 4 | .040 |
| N of Valid Cases | 87 |
Table 6: Shows Chi-Square Tests.
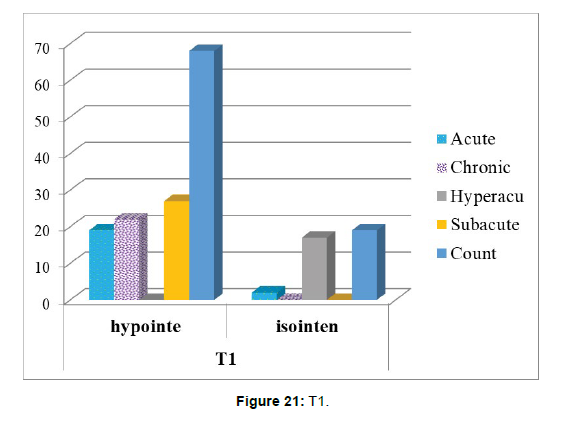
4. The correlation between time of stroke and T1 sequence has been tested using Chi –square tests (Table 7 and Figure 21).
| T1 | Total | ||||
|---|---|---|---|---|---|
| Hyperintense | Isointense | ||||
| Time of stroke | Acute | Count | 19 | 2 | 21 |
| % within time of stroke | 90.5% | 9.5% | 100.0% | ||
| % within T! | 27.9% | 10.5% | 24.1% | ||
| % of Total | 21.8% | 2.3% | 24.1% | ||
| Chronic | Count | 22 | 0 | 22 | |
| % within time of stroke | 100.0% | .0% | 100.0% | ||
| % within T! | 32.4% | .0% | 25.3% | ||
| % of Total | 25.3% | .0% | 25.3% | ||
| Hyperacute | Count | 0 | 17 | 17 | |
| % within time of stroke | .0% | 100.0% | 100.0% | ||
| % within T! | .0% | 89.5% | 19.5% | ||
| % of Total | .0% | 19.5% | 19.5% | ||
| Subacute | Count | 27 | 0 | 27 | |
| % within time of stroke | 100.0% | .0% | 100.0% | ||
| % within T! | 39.7% | .0% | 31.0% | ||
| % of Total | 31.0% | .0% | 31.0% | ||
| Total | Count | 68 | 19 | 87 | |
| % within time of stroke | 78.2% | 21.8% | 100.0% | ||
| % within T! | 100.0% | 100.0% | 100.0% | ||
| % of Total | 78.2% | 21.8% | 100.0% | ||
Table 7: States the correlation between time of stroke and T1.
Chi-square tests: 3 cells (37.5%) have expected count less than 5. The minimum expected count is 3.71 (Table 8).
| Value | df | Asymp. Sig. (2-sided) | |
|---|---|---|---|
| Pearson Chi-Square | 76.399(a) | 3 | .000 |
| Likelihood Ratio | 78.118 | 3 | .000 |
| N of Valid Cases | 87 |
Table 8: shows Chi-Square Tests.
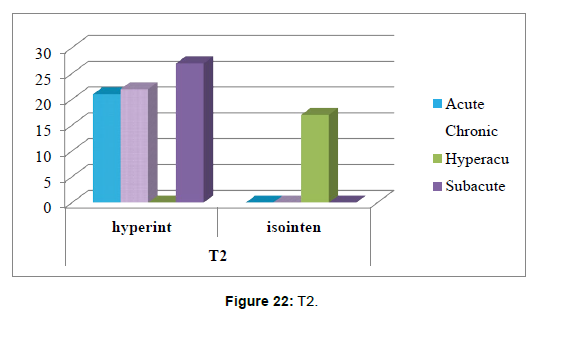
5. The correlation between time of stroke and T2 sequence has been tested using Chi –square tests (Table 9).
| T2 | Total | ||||
|---|---|---|---|---|---|
| Hyperintense | Isointense | ||||
| Time of stroke | Acute | Count | 21 | 0 | 21 |
| % within time of stroke | 100.0% | .0% | 100.0% | ||
| % within T2 | 30.0% | .0% | 24.1% | ||
| % of Total | 24.1% | .0% | 24.1% | ||
| Chronic | Count | 22 | 0 | 22 | |
| % within time of stroke | 100.0% | .0% | 100.0% | ||
| % within T2 | 31.4% | .0% | 25.3% | ||
| % of Total | 25.3% | .0% | 25.3% | ||
| Hyperaute | Count | 0 | 17 | 17 | |
| % within time of stroke | .0% | 100.0% | 100.0% | ||
| % within T2 | .0% | 100.0% | 19.5% | ||
| % of Total | .0% | 19.5% | 19.5% | ||
| Subacute | Count | 27 | 0 | 27 | |
| % within time of stroke | 100.0% | .0% | 100.0% | ||
| % within T2 | 38.6% | .0% | 31.0% | ||
| % of Total | 31.0% | .0% | 31.0% | ||
| Total | Count | 70 | 17 | 87 | |
| % within time of stroke | 80.5% | 19.5% | 100.0% | ||
| % within T2 | 100.0% | 100.0% | 100.0% | ||
| % of Total | 80.5% | 19.5% | 100.0% | ||
Table 9: States the correlation between time of stroke and T2 sequence.
Chi-square tests: 3 cells (37.5%) have expected count less than 5. The minimum expected count is 3.32 (Table 10 and Figure 22).
| Value | df | Asymp. Sig. (2-sided) | |
|---|---|---|---|
| Pearson Chi-Square | 87.000(a) | 3 | .000 |
| Likelihood Ratio | 85.949 | 3 | .000 |
| N of Valid Cases | 87 |
Table 10: Shows the correlation between time of stroke and T2 sequence using Chi –square tests.
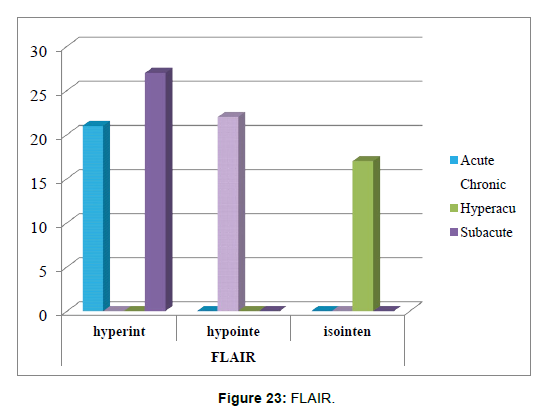
6. The correlation between time of stroke and FLAIR sequence has been tested using Chi –square tests (Table 11).
| FLAIR | Total | |||||
|---|---|---|---|---|---|---|
| Hyperintense | hypointense | isointense | ||||
| Time of stroke | Acute | Count | 21 | 0 | 0 | 21 |
| % within time of stroke | 100.0% | .0% | .0% | 100.0% | ||
| % within FLAIR | 43.8% | .0% | .0% | 24.1% | ||
| % of Total | 24.1% | .0% | .0% | 24.1% | ||
| Chronic | Count | 0 | 22 | 0 | 22 | |
| % within time of stroke | .0% | 100.0% | .0% | 100.0% | ||
| % within FLAIR | .0% | 100.0% | .0% | 25.3% | ||
| % of Total | .0% | 25.3% | .0% | 25.3% | ||
| Hyperacute | Count | 0 | 0 | 17 | 17 | |
| % within time of stroke | .0% | .0% | 100.0% | 100.0% | ||
| % within FLAIR | .0% | .0% | 100.0% | 19.5% | ||
| % of Total | .0% | .0% | 19.5% | 19.5% | ||
| Subacute | Count | 27 | 0 | 0 | 27 | |
| % within time of stroke | 100.0% | .0% | .0% | 100.0% | ||
| % within FLAIR | 56.3% | .0% | .0% | 31.0% | ||
| % of Total | 31.0% | .0% | .0% | 31.0% | ||
| Total | Count | 48 | 22 | 17 | 87 | |
| % within time of stroke | 55.2% | 25.3% | 19.5% | 100.0% | ||
| % within FLAIR | 100.0% | 100.0% | 100.0% | 100.0% | ||
| % of Total | 55.2% | 25.3% | 19.5% | 100.0% | ||
Table 11: Shows the correlation between time of stroke and FLAIR sequence.
Chi-square tests: 4 cells (33.3%) have expected count less than 5. The minimum expected count is 3.32 (Table 12 and Figure 23).
| Value | df | Asymp. Sig. (2-sided) | |
|---|---|---|---|
| Pearson Chi-Square | 174.000(a) | 6 | .000 |
| Likelihood Ratio | 173.098 | 6 | .000 |
| N of Valid Cases | 87 |
Table 12: States the correlation using Chi –square tests.
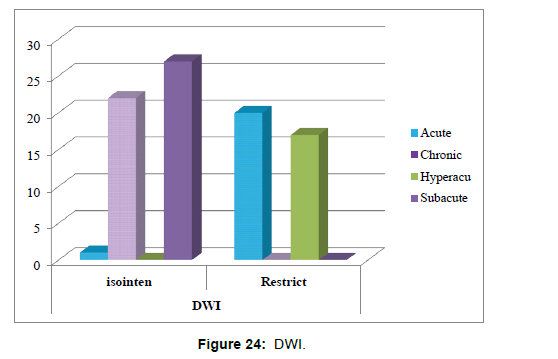
7. The correlation between time of stroke and Diffusion weighted imaging DWI sequence has been tested using Chi-square tests (Table 13).
| DWI | Total | ||||
|---|---|---|---|---|---|
| Isointense | Restrict | ||||
| Time of stroke | Acute | Count | 1 | 20 | 21 |
| % within time of stroke | 4.8% | 95.2% | 100.0% | ||
| % within DWI | 2.0% | 54.1% | 24.1% | ||
| % of Total | 1.1% | 23.0% | 24.1% | ||
| Chronic | Count | 22 | 0 | 22 | |
| % within time of stroke | 100.0% | .0% | 100.0% | ||
| % within DWI | 44.0% | .0% | 25.3% | ||
| % of Total | 25.3% | .0% | 25.3% | ||
| Hyperacute | Count | 0 | 17 | 17 | |
| % within time of stroke | .0% | 100.0% | 100.0% | ||
| % within DWI | .0% | 45.9% | 19.5% | ||
| % of Total | .0% | 19.5% | 19.5% | ||
| Subacute | Count | 27 | 0 | 27 | |
| % within time of stroke | 100.0% | .0% | 100.0% | ||
| % within DWI | 54.0% | .0% | 31.0% | ||
| % of Total | 31.0% | .0% | 31.0% | ||
| Total | Count | 50 | 37 | 87 | |
| % within time of stroke | 57.5% | 42.5% | 100.0% | ||
| % within DWI | 100.0% | 100.0% | 100.0% | ||
| % of Total | 57.5% | 42.5% | 100.0% | ||
Table 13:Shows the correlation between time of stroke and Diffusion weighted imaging DWI sequence.
Chi-square tests: 0 cells (.0%) have expected count less than 5. The minimum expected count is 7.23 (Table 14 and Figure 24).
| Value | df | Asymp. Sig. (2-sided) | |
|---|---|---|---|
| Pearson Chi-Square | 83.103(a) | 3 | .000 |
| Likelihood Ratio | 110.617 | 3 | .000 |
| N of Valid Cases | 87 |
Table 14: States the correlation using Chi –square tests.
References
- Ganguly D, Chakraborty S, Balitanas M, Kim TH (2010) "Medical Imaging: A Review." Commun Comput Info Sci 78: 504-516.
- Abdallah YMY (2015) Increasing of edges recognition in cardiac scintigraphy for ischemic patients. J Biomed Eng Med Imaging 2: 39-48.
- brief historical overview retrieved from Lancaster University.
- https://www.radiologyinfo.org/en/x-ray
- The University of Virginia (2019) Different imaging tests explained. Radiol Med Imaging.
- NPS Medicine Wise (2019) Imaging Explained.
- U.S. Food & Drug Administration (2019) Computed Tomography (CT). FDA.
- Guy C, Ffytche D (2005) An introduction to the principles of medical imaging. Imperial College Press.
- Geldschläger O, Bosch D, Avdievich NI, Henning A (2021) Ultrahigh-resolution quantitative spinal cord MRI at 9.4T. Magn Reson Med 85: 1013-1027.
- Budde J, Shajan G, Scheffler K, Pohmann R (2014) Ultra-high resolution imaging of the human brain using acquisition-weighted imaging at 9.4T. NeuroImage 86: 592-598.
- U.S. Food and Drug Administration (2018) Magnetic Resonance Imaging (MRI).
- Berland LL, Smith JK (2004) Multidetector- Array CT: Once Again Technology Creates New Opportunities. Radiology 231: 327-329.
- Herrlin K, Ling LB, Pettersson H, Willen H, Ryd-holm A (1990) Gadolinium-DPTA enhancement of soft tissue tumors in magnetic resonance imaging. Acta Radiol 31: 233-236.
- NHS (2022) Magnetic resonance imaging (MRI) scan.
- American College of Radiology (2021) MR Safety.
- Radiological Society of North America (2023) MRI Safety.
- Mayo Clinic (2021) Brain Tumor MRI: Risks.
- Adeshina AM, Hashim R, Khalid NEA, Abidin SZZ (2012) Medical imaging modalities: a conceptual review for volume visualization. AWERProcedia Information Technology & Computer Science 115-121.
- Hashemi RH, Bradley WG, Lisanti CJ (2010) MRI: the basics. Lippincott Williams & Wilkins 385.
- National Institute of Biomedical Imaging and Bioengineering Magnetic Resonance Imaging (MRI).
- Centers for Disease Control and Prevention (2023) About stroke. Stroke.
- Jones DL, Adams RJ, Brown TM, Carnethon M, Dai S, et al. (2010) Executive summary: heart disease and stroke statistics--2010 update: a report from the American Heart Association. Circulation 121: 948-954.
- Qureshi AI, Tuhrim S, Broderick JP, Batjer HH, Hondo H, et al. (2002) Spontaneous intracerebral hemorrhage. N Engl J Med 346: 1450-1460.
- Johnston SC, Rothwell PM, Nguyen-Huynh MN, Giles MF, et al. (2007) Validation and refinement of scores to predict very early stroke risk after transient ischaemic attack. Lancet 369: 283-292.
- Tsao CW, Aday AW, Almarzooq ZI, Alonso A, Beaton AZ, et al. (2022) Heart Disease and Stroke Statistics—2022 Update: A Report From the American Heart Association.Circulation 145: e153-e639.
- Cassella CR, Jagoda A (2017) Ischemic stroke Advances in Diagnosis and Management. Emerg Med Clin North Am 35: 911-930.
- Allen LM, Hasso AN, Handwerker J, Farid H (2012) Sequence-Specific MR Imaging Findings That Are Useful in Dating Ischemic Stroke. Radiographics 32: 1285-1297
- Holdsworth SJ, Bammer R (2008) Magnetic Resonance Imaging Techniques: Fmri, Dwi, and pwi. Semin Neurol 28: 395-406.
- MacIntosh BJ, Graham SJ (2013) Magnetic resonance imaging to visualize stroke and characterize stroke recovery: A Review. Front Neurol 4: 60.
- Rovira A, Orellana P, Alvarez-Sabín J, Arenillas JF, Aymerich X, et al. (2004) Hyperacute ischemic stroke: Middle cerebral artery susceptibility sign at echo-planar gradient-echo MR imaging. Radiology 232: 466-473.
- Birenbaum D, Bancroft LW, Felsberg GJ (2011) Imaging in acute stroke. West J Emerg Med 12: 67-76.
- Kloska SP, Wintermark M, Engelhorn T, Fiebach JB (2010) Acute stroke magnetic resonance imaging: current status and future perspective. Neuroradiology 52: 189-201.
- Shafaat O, Sotoudeh H (2023) Stroke Imaging. StatPearlsTreasure Island (FL): StatPearls Publishing USA.
- Londhe SR, Gg SK, Keshava SN, Mohan C (2021) Indian College of Radiology and Imaging (ICRI) Consensus Guidelines for the Early Management of Patients with Acute Ischemic Stroke: Imaging and Intervention. Indian J Radiol Imaging 31: 400-408.
Indexed at, Google Scholar, Crossref
Indexed at, Google Scholar, Crossref
Indexed at, Google Scholar, Crossref
Indexed at, Google Scholar, Crossref
Indexed at, Google Scholar, Crossref
Indexed at, Google Scholar, Crossref
Indexed at, Google Scholar, Crossref
Indexed at, Google Scholar, Crossref
Indexed at, Google Scholar, Crossref
Indexed at, Google Scholar, Crossref
Indexed at, Google Scholar, Crossref
Indexed at, Google Scholar, Crossref
Citation: Rasheed NA, Albumohammed AHS, Jassim OT, Edan KK, RasheedHA (2023) Role of Magnetic Resonance Imaging Sequences in Timing of BrainIschemic Strokes. OMICS J Radiol 12: 483. DOI: 10.4172/2167-7964.1000483
Copyright: © 2023 Rasheed NA, et al. This is an open-access article distributedunder the terms of the Creative Commons Attribution License, which permitsunrestricted use, distribution, and reproduction in any medium, provided theoriginal author and source are credited.
Share This Article
Open Access Journals
Article Tools
Article Usage
- Total views: 1528
- [From(publication date): 0-2023 - Apr 07, 2025]
- Breakdown by view type
- HTML page views: 1299
- PDF downloads: 229
