River Erosion Studies and Significance of Groynes in Preventing Riverbank
Received: 02-Jul-2022 / Manuscript No. jescc-22-66433 / Editor assigned: 06-Jul-2022 / PreQC No. jescc-22-66433 (PQ) / Reviewed: 20-Jul-2022 / QC No. jescc-22-66433 / Revised: 23-Jul-2022 / Manuscript No. jescc-22-66433 (R) / Accepted Date: 23-Aug-2022 / Published Date: 30-Aug-2022 DOI: 10.4172/2157-7617.1000628
Abstract
In the present study, Groynes are flood controlling structures that protect the riverbanks from erosion and also regulate the stream flow. The presence of groynes in the river flow has a major effect on hydraulic parameters such as water discharge, velocity, turbulence, and sediment thickness. The spacing between each groyne, the width and length of the groynes are all significant factors in groyne design. The length of the groynes should not exceed 25% of the river's width; if they are, the river's flow discharge will be reduced. The groynes, if spaced sufficiently between each spur dike, control the turbulent currents of the water flow. Physical experiment methods on the flume provide information on factors such as point velocity, flow depth, bed formations, and other important parameters throughout the channel length. We can determine the Froude number, Reynolds number, point discharge, and other variables using them. When groynes are present on the flume, sediment erosion is reduced when compared to a basic sediment bed. By erecting groynes along the river's banks, scour holes that had previously formed along the river's banks are moved to the tip of the groynes inside the river, avoiding scouring and eroding of the river's banks.
Keywords: Riverbank erosion; Groynes; Sand thickness; Flow depth; Froude number
INTRODUCTION
The major component in fluvial dynamics is bank erosion, which has a significant impact on a variety of physical, ecological, and socioeconomic issues. Some lateral dynamics associated with bank erosion have been significantly known to exhibit positive influences on riparian vegetation succession, the formation and evolution of river and floodplain morphology, and the production of dynamic habitats important for aquatic and riparian species. It is also well known that bank retreat is the result of three processes interacting with one another (erosion processes, and mass wasting). In response to downstream changes in energy circumstances, bank material, and climate, our findings imply the presence of shifting bank process dominance over a hypothetical drainage basin. It is also well known that bank retreat is the result of three processes interacting with one another (erosion processes, and mass wasting). Bulk failure may also arise after the river has been drawn down (for example, after a river flood); water saturates the soil, causing the pore water pressure at the slip surface to rise, reducing the restraining friction along the slip line. The increase in soil weight caused by the additional underground water aids movement. The slippage of bank is predicted to be prevalent in all estuaries with sloping sidewalls. Some rivers of that type, on the other extreme, are generally immune to bank slipping for at least three ways.
Some rivers with stable banks have a healthy level of erosion; nevertheless, unstable rivers and the erosion occurring on their banks are a reason for concern. The most important cause of river bank erosion is deforestation, gravel mining, dam and bridge building, artificial cutoffs, bank revetment, and land use changes influence stream shape flooding. Flooding is more likely during the wet season. During a flood, a large volume of water moving at a high velocity has enough energy to rip the top layers of soil away or possibly induce catastrophic collapse. Strong and severe rainfall can degrade top soil. Strong vibrations caused by heavy rains can destabilize and deteriorate non-cohesive bed components. Sedimentation can be driven by a range of environmental phenomena. As the river's banks get saturated, silt deposition limits the river's water holding capacity. As a result, the water's course has been altered. Because of the volume of water moving or the high stream gradient, a strong current form. River bank erosion can occur if river currents are quite strong. Anthropogenic activities such as deforestation, gravel mining, dam and bridge building, artificial cutoffs, bank revetment, and land use changes influence stream shape and ecological patterns [1]. Natural occurrences are weaker than anthropogenic activities when it comes to modifying stream patterns [2].
Anthropogenic activities such as deforestation, gravel mining, dam and bridge building, artificial cutoffs, bank revetment, and land use changes influence stream shape and ecological patterns. Natural occurrences are weaker than anthropogenic activities when it comes to modifying stream patterns [3]. Anthropogenic activities such as and ecological patterns. Natural occurrences are weaker than anthropogenic activities when it comes to modifying stream patterns. Dam development, particularly in the middle reaches, has a global influence on rivers and streams. Dams have impacted more than half of the world's biggest streams (172 of 292) to a certain extent [4].
Continuous cutting and deterioration can obstruct commerce in the lower river owing to sediment deposition, necessitating the construction of dams. Large rocks may be carried along with the flow, obstructing manmade rivers built for farming and home uses. Rivers can sometimes alter their course, making navigating more challenging. Due to changes in water pressure and sediment, certain streams alter their flow patterns, causing damage to nearby residents. Understanding the mechanisms of soil erosion and sediment movement along rivers is critical because it may aid in the identification of erosion- prone regions and the development of appropriate mitigation solutions. The Control of Riverbank Erosion is required since river bank erosion happens in a natural field of groynes is a collection of structures that work together to manage a river's flow route and sand deposit sites.
Setting on the water; most people choose to mitigate it with natural materials. You will discover anything from temporary and biodegradable materials to permanent solutions when looking at stream bank eroding management choices. The methods of controlling river bank erosion are Natural Vegetation in which Stream banks with vegetation erode at a slower rate than those without. This is because the vegetation's roots strengthen the soil along the river bank, making the bank less prone to failure. The second method is the use of Geo textiles which come in a range of compositions and may be used for a number of purposes. Geo- textiles made of synthesized fibers, woven or nonwoven, are one possibility. Woven geo-grids are extremely robust, making them ideal for large draining and flood mitigation projects. Also, we can use Groynes which are also known as a spur dike, is a wall-like barrier built some distance in a stream from the riverbank, somewhat perpendicular to the stream path, with the goal of inducing the waters to flow some distance from the riverbank where the structures are moored.
The research studies by A. Hiba A. Abbas [5] includes experimental studies for determining the local scour depth near S- shape concrete non-submerged stream barbs using a variety of stream barbs and spacing among them as two remedies to minimize scouring. Groynes can reduce stream erosion strength and sand transportation energy by regulating hydraulic conditions and creating smoother fluid motion. The channel and Groynes from the Heltz Lab model were analyzed using the Flow-3D simulation analysis in this investigation. The most essential challenges in spur dike analysis are scour testing and identifying the depth of scouring. A model spur dike was examined in a lab flume with a 180-degree curve in transparent flow. The study's findings revealed that the presence of slop in the groyne's body might reduce the size of the scouring surrounding it. Furthermore, the quantity of scouring around the groyne was formed with a 60° inclination, and its peak was formed with a 90° angle. According to [6], this work proposes a technique for selecting the ideal mix of groynes in terms of their number, lengths, and placements for limiting bank erosion. In this regard, a linked modelling model is designed, that reduces the groyne project's total construction cost.
According to D Dutta [7], a literature review found that comparing the stream channel, to assess and enhance the groynes structural resistance for vessel-induced long periodical wave stresses. Fayaz performance of straight head and T-head stream barbs remains insufficient. As a result, mathematical simulations for both types of stream barbs, especially in channel bend, have been Deepali Kulkarni [8-9] conducted an experimental examination on several permeable spurs with varied hydraulic parameters such as velocity, discharge of water, sand loss, and scour near the groyne edge.built in this study, and their efficiencies have been investigated using MIKE21C simulation tool. The research study by E Fatimah [10] focused on the stretch of riverbank that experienced scouring and despoliation riverbed because of river bridge pier and abutment. In comparison to the control sites, the groyne building boosted species composition, biodiversity, and changed the configuration of functional categories into more varied and sustainable type [11] found that groynes were built along the river to safeguard the Elbe waterfront from eroding and to control the flow. In-situ research was being conducted in Juelssand, on the Elbe A. Khan [12] provide a 2D CFD model that is based on shallower water equations and includes an erosion simulation. In the hydraulic designing phase, the peak scouring depth around spur dikes is critical and is a significant parameter for determination of erosion near the groynes as per Hojaat Karami [13]. The finite volumetric approach and high shock capture methodologies are used to solve the computations. Jennifer Duan [14] used a two-dimensional hydro-dynamic mathematical approach of sedimentation assessment using the Navier Stokes equation to compute average velocity of flow in the x and y directions of stream to study the pattern of flow in a stream with groynes installed. M Vaghefi [15] used Flow Three Dimension Software to examine the pattern of water flow near a T shape groyne at upstream section in a perpendicular curve. They used Pressure Energy, Kinetic Energy, and Bernoulli's equation. As per Nilesh A Dingorkar [16], studies were conducted on several permeable groynes to determine hydraulic variables such as velocity, discharge, flow segregation, sand transportation capability, and depth of scour.
Methodology
Experimental setup consists of a flume which is of certain scale of a section of a river. The length of the flume is 4m but the analysis of flow is considered on 3m length of the flume. The flume is cleaned by allowing free discharge through it. Sand is taken and spread all along the 2.5m length with uniform thickness of 2cm. Initially, the flow takes place on plain sand bed with depth of water, depth of sand and velocity of water being measured at every 50cm all throughout the length of the flume and every reading is being measured at all these readings at 7.5cm, 15cm and 22.5cm width of the river. After carrying out the experiments on plain sand bed, then 5 uniform groynes are installed in the flume with uniform spacing between them. The flow is then carried out with different depths of water and changes in bed form are analyzed. The same process is repeated with different set of experiments. In the first case after installation of groynes, the depth of sand is 2cm and in the other case, the depth of sand is 1.5cm initially. In each case, the depth of water, the depth of sand and flow velocity of water is determined at every 50cm along the length at 3 points along the width of the river. With these parameters, we determine the discharge of water, the Froude Number.
The Separate probability function is required for the distribution of the bed form height and bed form length. Observations were carried out on a model of a section of river i.e., flume for the following set of :
1) Flume of 4m length and 30cm width in which 3m length is taken into consideration for Experiment.
2) Sand bed of 2cm thickness in case of Plain sand bed and in groyne bed of sediment thickness of 1.5 cm.
3) 5 Equal Submerged groynes of dimension 6cm length, 4 cm height and 1.2 cm thickness. Experiments with 2 different conditions, i.e., plain sand bed and Groynes installed sediment bed with sand depth of 2 cm in both the cases.
4) A Point gauge to measure the depth of water and depth of sand.
5) Manometric setup with pitote tube to measure the velocity of water.
Case 1
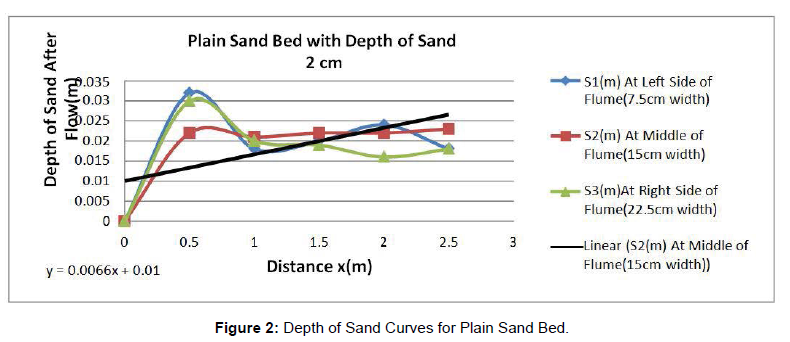
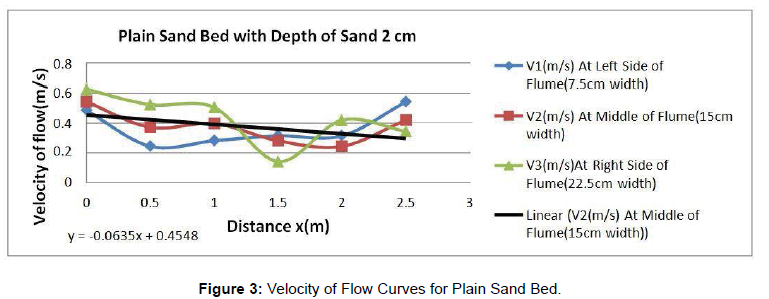
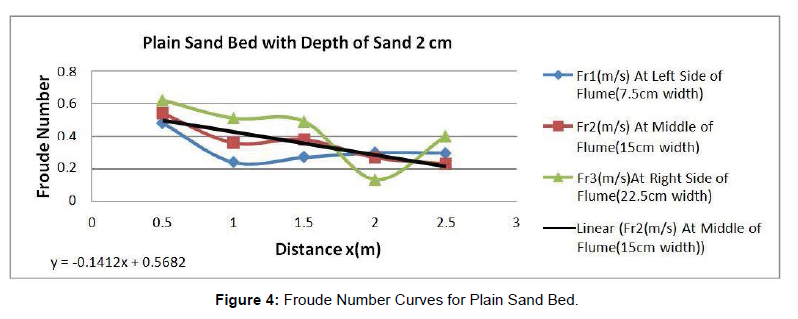
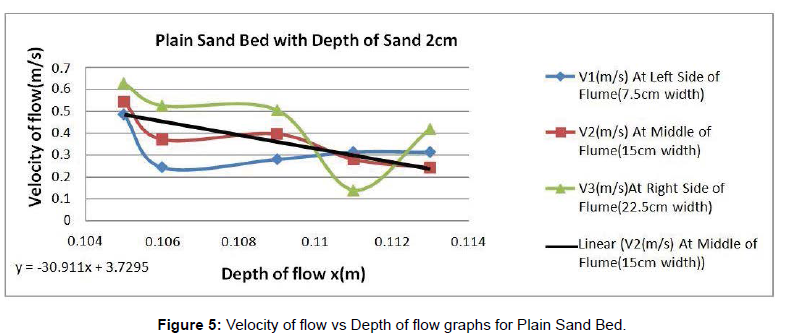
Plain sand bed with depth of sand bed 2 cm thick (Figure 1-5) (Table 1).
| S.No | Distance along the length of Flume(m) |
Depth of Sand(m) | Depth of Flow(m) | Velocity of Flow(m/s) | Discharge (cu.m/s) | Froude Number |
|---|---|---|---|---|---|---|
| 1 | 0.5 | 0 | 0.103 | 0.54 | 0.0167 | 0.5372 |
| 2 | 1 | 0.022 | 0.105 | 0.37 | 0.0117 | 0.3646 |
| 3 | 1.5 | 0.021 | 0.106 | 0.39 | 0.0124 | 0.3825 |
| 4 | 2 | 0.022 | 0.109 | 0.28 | 0.0092 | 0.2708 |
| 5 | 2.5 | 0.022 | 0.111 | 0.24 | 0.0080 | 0.2300 |
| 6 | 3 | 0.023 | 0.113 | 0.42 | 0.0142 | 0.3989 |
Table 1: Flow Properties along the central line of Flume (Half Width 15cm from both sides).
Case 2
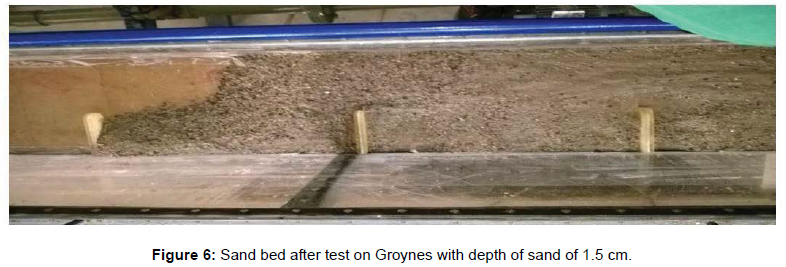
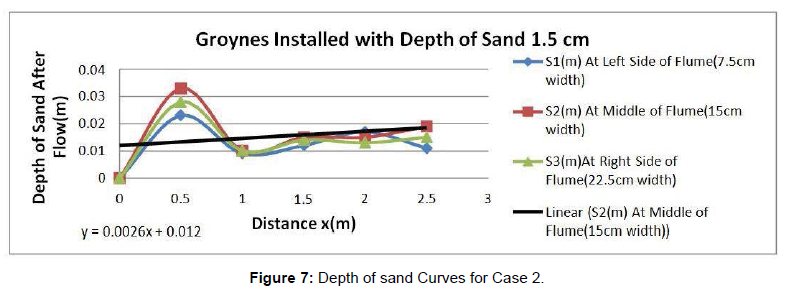
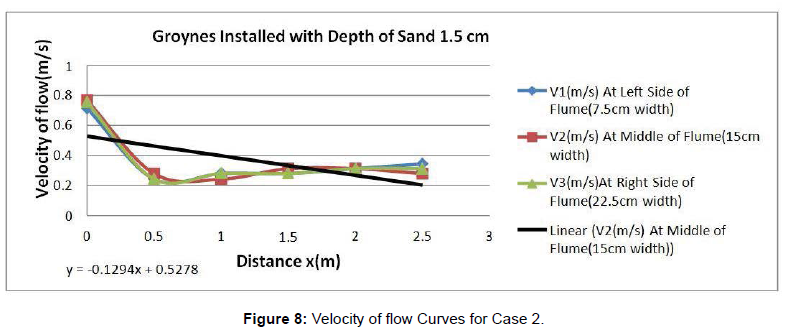
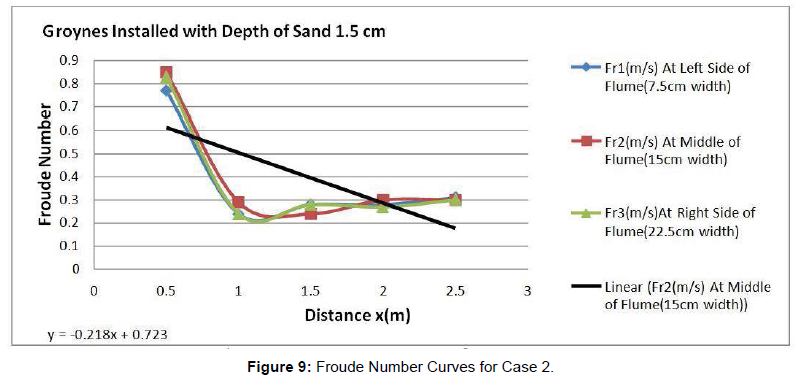
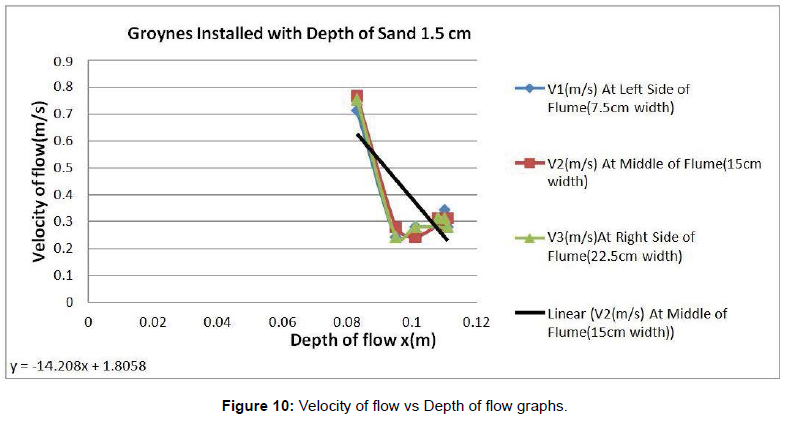
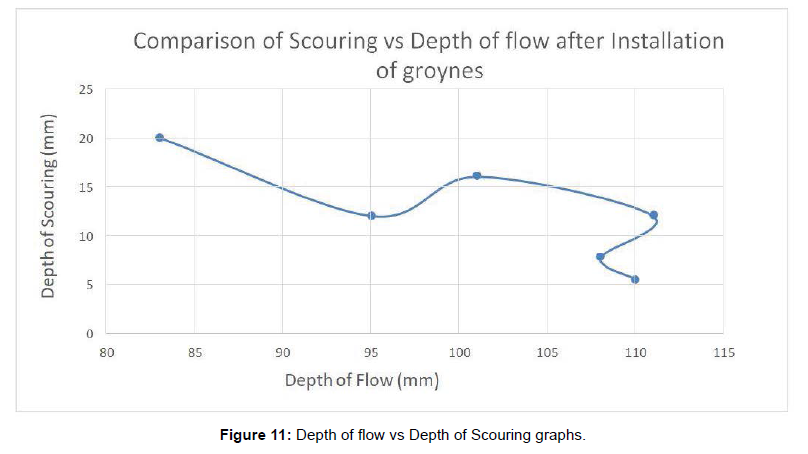
Five uniform groynes installed in river flume with depth of sand bed 1.5cm (Figure 6-11) (Table 2).
| S.No | Distance along the length of Flume(m) | Depth of Sand(m) | Depth of Flow(m) | Velocity of Flow(m/s) | Discharge (cu.m/s) | Froude Number | Depth of Scouring (m) |
|---|---|---|---|---|---|---|---|
| 1 | 0.5 | 0 | 0.083 | 0.77 | 0.0192 | 0.8533 | 0.2 |
| 2 | 1 | 0.033 | 0.095 | 0.28 | 0.0080 | 0.2900 | 0.12 |
| 3 | 1.5 | 0.01 | 0.101 | 0.24 | 0.0073 | 0.2411 | 0.16 |
| 4 | 2 | 0.015 | 0.111 | 0.31 | 0.0103 | 0.2971 | 0.12 |
| 5 | 2.5 | 0.015 | 0.108 | 0.31 | 0.0100 | 0.3012 | 0.078 |
| 6 | 3 | 0.019 | 0.11 | 0.28 | 0.0092 | 0.2695 | 0.055 |
Table 2: Flow Properties at Middle of Flume (15cm of Width).
Results and Discussions
The areas between groynes were monitored to help understand the sediment transport process. The sediment deposition takes place in case of submerged groynes in the groyne field along the normal flow of the river and the sediments are transported into the groynes because of the mixing layer created by the presence of groynes. After seeing the graphs between distance of flume and the velocity of flow, the velocity of flow has finally reduced in middle part of flume along the Thalweg line and also in the groyne field, but has increased in the main river channel (Table 3).
Cases |
Sand Size | Uniform Thickness of Sand Layer before flow |
Weight of Dry Sediment Sample | Reynolds Number | Froude Number |
|---|---|---|---|---|---|
| (1) Plain Sand Bed with thickness of sand layer 2cm | 0.125cm | 2cm | 12.793 gm | Maximum: 71789 |
Maximum: 0.626 |
| Minimum: 17303 |
Minimum: 0.135 |
||||
| (2) Five Uniform Groynes Installed in River Flume with thickness of sand layer 1.5 cm | 0.125cm | 1.5 cm | 16.836 gm | Maximum: 71529 |
Maximum: 0.85 |
| Minimum: 26168 |
Minimum: 0.243 |
Table 3: The various results that are generated from all experiments generated in tabular form are as below.
In case of groyne filled bed, it was seen that the depth of sand initially increases and then decreases. In the main river there is finally erosion of sand, but in the groyne field and the middle of the channel, there is deposition of sediments. From the best fit curve, it can be seen that there is net deposition of sediments in the river in this case. i.e. where groynes are installed, there is control of erosion as compared to main river bed. After seeing the graphs between distance of flume and the velocity of flow from fig., the velocity of flow has finally reduced all along the length of flume and also in the groyne field. From the comparison of Scouring vs Depth of flow in the groyne installed bed, the scouring is initially the highest before the first groyne. After the first groyne, the erosion and scouring are reduced. Initially it reduces, then increases and rises. On the other hand, when we saw the work carried out by Mahdi Al Khateeb [17] as per his curve between scour depth vs flow depth, for smaller number of groynes, there is more scouring for higher depth of flow. With a greater number of groynes, the scouring is initially the same for higher depth of flow; the scouring is reduced with 3 or more number of groynes installed. The increase in Froude number increases the effect of scouring. In both cases, mine as well as Dr Mahdi Al Khateeb [18-21], maximum amount of scouring occurs at the initial groyne as these barriers hinder the flow velocity and the reduce the effect of scouring and erosion.
Conclusions
1. From Table-1 and Table-2 of experimental work, it was analyzed from Froude number that the flow is subcritical. For higher Froude Number, the scouring is more as observed in experimental results.
2. In all experimental flow conditions, there was net import of sediments into the groyne fields except for the plain sand bed since there were no groynes in plain sand bed.
3. From all set of experiments, the depth of sand is higher in case of groyne area as compared to main river channel. There is formation of scour holes near the nose of groyne tip and these help to regulate the flow in the channel surface where required so as to increase navigability in rivers.
4. In our case of submerged groynes, the sediment is transported to the groyne fields across the whole length of normal line. The sedimentation starts from the first groyne, which initially increases but due to reduction in turbulence, it decreases. Diffusion through the mixing layer and secondary flow circulation play a role.
5. There is formation of Scour holes near groyne tip. The Scour hole depth is reduced after the initial groyne. Scour is found usually to concentrate at a region just downstream the groyne. This observation can be explained physically by the fact that scouring is due to the horseshoe horse-shoe vortex system whose dimensions may be function controlled strongly by the number and spacing of successive groynes.
6. The scour depth varied proportionally with the variation in velocity of flow of water and Froude number. This is followed by increase in separation zone causing production of eddy currents that deepen the scour hole.
7. In the case of sediment bed with groynes, the sediment sample has less weight of sediment sample as compared to plain sand bed. The erosion control in this case is higher as compared to plain sand bed as observed from the graph between depths of sand vs distance along the length of flume.
References
- Khan FA (2021) Two-Dimensional Hydrodynamic Erosion Model Applied to Spur Dykes. J mech continua math sci 16(2):2-17.
- Aziz P, Kadota A (2008) Experimental Study of Morphological Changes and Flow Structure around the Vegetated Groyne. Int J Adv Sci Eng Inf Technol 8(1):99-107.
- Bhuiyan F, Hey RD, Wormleaton PR (2010) Bank-Attached Vanes for Bank Erosion Control and Restoration of River Meanders. J Hydraul Eng 13(9):2-17.
- Bora K, Kalita HM (2019) Determination+ of best groyne combination for mitigating bank erosion. J Hydroinformatics 21(5):875-892.
- Buczyńska E (2018) Human impact on large rivers: the influence of groynes of the River Oder on larval assemblages of caddisflies (Trichoptera). Hydrobiologia 819(1):177-195.
- Duan JG, Nanda SK (2006) Two-dimensional depth-averaged model simulation of suspended sediment concentration distribution in a groyne field. J Hydrol 327(4):426-437.
- Dutta D, Kalita HM (2009) Performances of Straight Head and T-head Groynes as River Training Structures. IOP Conf Ser Mater Sci Eng 491(1): 012-040.
- Fatimah E, Fauzi A, Rezeki S (2020) Numerical simulation of groyne placement in minimising Krueng Aceh river bank erosion. IOP Conf Ser Mater Sci Eng 933(1):012-040.
- Giglou AN, Mccorquodale JA, Solari L (2018) Numerical study on the effect of the spur dikes on sedimentation pattern. Ain Shams Eng J 9(4):2057-2066.
- Hiba Abbas AA, Khassaf SI (2019) Detection Wetland Dehydration Extent with Multi-Temporal Remotely Sensed Data Using Remote Sensing Analysis and GIS Techniques. Int J Civ Eng 10(1):155-166.
- Karami H, Ardeshir A, Saneie M (2012) Prediction of time variation of scour depth around spur dikes using neural networks. J Hydroinformatics 14(1):180-191.
- Kondolf GM, Gao Y, Annandale G (2014) Sustainable sediment management in reservoirs and regulated rivers: Experiences from five continents. Earth’s Future 2(5):256-280.
- Kulkarni D, Vidyapeeth B, Dingorkar NA (2017) Study of River Training Work On Permeable Groynes. Int J Civ Eng 8(6):262-270.
- Mahdi Al-Khateeb HM, Abdulameer AL-Thamiry HK, Hadi Hassan H (2016) Evaluation of Local Scour Development Around Curved Non- Submerged Impermeable Groynes. Int J Sci Res 5(1):83-89.
- Nilsson C, Reidy CA, Dynesius M (2005) Fragmentation and flow regulation of the world’s large river systems. Science 308(5720):405-408.
- Rashedipoor A, Masjedi A, Shojaenjad R (2012) Investigation on scour hole around spur dike in a 180-degree flume bends. World Appl Sci J 19(7):924-928.
- Shahraki A (2017) The Effect of the Spur Dike Wall Angle on Controlling Scour Around It in Straight Path. Int J Sci Study 5(4):456-459.
- Tschirschwitz F, Mechelke K, Jansch H (2016) Monitoring and deformation analysis of groynes using tls at the river elbe. Int Arch Photogramm Remote Sens Spat Inf. Sci - ISPRS Arch 11(41):917-924.
- Vaghefi M (2015) The Effect of Support Structure on Flow Patterns Around T-Shape Spur Dike in 90° Bend Channel. Arab J Sci Eng 40(5):1299-1307.
- Wu Y, Chen J (2012) Modeling of soil erosion and sediment transport in the East River Basin in southern China. Sci Total Environ 441(15):159-168.
- Yamani M, Goorabi A, Dowlati (2011) The Effect of Human Activities on River Bank Stability (Case Study). Am J Environ Sci 7(3):244-247.
Indexed at, Google Scholar, Crossref
Indexed at, Google Scholar, Crossref
Indexed at, Google Scholar, Crossref
Indexed at, Google Scholar, Crossref
Indexed at, Google Scholar, Crossref
Indexed at, Google Scholar, Crossref
Indexed at, Google Scholar, Crossref
Indexed at, Google Scholar, Crossref
Indexed at, Google Scholar, Crossref
Indexed at, Google Scholar, Crossref
Indexed at, Google Scholar, Crossref
Indexed at, Google Scholar, Crossref
Indexed at, Google Scholar, Crossref
Indexed at, Google Scholar, Crossref
Indexed at, Google Scholar, Crossref
Indexed at, Google Scholar, Crossref
Citation: Jafri MA, Shakeel M, Rehman A (2022) River Erosion Studies and Significance of Groynes in Preventing Riverbank. J Earth Sci Clim Change, 13: 628. DOI: 10.4172/2157-7617.1000628
Copyright: © 2022 Jafri MA, et al. This is an open-access article distributed under the terms of the Creative Commons Attribution License, which permits unrestricted use, distribution, and reproduction in any medium, provided the original author and source are credited.
Share This Article
Recommended Journals
Open Access Journals
Article Tools
Article Usage
- Total views: 2654
- [From(publication date): 0-2022 - Apr 03, 2025]
- Breakdown by view type
- HTML page views: 2296
- PDF downloads: 358


