Research Article Open Access
Risk Assessment of In-Vehicle Noise Pollution from Highways
Qing Li1*, Fengxiang Qiao1and Lei Yu21Innovative Transportation Research Institute, Texas Southern University, 3100 Cleburne Street, Houston, 77004, Texas, USA
2College of Science, Engineering and Technology, Texas Southern University, Texas, USA
- *Corresponding Author:
- Qing Li
Innovative Transportation Research Institute
Texas Southern University
3100 Cleburne Street, Houston
77004, Texas, USA
Tel: 713-313-7532
E-mail: liq@tsu.edu
Received date: December 06, 2016; Accepted date: December 26, 2016; Published date: January 01, 2017
Citation: Li Q, Qiao F, Yu L (2016) Risk Assessment of In-Vehicle Noise Pollution from Highways. Environ Pollut Climate Change 1:107.
Copyright: © 2016 Li Q, et al. This is an open-access article distributed under the terms of the Creative Commons Attribution License, which permits unrestricted use, distribution, and reproduction in any medium, provided the original author and source are credited.
Visit for more related articles at Environment Pollution and Climate Change
Abstract
Regular and long-term elevated noise exposure can bring about various adverse health effects, such as hearing impairment, hypertension, heart disease and sleep disturbance. Many noise pollution controls have been implemented in industries, transport vehicles, households and other sources. However, relatively little attention has been paid to in-vehicle noise. In-vehicle noise is overall higher than the maximum safe level of 70 dB(A) for 24 h exposure without harmful effects. Though the excessive noise may not induce acute adverse health consequences, millions of commuters are chronically exposed to the hazardous noise during daily commuting. There are fewer studies investigated the in-vehicle noise exposure and its adverse health consequences to the public, most relevant noise controls are limited to vehicle manufacturing industries, which underestimate or ignore the impacts of ambient traffic and road conditions on the in-vehicle noise. This motivates the objective, which is to assess the risk of hazardous noise exposure on highways for commuters. Twelve subjects were recruited for an on-road driving test on State Highway 288 in Houston to collect real-time in-vehicle noise levels and vehicle activity. Results show that commuters are more likely to be exposed to the noise level between 75 dB(A) and 85 dB(A). At the driving speed of 70 kph above, the in-vehicle noise level exceeds the public health and welfare marginal safe level of 8 h 75 dB(A).
Keywords
Noise; In-vehicle noise; Interior vehicle noise; Pollution; Highways; Risk assessment.
Introduction
Noise is one of the typical hazardous emissions. Regular and longterm exposure to elevated noise can bring about various adverse health consequences, such as hearing impairment, hypertension, ischemic heart disease, annoyance, and sleep disturbance [1,2]. The maximum safe noise level (MSNL) for human beings is 70 dB(A) for 24 h exposure without harmful effects [3]. 85 dB(A) or higher can cause permanent damage to hearing sensitivity and even induce hearing loss [4]. Noiseinduced hearing loss is one of the most common occupational illnesses. In the United States, 10 million people have already suffered irreversible hearing damage from noise and 30 to 50 million people are daily exposed to the hazardous noise [5].
The U.S. Environmental Protection Agency [6] documented an 8 h level of 75 dB(A) as the public health and welfare marginal safe level. Regarding occupational noise, 90 dB(A) is the limit for maximum 8-hr exposure. Meanwhile, the U.S. Occupational Safety and Health Administration [7] enforces the usage of hearing protectors to attenuate the noise level to an 8 h Time Weighted Average (TWA) of 85 dB(A). Various noise pollution controls have been implemented in households, industries, traffic and other noise sources; whereas an automobile cab has been never regarded as a place that needs to protect passengers and drivers from noise and the impacts of in-vehicle noise on public health have been seldom addressed in transportation studies.
In terms of in-vehicle noise, the source can be divided into structureborne and airborne noise. The structure-borne noise is generated by vibration at a mounting point. The vibration waves propagate through the vehicle structure, and then radiate acoustically into the cabin. The noise effects are formed by structural resonance and cabin acoustic modes with dominant low frequency of 500 Hz below [8]. The components of a vehicle, such as engine accessories, cooling fans, braking, and exhaust systems, can generate the structure-borne noise [9]. On the other hand, the airborne noise is referred to the noise that is directly transmitted via the air into the cabin through gaps and leakage of a vehicle, such as the tire-interface noise, wind noise, and ambient vehicles, which are mostly at the frequency of 800 Hz above [10]. Another study reported that elevated noise at frequencies of 500, 1000, and 3000 Hz may impair hearing, such as inability to hear and understand speech [11]. The hazard of hearing impairment can be measured by sound pressure level and frequency, distribution of the noise, the time pattern and duration of exposure, and individual susceptibility. Besides, the hazard is proportional to the acoustic energy received by the ear with 3 dB(A), 4 dB(A) and 5 dB(A) trading rule. The equal energy rule of 3 dB(A) appears to be a better predictor of noise hazard for most practical conditions [11].
In fact, most of the people in the U.S. rely on their personal vehicles for mobility and each of them spends an average of 25.4 min for daily commuting [12] and stuck in traffic from 42 h/year for San Diego commuters to 82 h/year for Washington DC commuters [13]. What’s more, recent studies found that in-vehicle noise is overall higher than the MSNL and is also subject to driving speed. For example, Li et al. [14] found that drivers are exposed to in-vehicle noise level of 71.10 to 72.59 dB(A) on arterial roads during weekday daytime. The in-vehicle noise level increases to 81 dB(A) on the highway with concrete pavement and 75 dB(A) with asphalt pavement at the midnight [15].
Nevertheless, there is still a lack of studies in the in-vehicle noise exposure during weekday daytime and its risk of adverse health consequences to the public. With regard to this, this research is proposed to investigate the distribution of in-vehicle noise exposure levels, assess the risk of the in-vehicle noise exposure for commuters, and simplify the estimation of hazardous noise exposure on highway.
Methodology
The risk of in-vehicle noise exposure is assessed by hazardous exposure probability, Equivalent Exposure Time Factor (EETF), TWA daily noise level. The thresholds 8-hr exposure of 75 dB(A), 85 dB(A) and 90 dB(A) were adopted to estimate the risk of hazardous effects.
The hazardous exposure probability is the number of noise levels that are greater than the thresholds divided by the total number of all noise measurement. The EETF is 3 dB(A) exchange rate based daily equivalent exposure time for each threshold divided by the distance traveled during the exposure, expressed as Equation (1).

where Li is each measured noise level that is greater than the three threshold, Lthreshold is the level of the three thresholds, and d is the distance traveled during exposure.
The TWA is a measure of combined effects caused by daily multiple periods of noise exposure at different noise levels, expressed by Equation (2) and (3).

where Dose is normalized to 8 h exposure daily, N is the total measured noise data points that are greater than the thresholds, Ci is the time spent at each excessive noise exposure.
Test plan and data collection
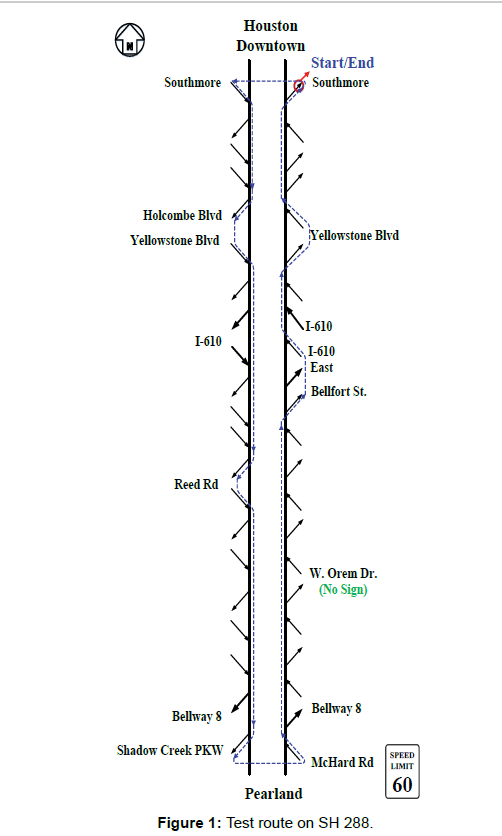
An on-road driving test was conducted on the State Highway (SH) 288 in Houston Texas in May 2016. A total of twelve subjects were recruited, who held a valid Texas driver’s driving license. Subject drove a dedicated vehicle through a designed test route indicated by the dash line in Figure 1 for approximately 9 rounds during a weekday at three different traffic periods, including the morning peak between 7:00 am and 9:30 am, the nonpeak between 1 pm and 3 pm and the afternoon peak between 4:00 pm and 6:30 pm. Each round takes approximately 25 min to 1 h, depending on dynamic traffic situations (Figure 1).
The entire test route is about 35 km long, from the entrance at Southmore St. to Shadow Creek PKW, and back to the exit at Southmore St., on which the speed limit is 97 kph (60 mph). As the test route shows, the entrance at Southmore is the start point as well as end point, and each subject needed to get on and off the highway seven times, so as to measure the in-vehicle noise while driving not only on mainline freeway, but also on the frontage roads, and the on-and offramps. Besides, during the on-road test, subjects were requested to keep silent and the vehicle air condition was set to the lowest level.
The dedicated vehicle was a Nissan 2014 altima, the On-Board Diagnosis (OBD)-II port of which was connected with a laptop for realtime recording of vehicle driving speed. Meanwhile, at the center of the vehicle cab, a digital sound meter was placed, with a measurement range from 30 dB((A) to 130 dB(A), an accuracy of +1.5 dB(A), and a sampling rate of 2 Hz. The measured noise levels and driving speeds were synchronized and interpolated for data pairs by a self-developed Matlab program.
Results and Discussion
In-vehicle noise distribution on highway
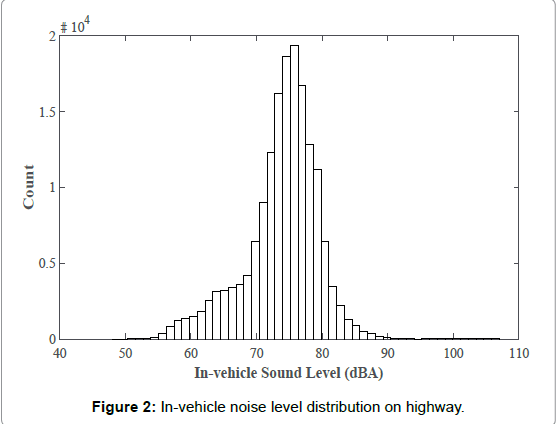
Figure 2 shows that the in-vehicle noise level on Highways ranges from 55 dB(A) to 90 dB(A). These noise data points mostly concentrate on the noise levels between 70 dB(A) and 80 dB(A), at which level drivers are more likely to be exposed. Short-term exposure to such a noise level can bring about negligible risk of adverse health effects [16].
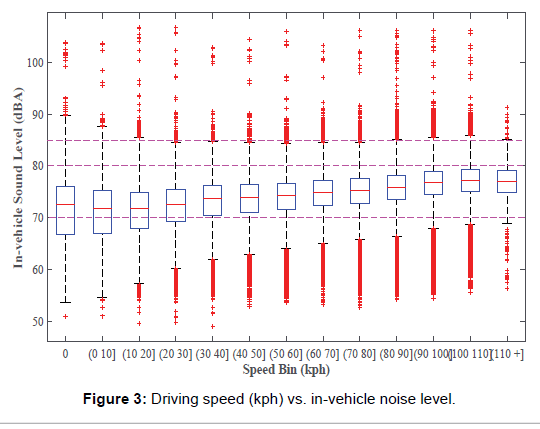
Figure 3 illustrates the distribution of in-vehicle noise levels along the increasing vehicle speed. General speaking, there is a trend that the noise level rises with the increase in driving speed bins. Meanwhile, the upper and lower quartile of each distribution becomes shorter along with the increasing speed. Apparently, it seems that the speed bin is linearly associated with the noise level. Besides, it is worth noting that the distribution of the noise level is more dispersive during idling and nearly idling represented by bin 0 and bin (0 10), respectively, and the noise levels at these two bins are the lowest.
Comparatively, the noise levels in other speed bins (20+) are concentrated, but there are more outliers indicated by the crosses. The concentrated distribution could be explained by the dominant operation at higher speed bins, foot on gas pedal to maintain speed. The outliers could be generated by passing heavy engine vehicles, such as heavy trucks.
Probability of hazard exposure
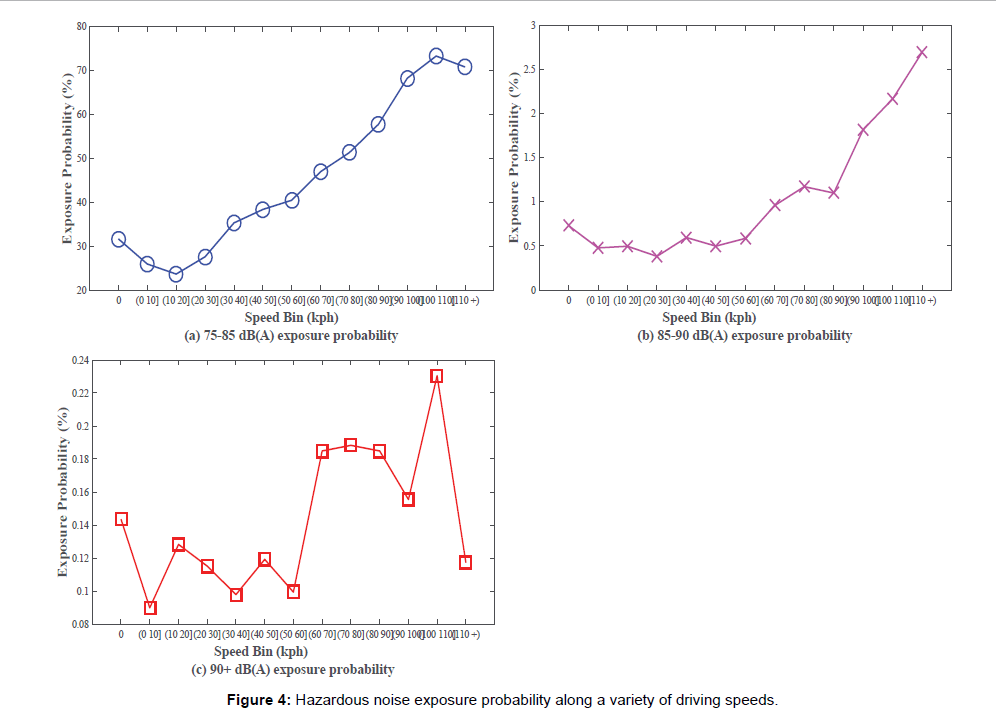
Figure 4a shows that the probability of 75-85 dB(A) declines from 32% at speed bin 0 to about 23% at speed bin 10-20 kph and then gradually increase to approximately 74% at bin 100-110 kph. Thereafter, the probability declines slightly to 70% at 110 kph above. Drivers are more likely to be exposed to 75 dB(A) above at higher driving speed.
Compared with the 75-85 dB(A) exposure probability, the likelihood of 85-90 dB(A) and 90 plus dB(A) exposure are obviously lower with up to 2.7% and 0.3%, respectively, as shown in Figures 4b and 4c. Likewise, there is a growing trend in the 85-90 dB(A) exposure probability along the increasing driving speeds. The general trend of the probability of 90 plus dB(A) is similar to the ones between 75 dB(A) and 90 dB(A), it fluctuates considerably along the driving speed. This fluctuation may be caused by heavy engine vehicles that occasionally pass by. Keep in mind that a passing heavy truck can produces 90 dB(A) at 15.24 m (50 ft) distance.
Equivalent exposure time factors
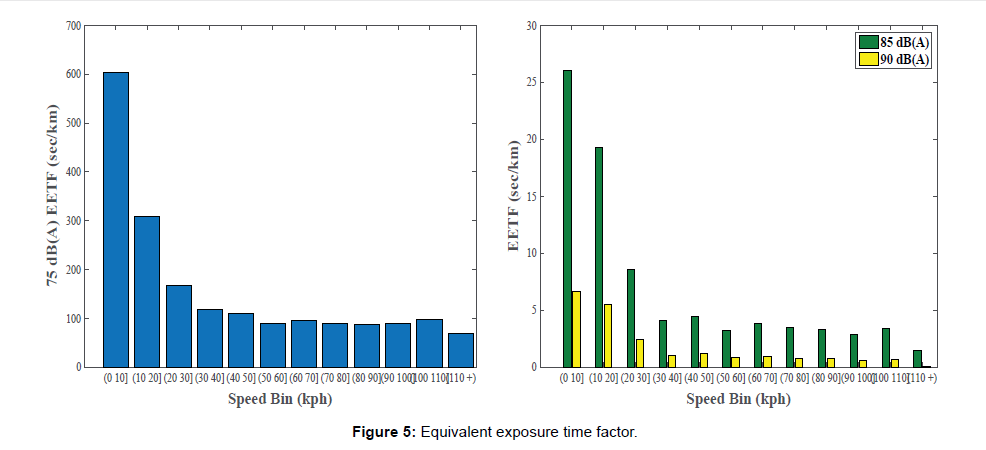
Figure 5 illustrates the EETF for the three thresholds. As a whole, the EETF at the lowest speed bin 0-10 is the highest with about 600 s/ km for 75 dB(A), 27 s/km for 85 dB(A) and 7 s/km for 90 dB(A). The EETFs decrease significantly to 110 s/km, 4 s/km and 2.5 s/km for the three thresholds at the speed bin 30-40, respectively. Though previous section demonstrates that the hazardous noise exposure probability at the lower driving speed bins are relatively lower than at the higher speed bins, the lower driving speed results in longer exposure time per km traveled.
75 dB(A) EETF (b) 85 and 90 dB(A) EETF
Time weighted average daily noise level
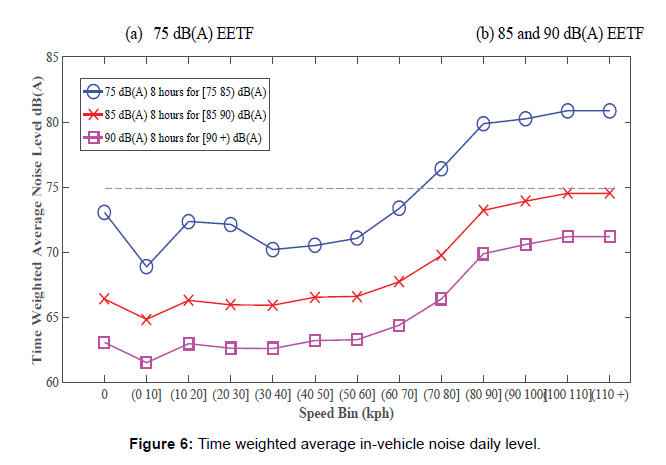
The noise levels that are higher than the three thresholds were converted to their corresponding TWA noise level for 8 h exposure. Figure 6 illustrates that the TWAs overall rise gradually with the increasing driving speed bins. Across the driving speedbins, the TWA for 75 dB(A) in blue is the highest, followed by the TWA for 85 dB(A) in red and 90 dB(A) in pink. The TWAs for 85 dB(A) and 90 dB(A) on highway are up to 75 dB(A) and 72 dB(A), respectively, which are obviously far to the saturated levels. Therefore, the probability of permanent damage to hearing sensitivity is considerably lower. Nevertheless, the TWA for 75 dB(A) is greater than the threshold, when the driving speed increase to 70 kph above. In other words, driving at higher speed can lead to exceed the public health and welfare marginal safe noise limit.
Conclusion
An on-road driving test with twelve subjects was conducted on the freeway SH 288 in Houston Texas, USA. During the driving test, invehicle noise levels and vehicle activities were collected. Results show that the in-vehicle noise is mostly distributed at the range between 70 and 80 dB(A). The in-vehicle noise levels are sensitive to driving speeds. Among the driving speed bins, the in-vehicle noise level presents the lowest during idling and nearly idling modes, but more dispersive. Besides, test drivers were more likely to be exposed to the noise level between 75 dB(A) and 85 dB(A). Driving at the lower speeds leads to the longer hazardous noise exposure time per unit traveled distance. Moreover, the TWA noise levels rise with the increasing driving speed. The TWA noise levels of 85 and 90 dB(A) on the highway are far to the corresponding saturated levels cross the speed bins, whereas the TWA noise level of 75 dB(A) at the driving speed of 70 kph above exceeds the public health and welfare marginal safe limit. Therefore, it is concluded that, commuters are chronically exposed to in-vehicle noise at the level between 75 dB(A) and 85 dB(A) on highways, which can cause negligible risk of hearing impairment.
Acknowledgement
The authors acknowledge that this research is supported in part by the National Science Foundation (NSF) under grants #1137732. The opinions, findings, and conclusions or recommendations expressed in this material are those of the author(s) and do not necessarily reflect the views of the funding agencies.
References
- Li Q, Qiao F, Yu L (2015) Testing of in-vehicle noises when driving on freeways with different pavement types. Proceedings of the 108th Air and Waste Management Association (AWMA). Raleigh, North Carolina, USA.
- Stansfeld S, Haines M, Brown B (2000) Noise and health in the urban environment. Rev Environ Health 15: 43âÂ?Â?82.
- Guidelines for Community Noise, Geneva: World Health Organization (2000).
- Noise Induced Hearing Loss (NIHL) (2015) Dangerous decibels focuses on noise-induced hearing loss.
- National Institute on Deafness and Other Communication Disorders (1999) Noise-induced hearing loss.
- Environmental Protection Agency (1974). Information on levels of environmental noise requisite to Protect public health and welfare with an adequate margin of safety, EPA, Washington DC.
- Occupational Safety and Health Administration. Regulations (standars-29 CFR).
- Juis CD, Putra A (2011) On a simple technique to measure the airborne noise in a motor vehicle using source substitution. Hari Penyelidikan Fakulti Kejuruteraan Mekanikal, Unviersiti Tecknikal Malaysia Melaka.
- Harrison M (2004) Vehicle refutenment. Controlling Noise and Vibration in Road Vehicle. Burlington.
- Thompson DJ, Dixon J (2004) Vehicle noise Chapter 6 in advanced in acoustics. Noise and Vibration, Spon Press.
- Johnson DL (1999) Exposure criteria, occupational exposure levels.
- United States Census Bureau (2016). Average commute times.
- Dooley E (2015) HereâÂ?Â?s how much time americans waste in traffic.
- Li Q, Qiao F, Yu L (2016) Impacts of pavement types on in-vehicle noise and human health. J Air Waste Manag Assoc 66: 87-96.
- Li Q, Qiao F, Yu L (2016) Impacts of traffic signal coordination on in-vehicle noise along an arterial road: A case study in Houston, USA. Proceedings in the 11th Asia Pacific Transportation Development Conference and 29th ICTPA Annual Conference, Hsinchu, Taiwan.
- Miyara F (2016) Guidelines for an urban noise ordinance.
Relevant Topics
Recommended Journals
Article Tools
Article Usage
- Total views: 9052
- [From(publication date):
January-2017 - Apr 04, 2025] - Breakdown by view type
- HTML page views : 7968
- PDF downloads : 1084

