Research Article Open Access
Removal of Fluoride from Aqueous Solution Using Chitosan-Iron Complex
Patnaik S2, Mishra PC1*, Nayak RN3 and Giri AK1
1PG Department of Environmental Sciece, Fakir Mohan University, Balasore, Odisha, India3
2Research Scholar of CUTM, Odisha
3Department of Chemistry, CUTM, Paralakhemundi, Gajapati, Odisha, India
- *Corresponding Author:
- Mishra PC
PG Department of Environmental Sciece
Fakir Mohan University
Balasore-756 020, Odisha, India.
E-mail: drprakashnitr@gmail.com
Received date: June 07, 2016; Accepted date: June 27, 2016; Published date: July 01, 2016
Citation: Patnaik S, Mishra PC, Nayak RN, Giri AK (2016) Removal of Fluoride from Aqueous Solution Using Chitosan-Iron Complex. J Anal Bioanal Tech 7:326. doi:10.4172/2155-9872.1000326
Copyright: © 2016 Patnaik S, et al. This is an open-access article distributed under the terms of the Creative Commons Attribution License, which permits unrestricted use, distribution, and reproduction in any medium, provided the original author and source are credited.
Visit for more related articles at Journal of Analytical & Bioanalytical Techniques
Abstract
In this study highly efficient sorbent, chitosan-Fe3+ complex with high chemical stability material was synthesized and the performance towards Fluoride adsorption was evaluated by batch experiments. The adsorption process reached equilibrium at 1 hour. The maximum adsorption capacity reached 2.34 mg/g of F- at an initial concentration of 50 mg/L of F- and adsorbent dosage of 10 g/L. Moreover, no significant change in the fluoride removal efficiency was observed in the pH range of 3.0-10.0. The adverse influence of sulphate on fluoride removal was the most significant, followed by bicarbonate and nitrate, whereas chloride had slightly adverse effect. Adsorption process followed the pseudo-second-order kinetic model, and the experimental equilibrium data were fitted well with the Langmuir-Freundlich and D-R isotherm models. Thermodynamic parameters revealed that fluoride adsorption was a spontaneous and exothermic process. The chitosan-Fe3+ complex could be effectively regenerated by NaCl solution.
Keywords
Fluoride; Chitosan-Fe3+ complex; Adsorption; Regeneration
Introduction
Fluoride toxicity is characterized by a variety of signs and symptoms. Poisoning most commonly occurs immediately after ingestion (accidental or intentional) of fluoride containing products. Symptom onset usually occurs within minutes of exposure. Fluoride related health hazards (fluorosis) are a major environmental problem in many regions of the world. Literature review revealed that India is among the 25 nations around the globe, where health problem occurs due to the consumption of fluoride contaminated water. In India, seventeen states have been identified as epidemic for fluorosis and Odisha is one of them. The fluoride contamination in Odisha is wide spread, where ten districts out of thirty have excess of fluoride in ground water. Fluoride present in the drinking water can have beneficial as well as detrimental effect depending on its cocentration and total amount ingested [1]. Excess of fluoride (>1.5 mg/L) in drinking water is harmful to the human health [2]. The physiological effects of fluoride upon human health have been studied sice the eaRLy part of 20th century. Several reports and studies [3] established both the risk of high fluoride dosing and the benefits of minimal exposure [4,5]. A low dose of fluoride is deemed responsible for inhibiting dental caries while a higher daily dose is linked to permanent tooth and skeletal fluorosis [6]. Various treatment technologies, based on the principle of precipitation [7], ion exchange, electrolysis, membrane and adsorption process have been proposed and is tested for removal efficiency [8-12]. Among these methods, adsorption has been found to be superior to other techniques for fluoride removal based on initial cost, flexibility and simplicity of design, and ease of operation and maintenace. A large number of adsorbents have been studied for the removal of fluoride ions, including polycinnamamide thorium (IV) phosphate, activated alumina, calcite, fly ash, charcoal, ambeRLite resin and layered double hydroxides [13-19]. Among these adsorbents, activated alumina seems to be widely used because of its efficiency and low cost. However, the main disadvantage of activated alumina is its residual aluminum and soluble aluminum fluoride complexes, the generation of sludge and narrow available pH range (5-6). In addition, most of these materials are available only as fine powders that are difficult to separate from liquid after adsorption. Studies on ion exchange [20-22] and the membrane processes such as reverse osmosis, nanofiltration, electrodialysis etc. [23-26] have also been reported in literatures. The most commonly adopted method in India, Nalgonda technique of community defluoridation is based on precipitation process [27]. The major limitations of Nalgonda technique were daily addition of chemicals, large amount of sludge production, least effective with water having high total dissolved solid and hardness. Moreover it converts a large portion of soluble ionic fluoride into soluble aluminum complex and practically removes only a small portion of it (18-33%) [27]. Residual aluminum ranging from 2.01 to 6.86 mg/L was also reported in Nalgonda technique [28], which is dangerous to human health as aluminum is a neurotoxin, cocentration as low as 0.08 mg/L in drinking water has been reported to cause Alzheimer’s disease [29-31] and is a strong carcinogenic agent [32-35]. Nowadays, technology is devoted to the development of new materials which are able to satisfy the specific requirements in terms of both the structural and functional properties.
Chitosan, a natural product derived from deacetylation of the polysaccharide chitin, had received vast interests due to its excellent properties, such as abundant source, non-toxicity, biodegradability and adsorption properties [36]. Chitosan containing enormous free amino and hydroxyl groups had the ability to coordinate with many transition metal ions through a chelation mechanism [37]. Chitosan- Fe3+ complexes prepared by different approaches had successfully employed to adsorb textile dye [38], Cr (VI) [39], phosphate [40], As (III) [41], As (III) and As (V) [42]. However, there were few reports for using the chitosan-Fe3+ complex as an adsorbent to remove Fluoride from aqueous solution. To verify the feasibility of the chitosan-Fe3+ complex for the Fluoride removal, Fluoride adsorption performace was evaluated by investigating the effect of adsorbent dosage, initial Fluoride cocentration, contact time, pH and co-existing ions on the Fluoride removal in this study. Adsorption isotherm and adsorption kinetics were studied to reveal the Fluoride adsorption mechanism of the chitosan-Fe3+ complex. Furthermore, desorption studies were also conducted to evaluate the reusability of adsorbent.
Materials and Methods
Materials
All the chemicals used are of Analytical Grade Reagent (AR) grade. Sample solutions were prepared by dissolving the sodium fluoride obtained from Merck in double distilled deionized water. 100 mL of the ion solution of known initial cocentration (2.5 mg/L, 5 mg/L, 7.5 mg/L, 10 mg/L, 25 mg/L, 50 mg/L, 100 mg/L) was prepared.
Adsorbents
Prawn shell waste was obtained from Chilika Lake, Odisha, India. Chitosan was prepared from air-dried prawn shell waste that was first chopped by a mortar. Chitin was isolated from prawn shell using the standard Hackman method. Chitosan was prepared by deacetylation of purified chitin according to the methodology followed by Muzzarelli [43]. The prawn shells soaked in a 5% HCl solution for one hour at room temperature to remove calcium salt. After being washed in water to remove HCl, the shells were soaked in 50% NaOH solution at 90°C for one hour to cause deacetylation. Protein was also removed by the foregoing NaOH treatment, after which the shells were rinsed in water, the pH was adjusted to neutral by HCl, and then the chitosan were air dried. Chitosan powder (9.0 g) was dissolved in 0.2 M FeCl3 aqueous solution (300 mL), and then stirred at room temperature for 1.5 h. Subsequently, the resulting chitosan-Fe3+ solution was added drop wise into ammonia solution (12.5% v/v) using a disposable syringe. After stabilized for 1.0 h, the spherical hydrogel beads formed were separated and sufficiently washed with deionized water, then dried at 50°C for 7.5 h. The dried beads were immersed in deionised water (liquid-solid ratio of 10 mL/g) at 40°C for 4 h in a horizontal shaker. The swelling effect occurred during the immersion, which would contribute to improving adsorbent surface property and promoting adsorption capacity. After separation, washing and drying, the chitosan-Fe3+ complexes were obtained, and then stored in sealed plastic jars at room temperature for further study. The chitosan beads were prepared to compare the fluoride adsorption capacity with the chitosan - Fe3+ complex.
Batch experiments
100 mL of fluoride solution was poured in 250 mL conical flasks for batch experiments, which were sealed and agitated at 140 rpm in a thermostatic shaker at 25°C for 1.5 h.
Fluoride adsorption experiments: 100 mL of fluoride solution was poured in 250 mL conical flasks for batch experiments, which were sealed and agitated at 140 rpm in a thermostatic shaker at 25°C for 1.5 h. The solution pH was adjusted with 0.1 M HCl or 0.1 M NaOH to obtain the desired pHs. A pH buffer was not used to avoid potential competition of buffer with fluoride sorption. One sample of the same cocentration solution without adsorbent (blank) was also treated under same conditions as the samples containing the adsorbent and was used to establish the initial cocentration of the samples. The solutions were placed in a shaker for a fixed time, followed by filtration to remove the adsorbent. The filtrate was then analyzed for the final cocentration of fluoride using Orion ion selective electrode and Orion 720 A+ ion analyzer. Adsorption capacity of the chitosan-Fe3+ complex was calculated at equilibrium using the following equation [13]:
q=[Ci-Cf)V]/M (1)where, q (g/g) is the solid phase cocentration, Ci (g/L) is the initial cocentration of fluoride in solution, Cf (g/L) is the final cocentration of fluoride in treated solution; V (L) is the volume of the solution, and M (g) is the weight of the chitosan - Fe3+ complex.
Kinetic experiments: Adsorption kinetics was examined with various initial cocentrations at 25°C. These studies were performed at adsorbent dosage of 20 g/L. Kinetic studies were carried out at different fluoride cocentrations (20, 50 and 100 mg/L of F-) at certain intervals (5, 10, 15, 20, 25, 35, 45, 60, 90 and 120 min). Isotherm studies were performed at different initial cocentrations (20, 30, 40, 50, 75,100, 120, 150, 180 and 200 mg/L of F-).
To determine the reaction rate constants of fluoride adsorption onto chitosan – Fe+3 Complex, both the pseudo-first-order and pseudosecond- order models were used. Kinetics of the pseudo-first-order model can be expressed as:
ln (qe-qt)=ln qe-k1t (2)
Where, k1 (min−1) is the rate constant of pseudo-first-order adsorption, qt (mg/g) is the amount of fluoride adsorbed at time t (min), and qe (mg/g) is the amount of adsorption at equilibrium. The model parameters k1 and qe can be estimated from the slope and intercept of the plot of ln(qe−qt) vs t. The pseudo-second-order model can be expressed as follow [44]:
t/qt=(t/qe+1/K2qe2) (3)
Where, K2 (g/mg per minute) is the pseudo-second-order reaction rate. Parameters K2 and qe can be estimated from the intercept and slope of the plot of (t/qt) vs t.
In order to investigate the effect of co-existing ions, anions (Cl-, HCO3 -, NO3 - and SO42-) were added at every anion cocentration of 4 mmol/L, and cations (K+, Na+, NH4+, Ca2+, Mg2+) were added by fixing a chloride ion cocentration at 4 mmol/L.
Isotherm models: Adsorption isotherms such as the Freundlich or Langmuir models are commonly utilized to describe adsorption equilibrium. The Freundlich isotherm model is represented mathematically as:
qe=kf Ce1/n (4)
Where, qe (mg/g) is the amount of fluoride adsorbed, Ce is the cocentration of fluoride in solution (g/L), kf and 1/n are parameters of the Freundlich isotherm, denoting a distribution coefficient (L/g) and intensity of adsorption, respectively. The Langmuir equation is another widely used equilibrium adsorption model. It has the advantage of providing a maximum adsorption capacity qmax(mg/g) that can be correlated to adsorption properties. The Langmuir model can be represented as:
qe=qmax [(KLCe)/(1+KLCe)] (5)
Where, qmax(mg/g) and KL (L/mg) are Langmuir constants representing maximum adsorption capacity and binding energy, respectively.
Analysis
The cocentration of F- was determined by Orion ion selective electrode and Orion 720 A+ ion analyzer. Total ionic strength adjusting buffer solution was added to both samples and standards in the ratio 1:10. The electrode is selective for the fluoride ion over other common anions by several orders of magnitude. The surface morphology was observed with a scanning electron Microscope (SEM) (SSX-550, Shimadzu, Japan). FTIR spectra of chitosan beads and the chitosan-Fe3+ complex before and after fluoride adsorption were recorded on a Fourier transform infrared spectrometer using KBr pellets over the wave number range of 4000-400 cm-1 with a resolution of 4 cm-1 (SPECTRUM RX-I). The ratio of the sample to KBr was 1:50 and the pellet was prepared at a pressure of 5 Ton. Scanning electron micrographs of the sample was obtained by JEOL JSM-6480LV scanning electron microscope. The sample was coated with platinum for 30 s at a current of 50 mA before the SEM micrograph was obtained.
Results and Discussion
Characterization of chitosan-Fe3+ complex
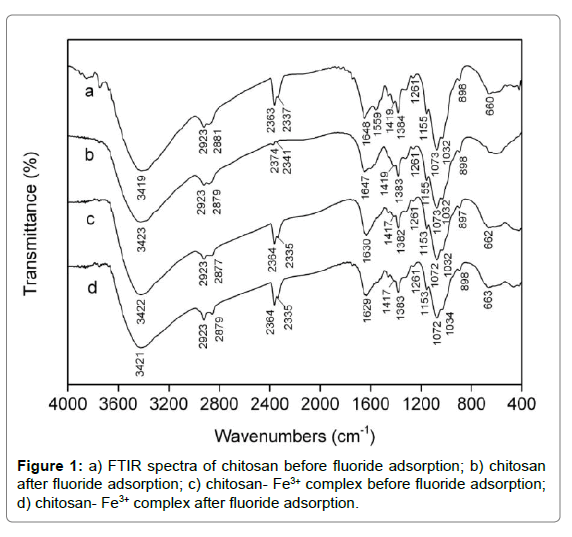
FTIR: The FTIR spectra were analyzed to identify the vital functional groups accounting for the nature of fluoride adsorption. The broad and intense adsorption band at approximately 3419 cm-1 for the spectrum of pristine chitosan (curve in Figure 1) was ascribed to intermolecular hydrogen bonds and the oveRLap between O–H and N–H stretching vibration. The characteristic peaks at 2923 and 2881 cm-1 were assigned to C–H stretching vibration of –CH2 and –CH3 aliphatic groups, respectively [45,46]. Two new peaks appeared at 2337 and 2363 cm-1 were attributed to the amino protonation of –NH2 and –NHCOCH3 group. The peak at 1648 and 1559 cm-1 referred to C=O stretching vibration of acetyl group and the stretching vibration of amine group, respectively. The peaks at 1155, 1032, 1419 and 1384 cm-1 were related to C–O–C stretching vibration and C–H symmetric bending vibration, separately. It had been reported that the characteristic peak of fluoride existed at around 1384 cm-1 [47,48]. The peak at 1261 and 1073 cm-1 corresponded to the stretching vibration of C–O in chitosan molecule on C-3 and C-6 position, respectively. It was observed that C–H out-ofplane bending vibration and N–H wagging vibration occurred at ca. 898 and 660 cm-1 [49]. It was cleaRLy seen from the curve b in Figure 1 that the peaks at 1559 and 660 cm-1 disappeared for chitosan after reaction, and the transmittaces at 2374 and 2341 cm-1 sharply increased due to the occurrece of dipole moment change compared with original chitosan, which implied that the interaction did occur between fluoride ions and protonated amine groups. Moreover, it was observed from the curve c and d in Figure 1 that there were few changes as to the FTIR spectra of chitosan- Fe3+ complex before and after fluoride adsorption, indicating no new chemical bond appeared between fluoride ions and the chitosan- Fe3+ complex.
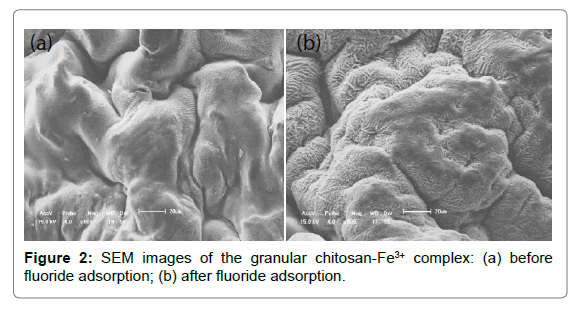
SEM: SEM images of chitosan - Fe3+ complex before and after fluoride adsorption were shown in Figure 2. It was evident that the chitosan- Fe3+ complex possessed poorly developed pore and extremely heterogeneous surface morphology, which were partially attributed to the uneven volatilization of ammonia and water molecule on the chitosan - Fe3+ hydrogel beads surface during desiccation. The irregular surface with fingerprint-like textures increased specific surface area and thereby provided more active sites for fluoride adsorption. Adsorbent surface before fluoride adsorption was observed at a compact gel state, while adsorbent surface after fluoride adsorption had higher surface roughness. This phenomenon was due to the occurrece of swelling effect of the chitosan- Fe3+ complex in the process of fluoride adsorption.
Effect of adsorbent dosage
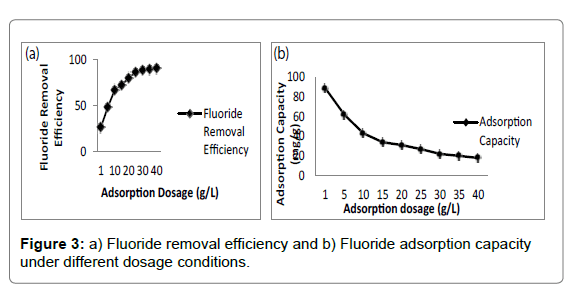
Adsorbent dosage was a vital parameter influencing adsorption capacity and effluent cocentration [46]. The effect of adsorbent dosage on fluoride removal was depicted in Figure 3a and 3b. It was evident that the fluoride removal efficiency increased from 27.6% to 90.4% with the increase in adsorbent dosage from 2 to 40 g/L. The increment was ascribed to availability of more active sites and larger surface area at higher dosage [50]. However, the equilibrium adsorption capacity of adsorbent decreased from 6.99 to 1.15 mg/g for fluoride, which was due to the fact that the increase in adsorbent dosage for a given amount of fluoride resulted in unsaturation of adsorption sites [51]. Moreover, it was found that further increase in dosage beyond 20 g/L rarely affected adsorption capacity of adsorbent. Adsorption capacity of the chitosan-Fe3+ complex reached 2.04 mg/g for Fluoride compared with the chitosan- Fe3+ complex (1.38 mg/g for F-) that was not immersed in deionized water.
Effect of pH
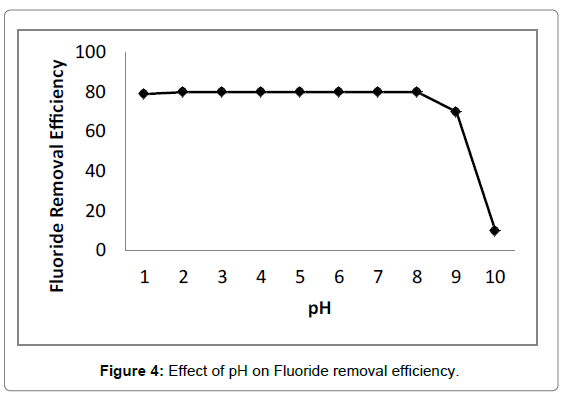
The pH of solution affected not only surface charges and dissociation of functional groups, but also chemical speciation and diffusion rate of solute [52,53]. The influece of initial pH on fluoride removal was illustrated in Figure 4. It was observed that no significant change occurred in terms of fluoride removal efficiency exceeding 80% in the pH range of 3.0-10.0, indicating adsorption process was almost independent of initial pH. Moreover, adsorption capacity of chitosan- Fe3+ complex (2.04 mg/g for fluoride) was superior to chitosan (1.95 mg/g for Fluoride) at an initial cocentration of 50 mg/L Fluoride and adsorption dosage of 20 g/L, implying electrostatic attraction between negatively charged fluoride ions and positively charged anime groups of chitosan was not a unique mechanism of fluoride removal [54]. However, the free amine groups of chitosan could not be protonated at alkaline medium, which did not facilitate electrostatic attraction. Anion was proposed to be adsorbed on adsorbent through nonspecific adsorption including electrostatic attraction or specific adsorption involving ion exchange [55]. For this reason, ion exchange mainly occurred between exchangeable chloride ions of adsorbent and fluoride ions in alkaline solution, which was consistent with the results of D-R isotherm model.
The sharp decrease in fluoride removal efficiency appeared when initial pH exceeded 11.0, which was probably ascribed to the competition between hydroxide and fluoride ions for adsorption sites and the increase in diffusion resistace of fluoride caused by abundant hydroxide ions [55,56]. In addition, the final pH of solution was located between 5.0 and 6.0, indicating the chitosan- Fe3+ complex had buffer capacity in the pH range of 3.0-10.0.
Effect of co-existing ions
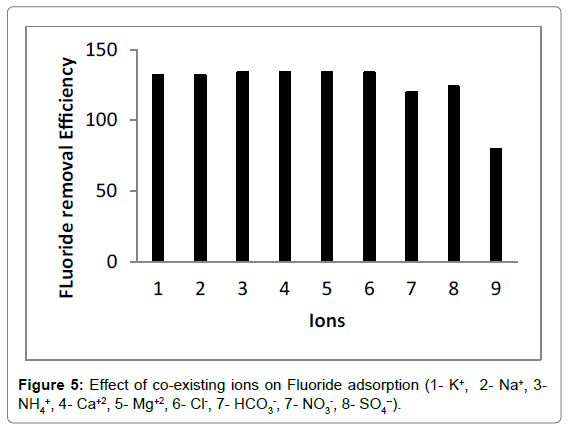
The fluoride-contaminated water generally contained a series of chemical compositions, which could exert a negative influece on adsorption process. Consequently, it was extremely important to explore the effect of co-existing ions on fluoride removal in binary component solution. As shown in Figure 5, anions presenting in fluoride solution had a detrimental effect on adsorption process, resulting in the decrease in fluoride removal efficiency. The adverse influece nitrate on fluoride removal was the most significant, followed by bicarbonate and sulphate, whereas chloride had slightly adverse effect. These anions occupied adsorption sites on the adsorbent surface and increased electrostatic repulsion between the chitosan- Fe3+ complex and fluoride ions, leading to the decrease in fluoride removal efficiency. Wan et al. [57] pointed out that multivalent anion with higher charge density was adsorbed more readily than monovalent anion. Thus, the chitosan- Fe3+ complex had a greater affinity for fluoride ions compared with other anions. On the other hand, the fluoride removal efficiency had no distinct differece among five cations, implying these cations did not disturb fluoride adsorption. The decrease in fluoride removal efficiency was caused by the competition between fluoride and chloride ions for adsorption sites.
Effect of initial fluoride cocentration and adsorption isotherm
In the present study, adsorption capacity increased dramatically from 0.90 to 4.62 mg/g of F- with the increase in initial F- cocentration, because higher cocentration gradient acting as a driving force overcame mass transfer resistace between bulk solution and adsorbent surface [58]. Few sufficient adsorption sites accommodated fluoride ions for a certain amount of adsorbent when fluoride content exceeded a certain cocentration, resulting in the decrease in removal efficiency from 93.1% to 47.1% with the increase in initial cocentration from 20 to 200 mg F- L-1. Adsorption isotherm models were commonly used to predict maximum adsorption capacity, which helped to realize how optimized an adsorption system. The mutual correlation of adsorption capacity and equilibrium cocentration was investigated by fitting experimental data using the Langmuir [41], Freundlich [38], Langmuir – Freundlich [54] and Dubinin-Radushkevich [59] isotherm models, respectively. The nonlinear forms of these models were given as:
qe=(qmKLCe)/(1+KLCe) (6)
qe=(kfCe 1/n) (7)
qe=(qekf-LCe m)/(1+kf-LCem) (8)
qe=[qm exp(- βε2)=qm exp(-β [RT ln(1+1/Ce)]2 (9)
Where, qe (mg/g) is the calculated adsorption capacity at equilibrium according to Eq.1, Ce (mg/L) is the equilibrium fluoride cocentration, KL (L/mg) is the Langmuir constant, qm (mg/g) is the fitting maximum adsorption capacity, kf ((mg/g) (L/mg)1/n) is the Freundlich constant related to adsorption capacity, n is an empirical parameter related to adsorption intensity, kF-L (L/mg) is the Langmuir- Freundlich adsorption constant, m is the heterogeneity factor, β (mol2/ kJ2) is a constant related to the adsorption energy, ε (kJ/mol) is Polanyi potential, R (8.314 J/mol/K) is the universal gas constant, T (K) is the temperature in Kelvin. The corresponding information was shown in Table 1.
| Langmuir | Freundlich | Langmuir-Freundlich | Dubinin-Radushkebbich | ||||
|---|---|---|---|---|---|---|---|
| qm(mg/g) | 4.99 | KF[(mg/g)(L/mg)1/n] | 0.89 | qm(mg/g) | 8.30 | qm (mg/g) | 9.25 |
| KL(L/mg) | 0.071 | n | 2.72 | KL-F (L/mg) | 0.089 | ß (molK/J2) | 4.6×10⁻⁵ |
| R2 | 0.973 | R2 | 0.992 | R2 | 0.997 | R2 | 0.998 |
Table 1:Analysis of constants of the Langmuir, Freundlich, Langmuir-Freundlich and D-R isotherm models.
The essential feature of Langmuir isotherm could be conveyed by a dimensionless constant separation factor (RL), which was defined as [54]:
RL=1/(1+KLC0) (10)
It was generally stated that the RL value with the range 0<RL<1 indicated favorable, while the n value in the range from 2 to 10 represented good [60]. It was obvious that the calculated RL and n values in this study were 0.24 and 2.82, respectively, suggesting fluoride adsorption on the chitosan-Fe3+ complex was favorable. It was difficult to decide which isotherm was better fitted with the experimental data because the R2 values exceeded 0.96 for the first three isotherm models. Additionally, the m value of Langmuir- Freundlich isotherm was not more than 1. These results indicated fluoride adsorption on chitosan- Fe3+ complex was a multilayer adsorption.
Adsorption kinetics
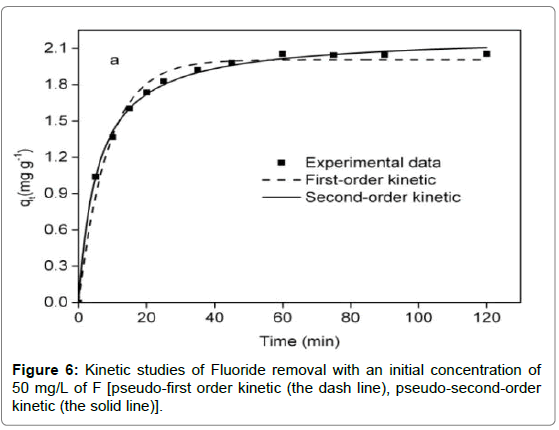
In order to accurately reflect the variation trend of fluoride cocentration with time and reveal the reaction pathway of adsorption process, several kinetic models were employed to examine the experimental data. The nonlinear pseudo-first-order and pseudosecond- order kinetic models were expressed as follows [46]:
qt=qe(1-e-k 1t) (11)
qt=(qe2K2t)/(1+qeK2t) (12)
Where, qe (mg/g) and qt (mg/g) represent the amount of fluoride adsorbed at equilibrium and at time t, respectively, k1 (min-1) and K2 (g/ mg/min) denote the pseudo-first-order and pseudo-second-order rate constants, separately, t (min) is the contact time.
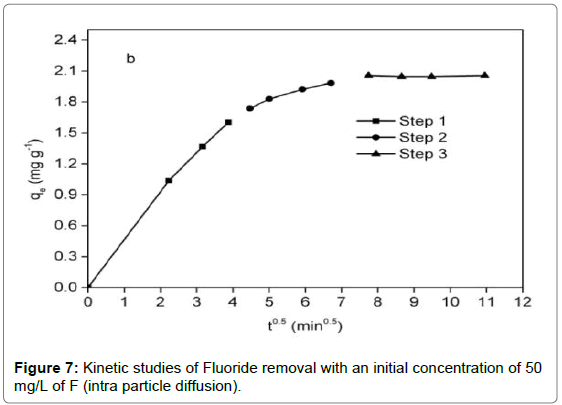
In addition, the intra particle diffusion model [47] was utilized to predict whether intraparticle diffusion was rate-determining step, which was given as:
qt=Kp.t0.5+C (13)
Where kp (mg/g min-0.5) is the intra particle diffusion rate constant, C (mg g-1) is the intercept related to the thickness of the boundary layer.
It was observed from Figure 6 that adsorption reaction was rapid in the first 15 min, followed by a sluggish stage until equilibrium. The equilibrium time of the chitosan-Fe3+ complex (1.5 h) was inferior to that of chitosan hydrogel beads (10 h) [35] and organoclay (4 h) [1]. Compared with the pseudo-first-order kinetic, it was evident from Table 2 that the pseudo-second-order kinetic was fitted well with the experimental data in terms of correlation coefficient. For the intra particle diffusion model (Figure 7), three segments of straight line could perfectly match a fitting curve of qt versus t0.5, implying intra particle diffusion was not an exclusive rate-determining step.
| Pseudo-first-order | Pseudo-second-order | Intraparticle diffusion | |||||
|---|---|---|---|---|---|---|---|
| qe (mg/g) | 2.00 | qe(mg/g) | 2.18 | kp1 (mg/g/min-0.5) |
0.416 | kp2 (mg/g/min-0.5) |
0.107 |
| k1(min-1) | 0.114 | k2(g/mg/min) | 0.080 | C1(mg/g) | 0.030 | C2(mg/g) | 1.26 |
| R2 | 0.987 | R2 | 0.997 | R2 | 0.990 | R2 | 0.962 |
Table 2: Kinetic constants for adsorption of fluoride on the chitosan-Fe3+complex.
Regeneration
High adsorption capacity and good reusability were of utmost importace for any adsorbent, which would significantly promote economic value of adsorption method. In the present study, desorption efficiencies of 0.1 M NaCl, 0.1 M NaOH and 0.1 M Na2SO4 solution were found to be 84.3%, 95.3% and 93.8%, respectively. Consequently, the chitosan-Fe3+ complex was better than layered double hydroxide whose desorption efficiency was less than 2% [61]. It was evident that these desorption reagents could efficiently regenerate the chitosan- Fe3+ complex based on ion exchange reaction, which conduced to recovering fluoride from fluoride-contaminated water. However, when the regenerated chitosan-Fe3+ complex was firstly applied to adsorb fluoride, fluoride removal efficiencies were 78.1%, 0.8% and 22.5% for NaCl, NaOH and Na2SO4 solution, respectively. These results were explained by the fact that hydroxide and sulphate ions irreversibly occupied adsorption sites during regeneration, and thereby available adsorption sites for the first reuse significantly decreased. Moreover, fluoride removal efficiency slightly decreased from 78.1% to 76% undergoing four circles using 0.1 M NaCl solution as the eluent, indicating there were few irreversible adsorption sites on adsorbent surface [13]. Therefore, NaCl was a promising desorption reagent.
Conclusion
The synthesized chitosan-Fe3+ complex had high performace for fluoride adsorption. The maximum adsorption capacity reached 2.34 mg/g Fluoride at an initial cocentration of 50 mg/L of fluoride and adsorbent dosage of 10 g/L. The chitosan- Fe3+ complex had relatively large particle size (1.04-1.16 mm) and short equilibrium time (1.5 h). Adsorption process infrequently suffered from initial pH and temperature, reflecting high chemical stability and good environmental abatement. The adverse influece of sulphate ions on fluoride adsorption was more significant compared with other anions, while common cations rarely interfered with fluoride adsorption. The chitosan - Fe3+ complex could be regenerated using NaCl solution.
References
- Kanbur M, Eras lan G, Silici S, Karabacak M(2009)Effects of sodium fluoride exposure on some biochemical parameters in mice: Evaluation of the ameliorative effect of royal jelly applications on these parameters. Food ChemToxicol 47: 1184-1189.
- Tsai WT (2009) Environmental hazards and health risk of common liquid perfluoro-n-alkanes, potent greenhouse gases. Environ Int 35: 418-424.
- Hichour M, Persin F, Sandeaux J, Gavach C(2000)Fluroide removal from waters by Donnan dialysis. Sep PurifTechnol 18: 1-11
- Susheela AK(2001) Treatise on Fluorosis, Fluorosis Research and Rural Development Foundation, India. Fluoride 34: 181-183.
- Mousny M, Omelon S, Wise L, Everett ET, Dumitriu M, et al. (2008) Fluoride effects on bone formation and mineralization are influenced by genetics. Bone 43: 1067-1074.
- Mahramanlioglu M, Kizilcikli I, Bicer IO(2002) Adsorption of fluoride from aqueous solution by acid treated spent bleaching earth. J Fluorine Chem 115: 41-47.
- Islam M, Patel RK (2007) Evaluation of removal efficiency of fluoride from aqueous solution using quick lime. J Hazard Mater 143: 303-310.
- Lin C, Hai-Xia W, Ting-Jie W, Yong J, Yu Z, et al.(2009) Granulation of Fe–Al–Cenano-adsorbent for fluoride removal from drinking water by spray coating on sand in a fluidized bed. Powder Technol 193: 59-64.
- Wu X, Zhang Y, Dou X, Yang M (2007) Fluoride removal performance of a novel Fe-Al-Cetrimetal oxide adsorbent. Chemosphere 69: 1758-1764.
- Yaping Z, Xiuyan L, Lu L, Fuhua C(2008) Fluoride removal by Fe(III)-loaded ligand exchange cotton cellulose adsorbent from drinking water. CarbohydrPolym 72: 144-150.
- Venkata Mohan S, Ramanaiah SV, Rajkumar B, Sarma PN(2007) Removal of fluoride from aqueous phase by biosorption onto algal biosorbent Spirogyra sp.-IO2: Sorption mechanism elucidation. J Hazard Mater 141: 465-474.
- Ramanaiah SV, Venkata Mohan S, Sarma PN(2007) Adsorptive removal of fluoride from aqueous phase using waste fungus (Pleurotusostreatus 1804) biosorbent: Kinetics evaluation. Eco Eng31: 47-56.
- Yang CY, Dluhy R (2002) Electrochemical generation of aluminum sorbent for fluoride adsorption. J Hazard Mater 94: 239-252.
- Ghorai S, Pant KK(2005) Equilibrium, kinetics and breakthrough studies for adsorption of fluoride on activated alumina. Sep PurifTechnol 42: 265-271.
- Fan X, Parker DJ, Smith MD (2003) Adsorption kinetics of fluoride on low cost materials. Water Res 37: 4929-4937.
- Abe I, Iwasaki S, Tokimoto T, Kawasaki N, Nakamura T, et al. (2004) Adsorption of fluoride ions onto carbonaceous materials. J Colloid Interface Sci 275: 35-39.
- Teng SX, Wang SG, Gong WX, Liu XW, Gao BY (2009) Removal of fluoride by hydrous manganese oxide-coated alumina: performance and mechanism. J Hazard Mater 168: 1004-1011.
- Ghorai S, Pant KK(2005) Equilibrium, kinetics and breakthrough studies for adsorption of fluoride on activated alumina. Sep PurifTechnol 42: 265-271.
- Meenakshi S, Sundaram CS, Sukumar R (2008) Enhanced fluoride sorption by mechanochemically activated kaolinites. J Hazard Mater 153: 164-172.
- Ho LN, Ishihara T, Ueshima S, Nishiguchi H, Takita Y (2004) Removal of fluoride from water through ion exchange by mesoporous Ti oxohydroxide. J Colloid Interface Sci 272: 399-403.
- Meenakshi S, Viswanathan N (2007) Identification of selective ion-exchange resin for fluoride sorption. J Colloid Interface Sci 308: 438-450.
- Ishihara T, Misumi Y, Matsumoto H(2009) Pore size control for mesoporous titanium hydroxide prepared with mixed template molecules and its fluoride ion exchange property.MicroporMesopor Mater 122: 87-92.
- Sehn P(2008) Fluoride removal with extra low energy reverse osmosis membranes: three years of large scale field experience in Finland. Desalination 223: 73-84.
- Lahnid S, Tahaikt M, Elaroui K, Idrissi I, Hafsi M, et al.(2008) Economic evaluation of fluoride removal by electrodialysis. Desalination 230: 213-219.
- Hichour M, Persin F, Molénat J, Sandeaux J, Gavach C(1999) Fluoride removal from diluted solutions by Donnan dialysis with anion-exchange membranes. Desalination 122: 53-62.
- Ruiz T, Persin F, Hichour M, Sandeaux J(2003)Modelisation of fluoride removal in Donnan dialysis. J MembrSci 212: 113-121.
- Apparao BV, Meenakshi S, Karthikayan G(1990)Nalgonada technique of defluoridation of water. Indian J Environ Protect 10: 292-298.
- Gupta SK(1997) A process for defluoridation of water by a filter bed using indigenous material. Indian J Environ Sci 1: 149-156.
- Davison AM, Walker GS, Oli H, Lewins AM (1982) Water supply aluminium concentration, dialysis dementia, and effect of reverse-osmosis water treatment. Lancet 2: 785-787.
- Crapper DR, Krishnan SS, Dalton AJ (1973) Brain aluminum distribution in Alzheimer's disease and experimental neurofibrillary degeneration. Science 180: 511-513.
- Miller RG, Kopfler FC, Kelty KC, Stobler JA, Ulmer NS(1984) The occurrence of aluminum in drinking water. J AWWA 76: 84-91.
- Martyn CN, Barker DJ, Osmond C, Harris EC, Edwardson JA, et al. (1989) Geographical relation between Alzheimer's disease and aluminum in drinking water. Lancet 1: 59-62.
- Dearfield KL, Abernathy CO, Ottley MS, Brantner JH, Hayes PF (1988) Acrylamide: its metabolism, developmental and reproductive effects, genotoxicity, and carcinogenicity. Mutat Res 195: 45-77.
- Mccollister DD, Oyen E, Rowe VK(1964) Toxicology of acrylamide, Toxicol. ApplPharmacol 6: 172-181.
- Mallevialle J, Bruchet A, Fiessinger F(1984)How safe are organic polymers in water treatment. J AWWA 76: 431-436.
- Laus R, de Fávere VT (2011) Competitive adsorption of Cu(II) and Cd(II) ions by chitosan crosslinked with epichlorohydrin-triphosphate. BioresourTechnol 102: 8769-8776.
- Qu J, Hu Q, Shen K, Zhang K, Li Y, et al. (2011) The preparation and characterization of chitosan rods modified with Fe3+ by a chelation mechanism. Carbohydr Res 346: 822-827.
- Demarchi CA, Campos M, Rodrigues CA(2013) Adsorption of textile dye Reactive Red 120 by the chitosan–Fe(III)-crosslinked: Batch and fixed-bed studies. J Environ ChemEng 1: 1350-1358.
- Zimmermann AC, Mecabô A, Fagundes T, Rodrigues CA (2010) Adsorption of Cr(VI) using Fe-crosslinked chitosan complex (Ch-Fe). J Hazard Mater 179: 192-196.
- Fagundes T, Bernardi EL, Rodrigues CA(2001) Phosphate adsorption on chitosan- Fe III-crosslinking: batch and column studies. J LiqChromatogrRelatTechnol 24: 1189-1198.
- Dos Santos HH, Demarchi CA, Rodrigues CA, Greneche JM, Nedelko N, et al. (2011) Adsorption of As(III) on chitosan-Fe-crosslinked complex (Ch-Fe). Chemosphere 82: 278-283.
- de O. Marques Neto J, Bellato CR, Milagres JL, Pessoa KD, de Alvarenga ES(2013) Preparation and evaluation of chitosan beads immobilized with Iron(III) for the removal of As(III) and As(V) from water. J BrazChemSoc 24: 121-132.
- Muzzarelli A (1973) Natural Chelating Polymers.Pergamon Press,New York, USA,pp:188-195.
- Sarkar D, Chattoraj DK(1993) Activation parameters for kinetics of protein adsorption at silica-water interface. J Colloid Interface Sci 157: 219-226.
- Ho YS, Mckay G(1999) Pseudo-second order model for sorption processes. Process Biochem 34: 451-465.
- Mostafa TB, Darwish AS(2014)An approach toward construction of tuned chitosan/polyaniline/metal hybrid nanocomposites for treatment of meat industrywastewater.ChemEng J 243: 326-339.
- Yuan P, Annabi-Bergaya F, Tao Q, Fan M, Liu Z, et al. (2008) A combined study by XRD, FTIR, TG and HRTEM on the structure of delaminated Fe-intercalated/pillared clay. J Colloid Interface Sci 324: 142-149.
- Kamari A, Pulford ID, Hargreaves JS (2011) Chitosan as a potential amendment to remediate metal contaminated soil - a characterisation study. Colloids Surf B Biointerfaces 82: 71-80.
- Sari A, Tuzen M, Soylak M (2007) Adsorption of Pb(II) and Cr(III) from aqueous solution on Celtek clay. J Hazard Mater 144: 41-46.
- Rao RA, Rehman F (2010) Adsorption studies on fruits of Gular (Ficusglomerata): removal of Cr(VI) from synthetic wastewater. J Hazard Mater 181: 405-412.
- Senturk HB, Ozdes D, Gundogdu A, Duran C, Soylak M(2009) Removal of phenol from aqueous solutions by adsorption onto organomodifiedTirebolubentonite: Equilibrium, kinetic and thermodynamic study. J Hazard Mater 172: 353-362.
- Kolodynska D(2011) Chitosan as an effective low-cost sorbent of heavy metal complexes with the polyaspartic acid.ChemEng J 173: 520-529.
- Li Y, Zhang P, Du Q, Peng X, Liu T, et al. (2011) Adsorption of fluoride from aqueous solution by graphene. J Colloid Interface Sci 363: 348-354.
- Chatterjee S, Woo SH (2009) The removal of nitrate from aqueous solutions by chitosan hydrogel beads. J Hazard Mater 164: 1012-1018.
- Ganesan P, Kamaraj R, Vasudevan S(2013) Application of isotherm, kinetic and thermodynamic models for the adsorption of nitrate ions on graphene from aqueous solution. J Taiwan InstChemEng 44: 808-814.
- Thakre D, Jagtap S, Sakhare N, Labhsetwar N, Meshram S, et al.(2010) Chitosan based mesoporous Ti–Al binary metal oxide supported beads for defluoridation of water.ChemEng J 158: 315-324.
- Wan DJ, Liu HJ, Liu RP, Qu JH, Li SS, et al.(2012) Adsorption of nitrate and nitrite from aqueous solution onto calcined (Mg-Al) hydrotalcite of different Mg/Al ratio.ChemEng J 195-196: 241-247.
- Srivastava VC, Swamy MM, Mall ID, Prasad B, Mishra IM(2006) Adsorptive 482 removal of phenol by bagasse fly ash and activated carbon: Equilibrium, kinetics 483 and thermodynamics. Colloids and Surfaces A: Physicoche. Eng Aspects 484: 89-104.
- Olgun A, Atar N, Wang SB(2013) Batch and column studies of phosphate and nitrate adsorption on waste solids containing boron impurity.ChemEng J 222: 108-119.
- Jain M, Garg VK, Kadirvelu K (2010) Adsorption of hexavalent chromium from aqueous medium onto carbonaceous adsorbents prepared from waste biomass. J Environ Manage 91: 949-957.
- Katal R, Baei MS, Rahmati HT, Esfandian H(2012) Kinetic, isotherm and thermodynamic study of nitrate adsorption from aqueous solution using modified rice husk. J IndEngChem 18: 295-302.
Relevant Topics
Recommended Journals
Article Tools
Article Usage
- Total views: 13571
- [From(publication date):
August-2016 - Jul 13, 2025] - Breakdown by view type
- HTML page views : 12348
- PDF downloads : 1223

