Research Article Open Access
Reliability and Asymmetry Profiles of Myotonometric Measurements in Healthy Skeletal Muscles
| Wing Kai Lam1, Damon Mok2, Winson CC Lee3* and Bob Chen4 | |
| 1Li Ning Sports Science Research Center, Beijing, China | |
| 2Dr BobChen Studio, Beijing, China | |
| 3Interdisciplinary Division of Biomedical Engineering, Faculty of Engineering, The Hong Kong Polytechnic University, China | |
| 4Capital University of Physical Education and Sports, Beijing, China | |
| Corresponding Author : | Winson C.C Lee Interdisciplinary Division of Biomedical Engineering Faculty of Engineering The Hong Kong Polytechnic University, China Tel: (+852)27664942 E-mail: winson.lee@polyu.edu.hk |
| Received December 13, 2014; Accepted January 12, 2015; Published January 19, 2015 | |
| Citation: Lam WK, Mok D, Lee WCC, Chen B (2015) Reliability and Asymmetry Profiles of Myotonometric Measurements in Healthy Skeletal Muscles. J Nov Physiother 5:245. doi: 10.4172/2165-7025.1000245 | |
| Copyright: © 2015 Lam WK, et al. This is an open-access article distributed under the terms of the Creative Commons Attribution License, which permits unrestricted use, distribution, and reproduction in any medium, provided the original author and source are credited. | |
Visit for more related articles at Journal of Novel Physiotherapies
Abstract
Background: Myotonometric measurement provides information about the muscle properties before and after applying physiotherapy treatments. This study examined the reliability, the degree of side-to-side symmetry, and the muscle type effect of the myotonometric parameters.
Methods: Bilateral muscle stiffness, oscillation frequency and decrement of 11 different muscles during relaxed state were measured on 14 healthy male participants using a myometer over two consecutive days. Within-day and inter-day intraclass correlation coefficients (ICC) and absolute symmetry index (ASI) of measurements on each muscle site were calculated. Comparisons were made between the two muscle types and among the different test parameters.
Results: Muscle decrement had significantly lower within-day ICC than muscle stiffness (P<.01). Compared to tonic muscles, phasic type muscles had worse within-day ICC in muscle oscillation frequency measure (P<.05). Muscle decrement (13.8%) was significantly more asymmetric than muscle stiffness (8.7%, P<.01) and oscillation frequency (8.3%, P<.01). Gastrocnemius and Tibialis Anterior muscles demonstrated the highest degree of asymmetry (>20%) in the decrement measurement.
Conclusion: Myotonometric measurements are generally reliable for clinical muscle assessment. In analyzing and interpreting myotonomeric measurements, assessing muscle asymmetries should consider if the observed difference is due to measurement errors or intervention effects when involving such parameters and muscles.
| Keywords |
| Muscle assessment; Muscle stiffness; Muscle decrement; Muscle oscillation frequency |
| Introduction |
| Myotonometric measuring devices have become increasingly popular in assessing viscoelastic properties of muscles that has application before and after applying physiotherapy treatments, because they are non-invasive, portable and easy to administer [1]. Myotonometic measurement can provide information about muscle stiffness, oscillation frequency, and muscle decrement for injury identification and status monitoring of skeletal muscles [1-4]. Changes in viscoelastic properties are usually linked to work and sports related overuse and overtraining syndromes [5]. Measurements, which do not produce consistent results, cannot be considered valid. To date, few studies have investigated the reliability of muscle stiffness, oscillation frequency, and decrement measurements [6-8]. |
| It is normal to have some asymmetry between two sides, as we tend to use muscles of the dominant side more. Racket sports players and patients with neuromuscular deficits could have even higher degree of asymmetry. The study of side-to side symmetry in muscle properties in non-professional sports players should be developed in order to evaluate the degree of asymmetry in pathologic or injury condition [8,9]. Muscles can be categorized into tonic and phasic type muscles according to their distinct functions and properties [10,11], which may be associated with the viscoelastic properties and the degree of the symmetry between both sides of healthy muscles. The objective of the present study was to comprehensively evaluate the reliability and side-to-side asymmetry in the three variables of common phasic and tonic muscles during relaxed state. Such information has application in muscle assessment when providing appropriate training and rehabilitation prescriptions. |
| Materials and Methods |
| Fourteen healthy physical active male participants took part in this study on two consecutive days. Their mean age was 29.3 ± 9.2 y, their mean height was 1.75 ± 0.06 m, and their mean body mass was 68.9 ± 8.7 kg. They were all non-professional sports players and were all right handedness, as determined using the Edinburgh Handedness Inventory [9]. Participants were required to avoid strenuous physical exercise between test sessions and to return for the second session the following day. This design aimed to minimize the fatigue effect due to episodic physical activity. Written consent was obtained from the subjects and the testing procedure was approved by the Ethical Committee of the University. |
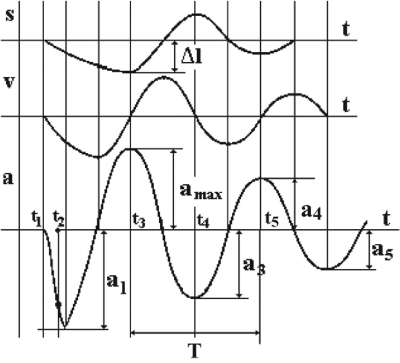
| Bilateral recordings of the mechanical properties of eleven muscle sites in relaxed state were measured using a Myometer (Myoton-3, Müomeetria AS, Tallinn, Estonia). The testing end (mass, 20 g; diameter, 3 mm) of the myometer was placed on and perpendicular to the target muscle. A mechanical impulse (force, 0.4N; period, 15 ms) was applied on the underlying tissues by the testing end to induce a minor deformation of a few millimeters on the tissue. Based on the measured characteristics of the oscillation waveform, the three variables are calculated as: |
| Stiffness (Nm-1) = amax x m/Δl |
| Oscillation frequency (Hz) = 1/T Hz |
| Logarithmic decrement (ø) = In (amax /a4) |
| where m is the mass of the myometer’s striking nozzle; a1, a3, a4, a5 are the oscillation peak amplitudes; amax is the maximal amplitude of oscillation; Δl is the deepest tissue displacement of the testing end; T is the oscillation period measured from t3 to t5 (Figure 1). |
| An identical test procedure was repeated two consecutive days for all participants. Twenty consecutive measurements were taken on the center of muscle belly for each participant Table 1, in relaxed state using a Myometer (Myoton-3, Müomeetria AS, Tallinn, Estonia). The same test locations were assessed between day 1 and 2, as confirmed by a cross marked on day 1. The same investigator performed the measurement throughout. |
| Intra-class correlation coefficients (ICC) of each muscle across all participants were computed in order to determine the reliability of each test parameter upon repeated measurements within a day and across two days. Good reliability was defined when ICC greater than 0.75, according to previous studies [7]. Asymmetries in muscle parameters were examined using absolute symmetry indexes (ASI). The ASI was determined as the absolute difference between left and right sides divided by the mean of left and right sides for each muscle. |
| T-test was performed to investigate if there were any significant differences between phasic and tonic muscles in terms of reliability and ASI in each of the myotonometric parameters, while averaging all data from day 1 and day 2. One-way repeated measures ANOVA was performed to study if a significant difference exists in ICC and ASI among the three test parameters of muscle stiffness, oscillation frequency and decrement. Level of significance was set at 0.05. Posthoc Bonferroni tests were then performed to perform pair-wise comparisons with adjusting alpha = 0.017, if significant differences were found in the ANOVA |
| Results |
| Muscle stiffness measures (Table 1) revealed good within-da reliability (ICCs>0.75) in all 22 muscle sites. The muscle oscillation frequency and muscle decrement measures demonstrated good reliability in 19 and 20 out of 22 muscle sites (Tables 2 and 3), respectively, with the rest of the muscle sites having ICC ranged from 0.42 to 0.74. Significant difference was found among the three test parameters (P<.05). Post-hoc Bonferroni-adjusted T-test showed that muscle stiffness had significantly higher ICC than muscle decrement (P<.01). When comparing the two muscle types, T-test indicated that oscillation frequency of tonic muscles had significantly higher ICC than that of phasic muscles (P<.05). |
| Muscle stiffness, oscillation frequency, and muscle decrement measures revealed good inter-day reliability in 18, 16, and 17 out of 22 muscle sites, respectively (Tables 2 and 3). No significant difference was determined among the test parameters and between the muscle types (P>.05). Some muscles (including Tibialis Anterior, Latissimus dorsi, Pectoralis Major, Sternocleidomastoid, Biceps Femoris, Gastrocnemius) were found to have good within-day reliability but moderate inter-day reliability. |
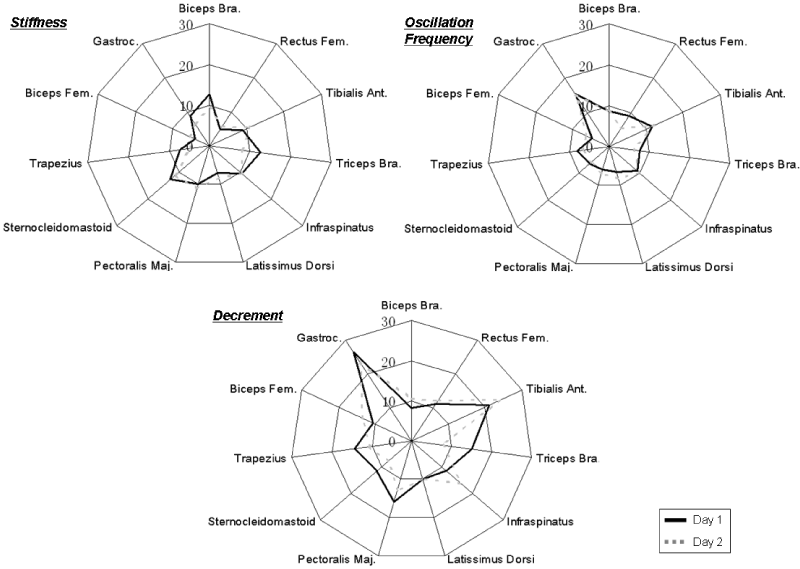
| Among all test muscles, Gastrocnemius and Tibialis Anterior was found to have the highest asymmetry index (>20%) in the decrement measurement. Other tested muscles were found to have asymmetry index ranging from 4% to 16% in all three myotonometric parameters. Bonferroni-adjusted T-test revealed that muscle decrement measurements (13.8%) had significantly higher side-toside asymmetry (i.e., higher ASI) compared to muscle stiffness (8.7%, P<.01) and oscillation frequency (8.3%, P<.01) measurements (Figure 2). No significant was found between phasic and tonic muscles. |
| Discussion |
| Generally, muscle stiffness, oscillation frequency and decrement measures demonstrated good within-day and inter-day reliability upon repeated measures in most tested muscle sites. This warrants the routine practice of muscle assessment using myometer for physiotherapists or sport trainers to assess the properties of the muscles before and after applying rehabilitation treatment [2,3,6-8]. Lower reliability for muscle decrement should need more attention when interpreting this parameter. Although all myotonometric measurements were taken by the same experienced experimenter, a number of tested muscles (including tibialis anterior, rectus femoris, infraspinatus, pectoralis major, gastrocnemius, triceps brachii, latissimus dorsi, and upper trapezius muscles) exhibited moderate within-day reliability, suggesting an operating variability or change in level of the relaxation of subjects between days [11]. |
| While no muscle type difference for inter-day reliability and sideto- side symmetry was determined, tonic muscles had significantly better within-day reliability in muscle oscillation frequency than phasic muscles. This might due to the functional need of tonic muscles, which are expected to predominantly maintain posture against gravity using subconscious reflex and contain mostly slow-twitch muscle fibers with a greater capacity for sustained work [10]. In this study, muscle type was classified according to its anatomical position, but other muscle classifications (e.g. bipennate versus unipennate, convergent versus parallel) would also be considered in the future to warrant the generalization. |
| A large muscle asymmetry between sides might disturb the rhythm of a movement and increase the risk of sport injures [12]. Gastrocnemius and Tibialis Anterior had the highest difference between sides (>20%) in the decrement measurement even for the healthy population, which might be cautious when interpreting the viscoelastic properties of muscles between the affected and unaffected sides. Identify the degree of asymmetry in of both sides using myotonometry could serve as an alternative tool to identify if micro-injury, deformity or overtraining has occurred [8,9]. More studies combined with clinical results and myotonometric measurements are necessary. |
| A muscle a non-standard body – a living tissue created function and always in the functions – would never achieve to absolute relaxation, resulting in some variability within or inter-day measurements [6-9]. Future research should include electromyography to ascertain whether the complete muscle relaxation associated with myotonometric measurements and respective reliability. |
| Conclusion |
| The measurements have to be taken when the muscle is in a relaxed state to monitor changes in muscle properties in clinical practice and orthotic related research. Myotonometric measurements are generally reliable for daily athletic muscle assessment, but some care should be taken in measuring muscle decrement. Attention should be paid to the potentially lower measurement reliability and higher side-to-side asymmetry in some specific muscle types and parameters. These are the potential source of measurement errors. Future studies should carefully consider if the observed difference is due to measurement errors or intervention effects when involving such parameters and muscles. |
References |
|
Tables and Figures at a glance
| Table 1 | Table 2 | Table 3 |
Figures at a glance
 |
 |
| Figure 1 | Figure 2 |
Relevant Topics
- Electrical stimulation
- High Intensity Exercise
- Muscle Movements
- Musculoskeletal Physical Therapy
- Musculoskeletal Physiotherapy
- Neurophysiotherapy
- Neuroplasticity
- Neuropsychiatric drugs
- Physical Activity
- Physical Fitness
- Physical Medicine
- Physical Therapy
- Precision Rehabilitation
- Scapular Mobilization
- Sleep Disorders
- Sports and Physical Activity
- Sports Physical Therapy
Recommended Journals
Article Tools
Article Usage
- Total views: 14699
- [From(publication date):
February-2015 - Jul 08, 2025] - Breakdown by view type
- HTML page views : 10000
- PDF downloads : 4699
