Research Article Open Access
Regional Study of Future Temperature and Precipitation Changes Using Bias Corrected Multi-Model Ensemble Projections Considering High Emission Pathways
Golam Rabbani Fahada1, Rouzbeh Nazaria1*, Joseph Daraiob2 and Dorothea June Lundberga1
1Department of Civil and Environmental Engineering, Rowan University, Glassboro, NJ, USA
2Faculty of Engineering and Applied Science, Memorial University of Newfoundland, St. John’s, NL, Canada
- *Corresponding Author:
- Rouzbeh Nazari
Department of Civil and Environmental Engineering
Rowan University, Glassboro, NJ, USA
Tel: 856256-5352
E-mail: nazari@rowan.edu
Received Date: August 22, 2017; Accepted Date: September 16, 2017; Published Date: September 20, 2017
Citation: Fahada GR, Nazaria R, Daraiob J, Lundberga DJ (2017) Regional Study of Future Temperature and Precipitation Changes Using Bias Corrected Multi- Model Ensemble Projections Considering High Emission Pathways. J Earth Sci Clim Change 8:409. doi: 10.4172/2157-7617.1000409
Copyright: © 2017 Fahada GR, et al. This is an open-access article distributed under the terms of the Creative Commons Attribution License, which permits unrestricted use, distribution, and reproduction in any medium, provided the original author and source are credited.
Visit for more related articles at Journal of Earth Science & Climatic Change
Abstract
The complex hydrologic and atmospheric dynamics of New Jersey, along with the prevailing risks of extreme weather events like floods, place this region in particular at a higher risk to the impacts of climate change. The objective of this study is to assess the spatial and temporal change in temperature and precipitation pattern over New Jersey. A multimodel ensemble provides useful information about the uncertainty of the future changes of future climate. High emission scenarios using Representative Concentration Pathways (RCP8.5) of the 5th Phase Coupled Model Inter-comparison Project (CMIP5) in the Intergovernmental Panel on Climate Change (IPCC) also aids to capture the possible extremity of the climate change. Using the CMIP5 regional climate modeling predictions, this study analyzes the distribution of the temperature and precipitation over New Jersey, USA in recent years (1971–2000) and in three future periods (i.e. 2010-2040, 2041-2070 and 2070-2100) considering RCP 8.5 scenarios. Climate changes are expressed in terms of 30-yr return values of annual near-surface temperature and 24-h precipitation amounts. At the end of the century, the mean temperature increase over New Jersey expected to increase between 3.5°C to 7.6°C with an increase in total precipitation ranging from 6% to 10%. Spatial analysis exhibited that the Northern and Western part of New Jersey will experience greater change in temperature and precipitation in the future. Analysis from extreme climate indicators suggested increase in yearly total and high intensity rainfall up to 21st century.
Keywords
Climate change; CMIP5; Heavy precipitation; RCP; Regional climate modeling; High end emission
Introduction
Global change of atmospheric temperature and precipitation patterns can have an adverse impact on both natural and human systems [1,2] Analysis of observed data showed a 0.6°C increase in average global temperature since the late 19th century. The 5th assessment report from IPCC (IPCC-AR5) also projected the potential for temperature rises of up to 4.8°C and sea level rise of up to 0.82 m by 2100 [3]. Potential impacts at the local and regional scale are a key concern to the scientific community. Changing climate at regional scales affect fundamental aspects of our life, including health and welfare, economy, and natural ecosystems. Evaluation of climate change is needed at a much higher spatial and temporal resolution for accurate impact assessment [4-7]. Effects of climate change at the global scale are already occurring in the forms of sea-ice loss, sea level rise, acute heat waves, etc. The state of New Jersey, USA lies along the east coast and the threat of sea level rise makes this state vulnerable to future climate change scenarios. Climate change will aggravate events such as flooding, storm damage, and intense heat or cold waves which in turn will lead to detrimental effects upon the increasing population and infrastructure development of the state. Thus, impact assessment based on climate change has increased significance for a vulnerable region like New Jersey.
General Circulation Models or GCMs which simulate physical processes in the atmosphere, ocean as well as for land surface considering the response of the global climate system due to increasing greenhouse gas concentrations. A fully coupled atmospheric-ocean general circulation model (AOGCM) comprises of an atmospheric GCM (AGCM) and an ocean GCM (OGCM). GCMs depict the global climate typically having a horizontal resolution of between 250 and 1000 km. The complexity of the GCMs and need for long term ensemble scenarios result in high computing cost. To avoid that, GCMs usually adopt relatively coarse resolution grid spacing which result in inappropriate representation of topography and local climate [8,9]. Various hydrological processes such as radiation, convection, cloud microphysics etc. occur mainly on a finer scale. Due to their coarse resolution, they do not provide full representation of the actual regional climate scenario required for impact analysis. Therefore, downscaling of the coarse resolution GCM variables to regional scale is essential for better representation of regional climate [10,11]. Among two techniques of downscaling the climate variables from GCMs i.e., statistical and dynamical [12], the statistical downscaling techniques focus on developing quantitative relationships between atmospheric variables of coarse resolution and finer regional resolution [13]. In contrast, dynamic downscaling method uses regional climate models (RCMs) that are developed based on the same principles of dynamical and physical processes as GCMs but with a much finer resolution (10- 50 km) that better capture the regional climate [14]. Thus, embedding fine resolution RCMs within GCMs has become a common practice in climate change studies. Previous studies concluded that RCMs significantly improves the model formulation of precipitation, one of the most important climatic variable [15,16].
In recent decades, climate models have continued to be developed and improved significantly. Standard protocols of numerical experiments for climate models were developed in the third Phase of the Coupled Model Intercomparison Project (CMIP3) by the Working Group on Coupled Modelling (WGCM) in response to a proposed activity of the World Climate Research Programme (WCRP) [17]. Climate model outputs from the CMIP3 project provide significant contributions to the formation of Fourth Assessment report (AR4) under the Intergovernmental Panel on Climate Change, IPCC [18]. IPCC-AR4 is based on emission scenarios which work as the basis for conducting climate simulations by external forcing [17]. For better evaluation of the previous model simulations as well as understanding the factors behind the differences in model projections, the fifth phase of the Coupled Model Intercomparison Project (CMIP5) was developed considering radiative forcing due to greenhouse gas concentration [19]. Experiments conducted through CMIP5 multi-model ensemble contributed to the Fifth Assessment Report (AR5) [3]. Hereafter, outputs from these two projects are named as CMIP3 and CMIP5 datasets. Introduction of improved general circulation models in CMIP5 for better simulation of the AOGCMs provide more appropriate surface air temperature and precipitation distribution than CMIP3 [3]. Rammig [20] concluded CMIP3 lacks certain biogeochemical aspects which lead to even more uncertainty in CMIP3 models. According to Sperber et al. [21] CMIP5 models are more skillful at capturing various aspects of Asian monsoon climate than the CMIP3 models. Ogata and Watterson et al. [22,23] also reported modest improvement climate simulations by CMIP5 models suggesting an advantage of using CMIP5 model outputs. CMIP5 provides four new future projection scenarios i.e., RCP2.6, RCP4.5, RCP6 and RCP8.5 based on Representative Concentration Pathways (RCPs). RCP 8.5 represents a future with higher emissions and is distinguished by the highest amount of greenhouse gas concentrations up to 21st century [24,25]. However, among four RCP scenarios RCP8.5 can reflect the highest possible change in climate. Zou and Zhou [26] concluded that the current global emissions tracking slightly above RCP8.5 scenario which makes it inevitable to assess the impact analysis based on RCP8.5. Considering this fact another study over China was also conducted using the RCP8.5 scenario [26]. The rest of the pathways are marked as moderate mitigation scenarios as they manifest milder future carbon emissions.
However, systematic errors in climate models are observed due to erroneous conceptualization and during spatial averaging of grid cells [27]. Underrepresentation of existing physio-geographical characteristics results in a serious bias in crucial parameters such as temperature and precipitation [28,29]. Therefore, bias correction of the climate model outputs for hydrologic impact assessment is essential [30-32]. Several bias correction procedures such as delta and scaling approach [33], quantile mapping [34], merging of linear and nonlinear empirical-statistical [35] have been recently used for correcting the climate model outputs to resolve this issue.
On these context, the objectives of this paper were to evaluate the (1) current trend of New Jersey’s climate, (2) possible high end changes of future climate over for the three future periods i.e., near future (2010-2040), mid future (2041-2070) and far future (2071-2100) and (3) extreme climate indicators over New Jersey. This paper comprises of three main sections and a conclusion. Section one describes the region of study, the digital geographical models that encompass it, and the sources of climate data used. Section two includes a basic analysis of the precipitation and temperature dataset in terms of the integrity of temporal series and the spatial densities of the ground network. Section three is a description of the variability of precipitation and an assessment of orography. Finally, the conclusions compile the main findings.
Study Site and Methods
Description of the study area
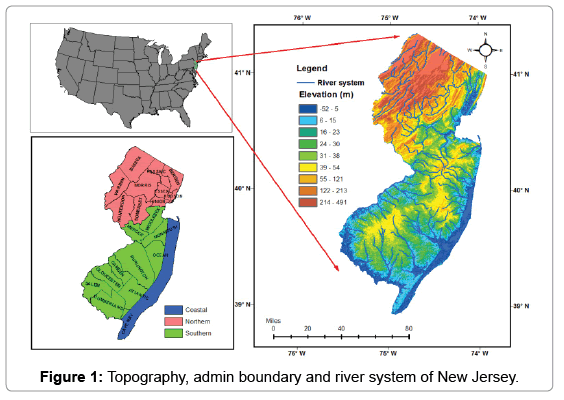
New Jersey (NJ) is in the Mid-Atlantic Region of the Unites States with geographical coordinates between 38° 56′N to 41° 21′N and 73° 54′W to 75° 34′W. It is bordered on the east by the Atlantic Ocean, on the west by the Delaware River, on the south by the Delaware Bay, and on the north by the state of New York. Despite its small size, NJ has three distinct climate zones: Northern, Southern, and Coastal (Source: http://climate.rutgers.edu) (Figure 1).
The Northern climate zone is part of the Appalachian Uplands and consists of elevated highlands and valleys with a continental climate. The upper Northern zone is mainly comprised of urban areas. These urbanized areas contain impervious surfaces which lead to localized warmer regions known as “urban heat island” effect. The Southeast part contains the Pine Barren region with relatively low temperatures due to the pine and oak forests, as well as the porous sandy soils that greatly impact the hydrology of this region. The porous sandy soil permits the precipitation to infiltrate rapidly and during the drier condition higher daily maximum temperature could be a threat to forest fire in this region. The Southwest zone is around 30 m above sea level and its close proximity to the Delaware Bay adds maritime significance to the climate of this region. Finally, the Coastal zone temperature is split between continental and Coastal influences on seasonal and sub-seasonal bases due to the high heat capacity of the adjacent Atlantic Ocean. This region tends to be warmer than other areas during the fall and early winter, but cooler during the spring. Strong humid subtropical climate is dominant in most of the Northern and Northeastern part of the state. The summer season is hot and humid with average temperatures of 28- 31°C across the state. During winter average high temperatures remain between 1 to 6°C and lows of -9 to -2°C for most of the state. However, wide variations in temperature, along with lower humidity than summer, are the main characteristics of spring and fall seasons. The highest historical extreme temperature was recorded as 43°C on July 10, 1936 and the lowest recorded temperature was -37°C on January 5, 1904 for New Jersey. Precipitation is uniformly distributed through the year with an average annual precipitation ranging from 1100 mm to 1300 mm (Source: http://climate.rutgers.edu/stateclim_v1/nclimdiv/). The ‘nor'easters’ [36], a notable feature in New Jersey climate during winter and early spring, causes blizzards and flooding. Hurricanes and tropical storms are quite common in the northeastern United States which includes New Jersey. Hurricane Sandy, Irene, and remnants of Hurricane Katrina are some most notable hurricanes that have affected New Jersey in recent years.
Climate data
Trend analysis was conducted over New Jersey’s three regional parts (Northern, Southern and Coastal) using the observed data obtained from National Centre for Environmental Information (NCEI) climate database (https://www.ncei.noaa.gov/) for the period of 1900-2010. Climatic variables included daily precipitation; average temperature, maximum temperature, and minimum temperature were considered for the analysis. For future climate analysis, statistically downscaled 5 GCMs and dynamically downscaled 5 RCMs were used. All the products were bias corrected before further analysis. The GCM products were bias corrected according to the methodology described in the ISI-MIP approach [37]. Bias corrected GCM products were obtained from the inter-sectoral impact model intercomparison project (ISI–MIP) [38]. The bias correction procedure applied to the RCM products has been described in a new distribution mapping technique for climate model bias correction. [39]. Bias corrected RCM products were obtained from the North American CORDEX (NA-CORDEX) server (https:// na-cordex.org/). The origin of the climate models used in this study and there related resolutions are provided in Tables 1and 2. All the climate model data were divided into two parts, (1) historical period (1971-2005) and (2) future RCP 8.5 scenario (2006-2100). Among the four RCPs as shown in Table 1, the high emission scenario RCP 8.5 was chosen for the study (Table 1).
| Name | Radiative Forcing | Concentration |
|---|---|---|
| RCP8.5 | >8.5 W/m2 in 2100 | 1370 CO2-eq |
| RCP6 | 6 W/m2 at stabilization after 2100 | 850 CO2-eq at stabilization after 2100 |
| RCP4.5 | 4.5 W/m2 at stabilization after 2100 | 650 CO2-eq at stabilization after 2100 |
| RCP3-PD (RCP2.6) | Peak at 3 W/m2 before 2100 and then decline to 2.6 W/m2 | Peak at 490 CO2-eq before 2100 and then decline |
Table 1: Description of the RCP scenarios [58].
| Institute | GCM | Driving RCM | Resolution | Citation |
|---|---|---|---|---|
| Geophysical Fluid Dynamics Laboratory, USA | GFDL-ESM2M | N/A | 0.44° (~50 km) | Dunne et al. [61] |
| Met Office Hadley Center, UK | HADGEM2-ES | N/A | 0.44° (~50 km) | Jones et al. [67] |
| Institut Pierre Simon Laplace, France | IPSL-CM5A-LR | N/A | 0.44° (~50 km) | Dufresne et al. [60] |
| Japan Agency for Marine-Earth Science and Technology, Atmosphere and Ocean Research Institute (The University of Tokyo), and National Institute for Environmental Studies | MIROC-ESM-CHEM | N/A | 0.44° (~50 km) | Watanabe et al. |
| Norwegian Climate Center, Norway | NorESM1-M | N/A | 0.44° (~50 km) | Bentsen et al. [57] |
| Geophysical Fluid Dynamics Laboratory, USA | GFDL-ESM2M | REGCM4 | 0.44° (~50 km) | Dunne et al. [61] |
| Giorgi et al. [64] | ||||
| Geophysical Fluid Dynamics Laboratory, USA | GFDL-ESM2M | WRF | 0.44° (~50 km) | Dunne et al. [61] |
| Skamarock et al. [68] | ||||
| Met Office Hadley Center, UK | HADGEM2-ES | REGCM4 | 0.44° (~50 km) | Jones et al. [67] |
| Giorgi et al. [64] | ||||
| Max Planck Institute for Meteorology, Germany | MPI-ESM-LR | REGCM4 | 0.44° (~50 km) | Stevens et al. |
| Giorgi et al. [64] | ||||
| Max Planck Institute for Meteorology, Germany | MPI-ESM-LR | WRF | 0.44° (~50 km) | Stevens et al. |
| Skamarock et al. [68] |
Table 2: List of climate models used in the study.
Two climatic variables- average temperature and precipitation were used to assess the climate change impact. Four time slices were considered to represent the possible changes in temperature and precipitation. These time slices are baseline 1970s (1971-2000), early era 2020s (2011-2040), mid era 2050s (2041-2070) and long term era 2080s (2071-2100). To validate the accuracy of the bias corrected climate products over New Jersey the climate model data in the historical period (1971-2000) were compared with the hybrid dataset of Watch Forcing Data-WFD by Weedon et al. and the Watch Forcing Data methodology applied to ERA-Interim Data (WFDEI) used in the Inter-Sectoral Impact Model Integration and Intercomparison Project ISI-MIP (Weedon et al. 2014) which combines forcing data of WFD (1901-1978) and WFDEI.GPCC (1979-2012) (Table 2).
Only RCP 8.5 scenario for was used in this case since it has the most extreme climate forcing such as greenhouse gas concentration as described in IPCC-AR5. Furthermore, it was necessary to match the spatial scale of gridded observed data with model simulated data. The gridded WFD-WFDEI data was interpolated to match the exact grid for the model simulated GCM and RCM products. This was done by using Climate Data Operator (CDO) [40]. We used bilinear interpolation for the regridding purpose because it is computationally faster and smoothing in both horizontal and vertical direction improves the accuracy more than the linear interpolation technique. The spatial distribution of future temperature and precipitation were produced using inverse distance weighting (IDW) [41]. For example, for example, the average temperature for the period of 1971-2000 (historical period) were first calculated over the study area. Next, average for the three future periods (2010-2040, 2041-2070, 2071-2100) were also calculated individually. After that the individual averaged values were subtracted from the historical period to find out the spatial pattern of future temperature over New Jersey.
Mann-Kendal test and Sen’s slope estimator
We preformed the Mann Kendall (M-K) trend test or ‘Kendall t test’ [42], which is a widely used non-parametric trend test in climatologic and hydrologic time series. Non-conformity to any particular distribution and low sensitivity to sudden changes due to inhomogeneous data series make this test superior than other trend detection statistics [43]. M-K trend test is based on two hypotheses. First the null hypothesis, H0, assumes that there is no trend. Therefore, the data is independent and randomly ordered. The alternative hypothesis, H1, assumes that the data series follows a monotonic trend. We state whether results of M-K test were significant at different confidence intervals i.e. 99.9%, 99%, 95%, and 90% confidence levels. M-K test only provides the idea of having a trend in data series, so to get a quantitative sense of the increasing or decreasing rate of that trend, we used the Sen’s slope estimator test [44,45]. The slope estimator (S) of the data x is expressed as below:
 (1)
(1)
 (2)
(2)
Where, i = 1, 2, 3…N and i < j.
Climate extreme indicators
The definitions of four extreme climate indicators analyzed in this study are listed in Table 3. These indicators were chosen for their strong relevance to various hydrologic events such as high intensity rainfall, flash flood, droughts as well as relevance to ecological processes.
| Indicators | Description | Definitions | Unit |
|---|---|---|---|
| CDD | Consecutive dry days | Maximum number of consecutive days with RR<1mm | days |
| CWD | Consecutive wet days | Maximum number of consecutive days with RR=1mm | days |
| R95p | Precipitation on very wet days | Annual total rainfall when rainfall >95th percentile |
mm |
| PRCPTOT | Annual total wet-day precipitation | Annual total PRCP in wet days (RR = 1mm) | mm |
Table 3: List of extreme climate indicators used in this study.
Results
Trend analysis
We studied seasonal trends of precipitation and maximum and minimum temperatures for different climatic zones of New Jersey for 110 years (1901-2010) (Table 4). The Northern part of the state shows the highest increasing trend of precipitation (0.635 mm/year) during fall with 95% confidence level. All three climatic regions exhibited greater increasing trend of precipitation during fall season. Northern and Coastal regions manifest a small decreasing trend, -0.008 and -0.012 mm/year, for precipitation in the summer and winter respectively (Table 4), however, none of the trends were statistically significant. Also, our trend analysis suggested an increasing trend of precipitation in the Northern part compared with Southern and Coastal region.
| Parameters | Seasons | Climatic zones | ||
|---|---|---|---|---|
| Northern | Southern | Coastal | ||
| Precipitation (mm/year) | Winter | 0.243 | 0.122 | -0.012 |
| Spring | 0.443* | 0.292 | 0.220 | |
| Summer | 0.167 | -0.008 | 0.057 | |
| Fall | 0.635* | 0.438++ | 0.475* | |
| Maximum Temperature (°C/year) | Winter | 0.022*** | 0.018*** | 0.018*** |
| Spring | 0.015*** | 0.013*** | 0.014*** | |
| Summer | 0.013*** | 0.014*** | 0.015*** | |
| Fall | 0.014*** | 0.011*** | 0.013*** | |
| Minimum Temperature (°C/year) | Winter | 0.020*** | 0.018*** | 0.021*** |
| Spring | 0.013*** | 0.013*** | 0.017*** | |
| Summer | 0.018*** | 0.017*** | 0.020*** | |
| Fall | 0.015*** | 0.015*** | 0.018*** | |
| *** Trend at a=0.001 level of significance; * Trend at a=0.05 level of significance; ++ Trend at a=0.1 level of significance. No sign means significance level >0.1 | ||||
Table 4: Seasonal trend in precipitation (mm/year) and temperature (°C/year) for different climatic zones of New Jersey.
In contrast to precipitation, there is strong evidence of increasing trend for both maximum and minimum temperature for all regions of New Jersey over all seasons at 99.9% confidence level. The Northern region exhibited highest increasing trend for maximum temperature (0.022°C/year) during winter whereas it is 0.021°C/year for minimum temperature in Coastal region (Table 4). Additionally, results indicate a greater warmer trend during winter season over the entire state of New Jersey.
Performance of bias correction
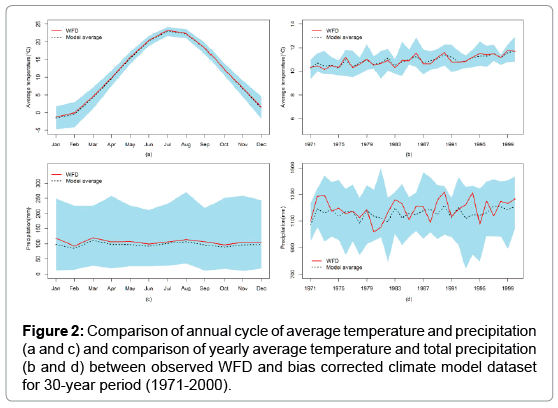
The relative performance of representing the annual cycle of precipitation and temperature simulated by the bias corrected GCMs and RCMs are highlighted in Figure 2. Both of the model simulated climatic parameter was able to capture the annual cycle by comparison with the observed WFD dataset. The mean annual cycle of precipitation derived from the climate models slightly underrepresented the observed precipitation as shown in Figure 2c. Overall bias corrected climate models exhibit better representation of the annual cycle of temperature than the precipitation indicating greater uncertainty still exist in model simulated precipitation than temperature over New Jersey. The yearly average of 30-year period for both the observed and climate model data shown in Figures 2b and 2d. Results indicated accurate representation of long term temperature pattern of the bias corrected climate models highlighted by the adjacency of the observed WFD with the mean of climate models derived average temperature (Figure 2). The long term yearly precipitation pattern was also captured by the bias corrected GCMs and RCMs as shown in Figure 2d but with a greater level of uncertainty than the average yearly temperature.
Future temperature and precipitation projection
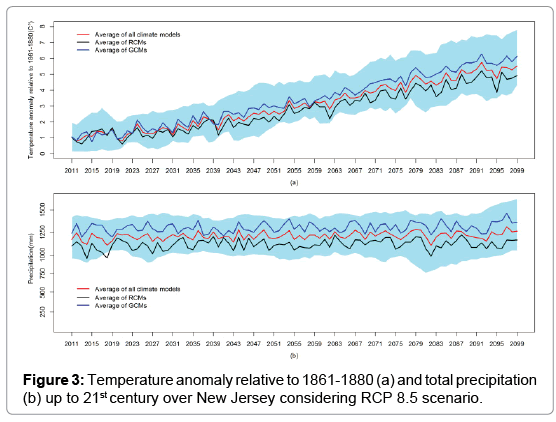
The average temperature anomaly for the 5 GCM and 5 RCM model is shown in Figure 3a relative to pre-industrial period (1861- 1880) up to 21st century. As the greenhouse gas concentration increases sharp increasing trend was manifested for average temperature with the highest average temperature increase of 5.74°C in year 2092. Figure 3a suggests greater uncertainty in temperature projection as scenario extends to 21st century. Until 2040s both the ensemble mean of GCMs and RCMs projected similar temperature anomaly up to ~1.5°Cover New Jersey considering the RCP 8.5 scenario. As the projection extends to near and far future the average temperature anomaly derived from the GCMs manifested greater increase than the ensemble mean of the RCMs as shown in Figure 3a. Considered individually, through the 21st century GCM MIROC exhibited the highest increase (~7.5°C) and the RCM GFDL-REGCM4 indicated lowest increase (~4.7°C). Unlike temperature the future projection of total precipitation up to 21st century exhibited lesser degree of increment over New Jersey with notable increase in the far future (2080s) as shown in Figure 3b. Ensemble mean of GCM precipitation predicts greater amount of total precipitation than the RCMs.
Monthly variation of future average temperature and precipitation over New Jersey
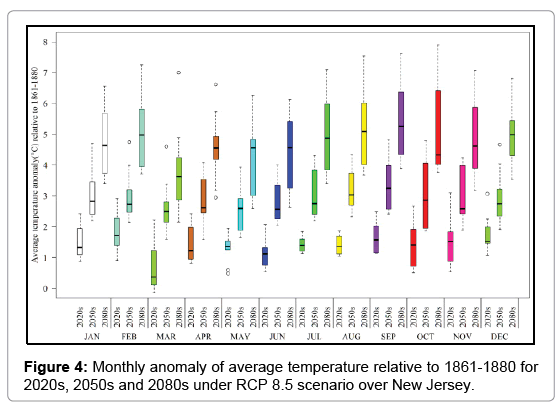
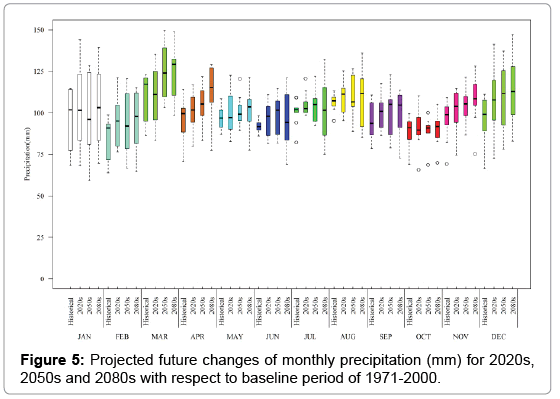
Probable range of change in monthly variation of average temperature based on the climate models are represented in Figure 4. Results indicated highest increase in October during 2080s ranging between 3.8°C and 7.8°C over New Jersey. During 2020s and 2050s the annual cycle of temperature expected to increase up to ~2°C and ~3°C as shown in Figure 4. During 2080s the annual temperature cycle expected to surpass 6°C except for the month of March. Figure 4 also manifested greater temperature increase in late summer (August) as well as early and mid-fall (September and October) during 2080s. Results also indicated greater temperature increase during winter (DJF) than spring (MAM) over New Jersey for all the three time periods. Future changes of monthly precipitation under RCP 8.5 scenario for the GCMs and RCMs combined over New Jersey are shown in Figure 5. Results indicated that precipitation will increase in future in response to global warming under RCP 8.5 scenario. Model results suggested a significant increase of total monthly precipitation up to 21st century during early and mid-winter (December and January and early spring (March) ranging between 55 mm – 150 mm than the other seasons. Least amount of precipitation increase was observed during October ~100 mm as shown in Figure 4.
Spatial pattern of projected future changes of average temperature and precipitation over New Jersey
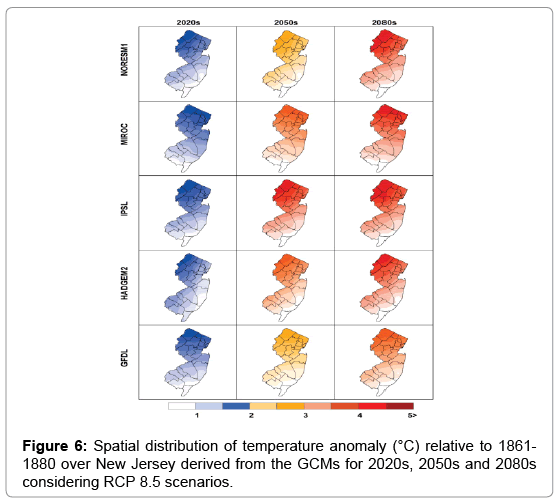
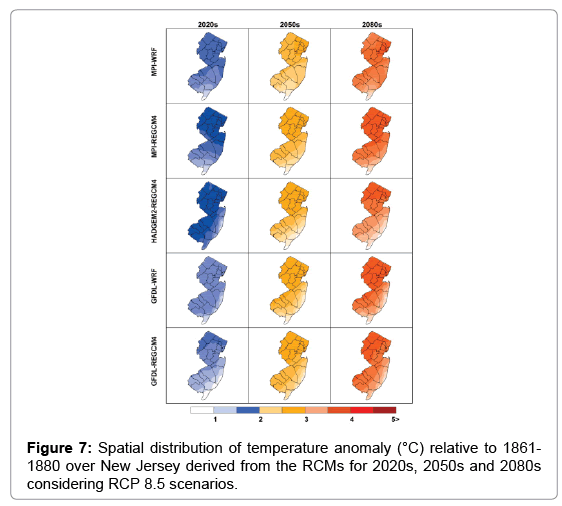
Projected spatial distributions of average temperature anomaly considering the RCP 8.5 scenario derived from the GCMs and RCMs over New Jersey for the three future time period (i.e., 2020s, 2050s and 2080s) are presented in Figures 6 and 7. All climate models resulted in a warmer temperature pattern over New Jersey, ranging between 1°C to ~5°C in comparison with the pre-industrial period.
Both GCMs and RCMs exhibited up to ~2°C temperature increase over New Jersey during 2020s. Resuls also indicated that the GCM models predict greater temperature increment pattern than the RCM models. Results from the RCM models manifested increasing temperature distribution up to ~3°C whereas the GCM models exhibited mixed distribution ranging from 3°C to 4°C (GCM MIROC) even close to 4.5°C (GCM IPSL) during 2050s as shown in Figures 6 and 7 All the RCM models predicted a spatial increment of ~4°C whereas the GCM models exhibited greater than 4°C during 2080s except the GCM GFDL. A zonal distribution was evident from the spatial pattern of the models indicating greater increase of temperature in the Northern part of New Jersey. Counties like Sussex, Passaic, Bergen and Warren containing major business centers were expected to face greater temperature rise. These urban areas are already facing issues with urban heat island effect. Temperature increase will likely worsen the situation causing serious health related issues.
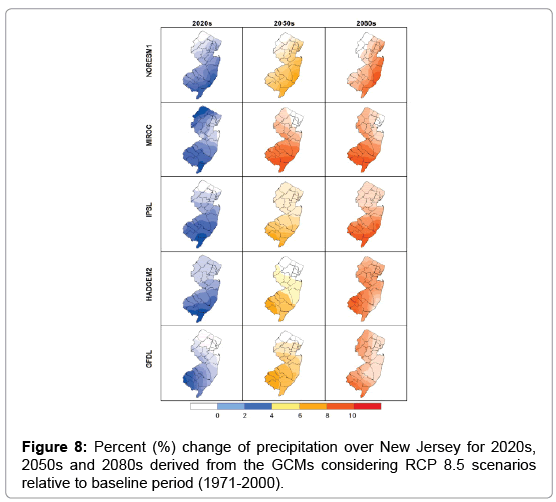
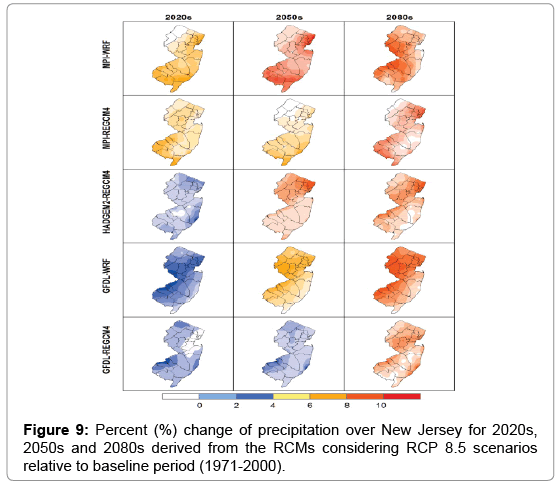
Spatial distribution of percent change of precipitation from the GCMs and RCMs considering the RCP 8.5 scenario over New Jersey for near, mid and far future are presented in Figures 8 and 9 respectively. The GCMs predicted an increase of total precipitation during 2020s with the highest percentage increase of ~4% in comparison to the historical period (1971-2000), especially on the Southern and South-East part of the New Jersey except GCM MIROC which projected significant increase in the Northern part of the state as well. All the GCM models showed an increase in total precipitation up to ~8% except GCM MIROC as shown in Figure 8. During 2080s part of Southern New Jersey expected to receive increased precipitation ~10% in comparison with the historical period (1971-2000) derived from the GCMs. The RCM models as shown in Figure 9 also manifested an increase of total precipitation up to 4% except the MPI-REGCM4 and MPI-WRF which exhibited an early increase in total precipitation up to 8% during 2020s.
During 2050s RCM model resulted in increase in total precipitation ranging between 2% to 10% except the RCM MPI-WRF which exhibited increase in total precipitation more than 10%. All the RCM models predicted increase in total precipitation ranging between 6% to ~10% during 2080s as shown in Figure 9. A zonal distribution is also highlighted by the climate models showing the Southern and South- Western counties such as Atlantic, Cape May, Cumberland, Salem and Camden of New Jersey are expected to be most vulnerable to increased precipitation in the future.
Extreme climate indicators
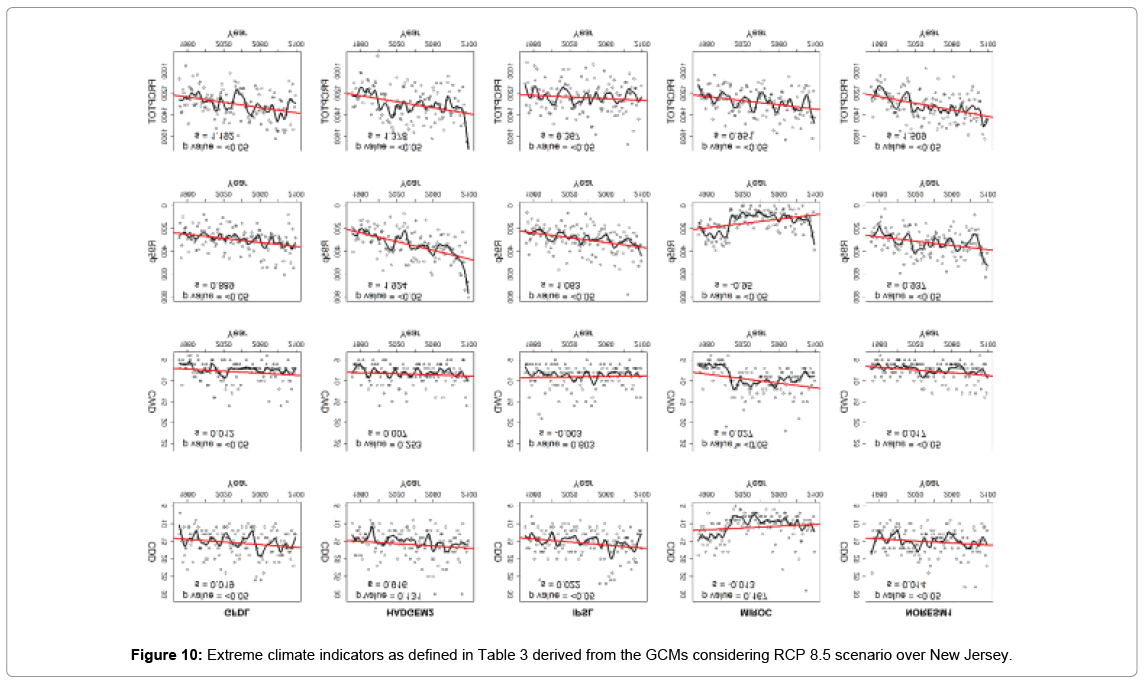
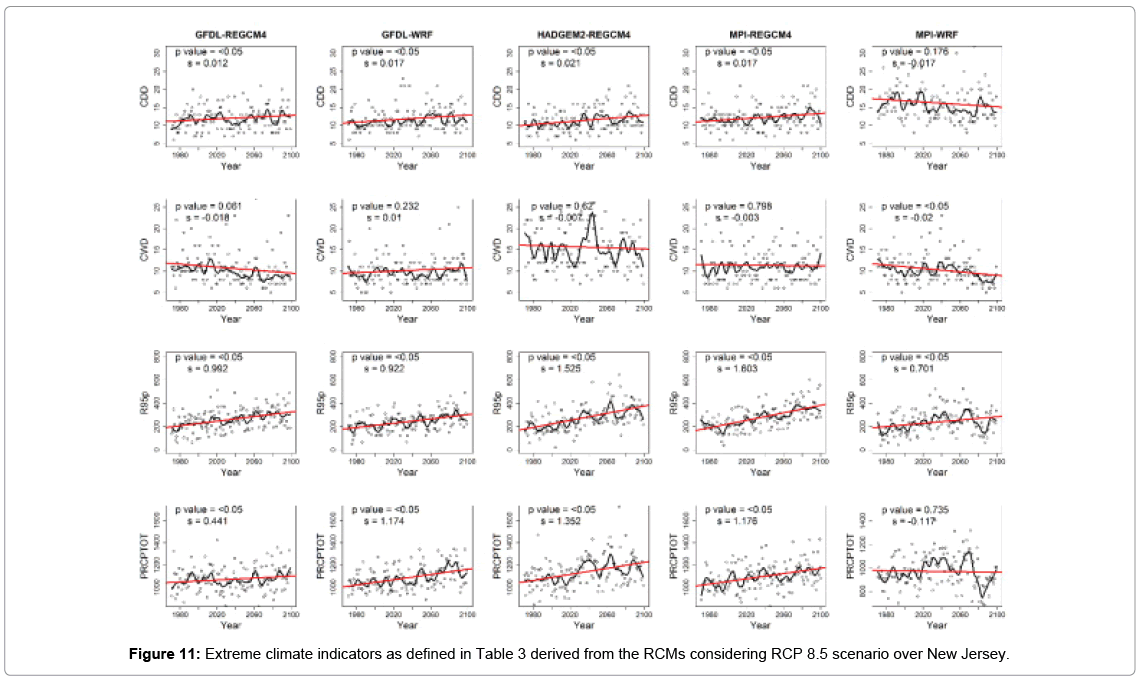
The temporal trend of the extreme climate indicators and their associated significance level are depicted in the Figures 10 and 11. The Consecutive Dry Days (CDD) and Consecutive Wet Days (CWD) are the indicators of the length of the dry and wet season. All of the GCMs resulted in a statistically significant (p-value <0.05) increase in CDD with the highest trend exhibited by the GCM IPSL except the GCM MIROC which indicated a decreasing trend in CDD but it was not statistically significant (p-value > 0.05) as shown in Figure 10. Similar statistically significant increasing trend was observed for the RCMs as well except the RCM MPI-WRF which indicated a decreasing trend in CDD but found to be not statistically significant as shown in Figure 11. Statistically significant increase in CWD was also observed for the GCM GFDL, MIROC and NORESM1. Except that the both increasing and decreasing trend was manifested by the GCM HADGEM2 and IPSL respectively but none of them are statistically significant (p-value > 0.05) as shown in Figure 10.
Apart from that, CWD derived from the only RCM MPI-WRF indicated statistically significant decrease in CWD. All of the climate models projected statistically significant increase in R95p over New Jersey except for the GCM MIROC. The annual total wet-day precipitation index (PRCPTOT) derived from the climate models exhibited statistically significant increase in total precipitation in the future except RCM MPI-WRF which indicated a decreasing trend but found to be not statistically significant (p-value>0.05).
Discussion
Many studies, spanning several disciplines and employing different methods, have linked climate change to future temperature and precipitation pattern both in temporal and spatial scale. The increase of temperature in this study is in agreement with the results obtained. Karl, Alexander and Hamlet et al. [46-48], examined the increasing trend of temperature and its effect to the declining mountain snowpack in Western North America. Carlos et al. also analyzed the current trend of temperature and precipitation over Utah, USA and found similar increasing trend in temperature with few statistically significant trend in precipitation. It is a well-established fact that increasing air temperature will accelerate the water cycling process resulting in increase in precipitation both in amount and intensity. Study conducted by Karl and Knight [49] concluded 8% increase in precipitation across the United States since 1910. According to Kunkel et al., short duration extreme precipitation over United States is increasing at a rate of 3%/decade for the period of 1931-1996. Study conducted by Ahmed et al. [50] over northeast United States using six GCMs and four RCMs also indicated similar trend in temperature and extreme precipitation. Implications of increasing temperature and precipitation over society and ecosystems are studied in detail [51,52]. Heat waves, floods and droughts, increasing frequency and intensity of hurricanes are direct consequence of changing climate. Agriculture is a key economic component for the state of New Jersey. Changes in temperature and precipitation pattern will affect the growing season length, planting times, crop rotations, pest management and shifts in areas of crop production. According to several studies [53,54], the projected temperature increase between 1.8°C and 5.4°C and precipitation extremes yields of major U.S crops and farm profits are expected to decline. Analysis also suggests that climate change has an influence on year to year swings in corn prices in United States [55]. Numerous hurricanes have passed near of through New Jersey in its history. Study conducted here [56-62] indicated the changes in hurricanes intensity and rainfall due to warmer climate. New Jersey might face substantial economic loss due to stronger hurricanes. Tourism and outdoor recreation have been an important, growing sector of New Jersey’s economy. Changes in precipitation and temperature patterns could have significant impacts on season lengths which in turn affect the economic viability of this industry [63-65].
Conclusion
This article presents an assessment of the expected future changes in the characteristics of precipitation and temperature over New Jersey considering the RCP 8.5 scenario using ten climate models. The current climatic trends of temperature and precipitation indicated temperature increase ranging from 0.13°C/decade to 0.2°C/decade for all regions of New Jersey with a high confidence level. Meanwhile, the current trends for precipitation over New Jersey showed variations throughout the studied area and, in general, with few statistically significant trends. Thus, it was not possible to conclude that significant changes in precipitation occurred in this region over the last century. Bias corrected GCM and RCM outputs was found to represent the mean precipitation and temperature as well as small scale features of the annual cycle over New Jersey. It was also found that greater uncertainty still exist in the climate models in simulating precipitation compared to average temperature. By the end of the 21st century climate models projected an increase in temperature ranging from 3.5°C to ~7°C over New Jersey with greater temperature increase during winter season. Results indicated the Northern and Western part of New Jersey as the most vulnerable part under temperature increase. The winter precipitation expected to increase by 150 mm towards the 2080s relative to the baseline period of 1970s. The Southern and South-Western part of New Jersey will be most vulnerable to increase in total precipitation however, on smaller regional scale some regions may experience slightly lower rainfall in the future compared to the baseline period. Climate models exhibited strong evidence of increase in consecutive dry day (CDD) however prediction for consecutive wet day (CWD) do not agree under different climate models, suggesting uncertainty in the projection of precipitation changes. Increasing trend of CDD, R95p and PRCPTOT implies a longer drier season length with an increase of heavy precipitation in future. The scenarios presented in this article highlighted the expected changes in precipitation and temperature patterns over the coming years indicating future impacts of climate change over New Jersey. It is a high priority to detect these spatial and temporal changes in precipitation on the regional scales due to the associated critical socioeconomic consequences. Trends in regional temperature and precipitation extremes and their indication of climate change are of interest to New Jersey as well as the rest of the world. Results obtained in the study corroborate the general idea that global warming is real and as a consequence, increase in convective activity results in increase in total precipitation. Additionally, the data and methodology applied in this study can be extended to other regions as well. The main limitation of this study arises from the uncertainty in climate models to simulate the past and future climate. Inclusion of more bias corrected climate models to generate accurate multi model ensemble might improve the confidence of the results. Also, by including more than one emission scenarios could sufficiently capture the uncertainty in model predictions.
Acknowledgements
This work was supported through New Jersey Department of Community Affairs (NJDCA) from Superstorm Sandy Community Development Block Grant Disaster Recovery (CDBG-DR). We also acknowledge the World Climate Research Programme's Working Group on Coupled Modelling, which is responsible for CMIP. For CMIP the U.S. Department of Energy's Program for Climate Model Diagnosis and Inter-comparison provides coordinating support and led development of software infrastructure in partnership with the Global Organization for Earth System Science Portals.
References
- Hao X, Chen Y, Xu C, Li W (2008) Impacts of climate change and human activities on the surface runoff in the Tarim River Basin over the last fifty years.Water Resources Management 22:1159-1171.
- Gebre SL, Ludwig F (2015) Hydrological response to climate change of the upper Blue Nile River Basin: based on IPCC Fifth Assessment Report (AR5). J Climatol Weather Forecasting 3:2.
- Stocker TF (2014) Climate change 2013: The physical science basis: Working Group I contribution to the Fifth assessment report of the Intergovernmental Panel on Climate Change.Cambridge University Press, UK.
- Doherty RM, Mearns LO, Reddy KR, Downton MW, McDaniel L (2003) Spatial scale effects of climate scenarios on simulated cotton production in the southeastern USA. Climatic Change 60:99-129.
- Tsvetsinskaya EA, Mearns LO, Mavromatis T, Gao W, McDaniel L, et al. (2003) The effect of spatial scale of climatic change scenarios on simulated maize, winter wheat, and rice production in the southeastern United States. In Issues in the Impacts of Climate Variability and Change on Agriculture60: 37-71.
- Kueppers LM, Snyder MA, Sloan LC, Zavaleta ES, Fulfrost B (2005)Modeled regional climate change and California endemic oak ranges. Proceedings of the National Academy of Sciences of the United States of America 102:16281-16286
- Hayhoe K, Wake C, Anderson B, Liang XZ, Maurer E (2008) Regional climate change projections for the Northeast USA. Mitigation and Adaptation Strategies for Global Change 13:425-436.
- Bhaskaran B, Ramachandran A,Jones R, Moufouma-Okia W(2012) Regional climate model applications on sub├ó┬?┬Éregional scales over the Indian monsoon region: The role of domain size on downscaling uncertainty. J Geophys Research: Atmospheres 117:1-12.
- Maraun D, Wetterhall F, Ireson AM, Chandler RE, Kendon EJ, et al. (2010) Precipitation downscaling under climate change: Recent developments to bridge the gap between dynamical models and the end user, Reviews of Geophysics p. 48.
- Xu C, Widén E, Halldin S (2005) Modelling hydrological consequences of climate change-progress and challenges.AdvAtmosSci 22:789-797.
- Fowler HJ, Blenkinsop S, Tebaldi C (2007) Linking climate change modelling to impacts studies: recent advances in downscaling techniques for hydrological modelling. Int J Climatol 27:1547-1578.
- Wilby RL, Wigley TML(1997) Downscaling general circulation model output: a review of methods and limitations.ProgPhysGeogr 21: 530-548.
- Wilby RL, Charles SP, Zorita E, TimbalB, Whetton P, et al. (2004) Guidelines for use of climate scenarios developed from statistical downscaling methods.
- Christensen JH, Carter TR, Rummukainen M, Amanatidis G(2007) Evaluating the performance and utility of regional climate models: the PRUDENCE project.Climatic Change 81: 1-6.
- Frei C, Schöll R, Fukutome S, Schmidli J, Vidale PL (2006) Future change of precipitation extremes in Europe: Intercomparison of scenarios from regional climate models.J GeophyRes: Atmospheres 111: D6.
- BuonomoE, Jones R, Huntingford C,Hannaford J (2007) On the robustness of changes in extreme precipitation over Europe from two high resolution climate change simulations.Quarterly Journal of the Royal Meteorological Society 133: 65-81.
- Meehl GA, Covey C, Taylor KE, Delworth T, Stouffer RJ, et al. (2007) The WCRP CMIP3 multimodel dataset: A new era in climate change research.Bulletin of the American Meteorological Society 88: 1383-1394.
- Solomon S (2007) Climate change 2007-the physical science basis: Working group I contribution to the fourth assessment report of the IPCC 4.
- Taylor KE, Stouffer RJ, Meehl GA (2012)An overview of CMIP5 and the experiment design. Bulletin of the American Meteorological Society 93: 485-498.
- Rammig A, Jupp T, Tietjen B, Heinke J, Ostberg S, et al.(2010) Estimating the risk of Amazonian forest dieback. New Phytol 187:695-707.
- Sperber KR, Annamalai H, Kang IS, Kitoh A, Moise A, et al. (2013) The Asian summer monsoon: an intercomparison of CMIP5 vs. CMIP3 simulations of the late 20th century. Climate Dynamics 41: 2711-2744.
- Ogata T, Ueda H, Inoue T, Hayasaki M, Yoshida A, et al. (2014) Projected future changes in the Asian Monsoon: A comparison of CMIP3 and CMIP5 model results. J Meteor Soc Japan 92: 207-225.
- Watterson IG, Bathols J, Heady C (2014) What influences the skill of climate models over the continents? Bulletin of the American Meteorological Society 95: 689-700.
- Riahi K, Rao S, Krey V, Cho C, Chirkov V, et al. (2011) RCP 8.5- A scenario of comparatively high greenhouse gas emissions.Climatic Change 109: 33-57.
- PetersGP, Andrew RM, Boden T, Canadell JG, Ciais P, et al. (2013) The challenge to keep global warming below 2C. Nature Climate Change 3:4-6.
- Zou L, Zhou T (2013)Near future (2016-40) summer precipitation changes over China as projected by a regional climate model (RCM) under the RCP8. 5 emissions scenario: Comparison between RCM downscaling and the driving GCM. Advances in Atmospheric Sciences 30: 806-818.
- Teutschbein C, Seibert J (2010) Regional climate models for hydrological impact studies at the catchment scale: a review of recent modeling strategies. Geography Compass 4: 834-860.
- Lucarini V, Pascale S, Böhner J (2013) Seasonality of the hydrological cycle in major South and Southeast Asian river basins as simulated by PCMDI/CMIP3 experiments, Earth Syst. Dynam 5:67-87.
- Christensen JH, Boberg F, Christensen OB, Lucas-Picher P (2008)On the need for bias correction of regional climate change projections of temperature and precipitation.Geophysical Research Letters 35.
- Wood AW, Leung LR, Sridhar V, Lettenmaier DP (2004) Hydrologic implications of dynamical and statistical approaches to downscaling climate model outputs. Climatic Change 62: 189-216.
- Ines AV, Hansen JW (2006) Bias correction of daily GCM rainfall for crop simulation studies. Agricultural and forest meteorology 138: 44-53.
- Teutschbein C, Seibert J(2012) Bias correction of regional climate model simulations for hydrological climate-change impact studies: Review and evaluation of different methods. Journal of Hydrology 456: 12-29
- Graham LP, Andréasson J, Carlsson B (2007) Assessing climate change impacts on hydrology from an ensemble of regional climate models, model scales and linking methods–A case study on the Lule River basin.Climatic Change 81: 293-307.
- Seguí PQ,Ribes A, Martin E, Habets F, Boé J(2010) Comparison of three downscaling methods in simulating the impact of climate change on the hydrology of Mediterranean basins. Journal of Hydrology 383: 111-124.
- ThemebJM, Gobiet A, Leuprecht A (2011) Empirical-statistical downscaling and error correction of daily precipitation from regional climate models.Int JClimatol 31: 1530-1544.
- Davis RE, Dolan R (1993)Nor'easters. American Scientist 81: 428-439.
- Hempel S,Frieler K, Warszawski L, Schewe J(2013) A trend-preserving bias correction–The ISI-MIP approach. Earth System Dynamics 4: 219-236.
- Warszawski L, Frieler K, Huber V, Piontek F, Serdeczny O, et al. (2014) The inter-sectoral impact model intercomparison project (ISI–MIP): Project framework. Proceedings of the National Academy of Sciences 111:3228-3232.
- McGinnis S, Nychka D, Mearns LO (2015) A new distribution mapping technique for climate model bias correction. In: Machine learning and data mining approaches to climate science p. 91-99.
- Schulzweida U, KornbluehL, Quast R (2006) CDO user’s guide. Climate Data Operators, Version 1.
- Bartier PM, Keller CP (1996) Multivariate interpolation to incorporate thematic surface data using inverse distance weighting (IDW). Computers & Geosciences 22: 795-799.
- Kendall MG (1948) Rank correlation methods, Hafner Publishing Company: New York. Journal of Marital and Family Therapy 7:515-520.
- Önöz, B, BayazitM (2003) The power of statistical tests for trend detection. Turkish Journal of Engineering and Environmental Sciences 27: 247-251.
- Sen PK (1968) Estimates of the regression coefficient based on Kendall's tau. J American Statistical Assoc63: 1379-1389.
- Gilbert RO (1987) Statistical methods for environmental pollution monitoring.John Wiley & Sons, NY, USA.
- Karl TR, Knight RW, Easterling DR, Quayle RG (1996) Indices of climate change for the United States. Bulletin of the American Meteorological Society 77: 279-292.
- Alexander LV, Zhang X, Peterson TC, Caesar J, Gleason B, et al. (2006) Global observed changes in daily climate extremes of temperature and precipitation. Journal of Geophysical Research 111: D05109
- Hamlet AF, Mote PW, Clark MP,Lettenmaier DP (2005) Effects of temperature and precipitation variability on snowpack trends in the western United States. Journal of Climate 18: 4545-4561.
- Karl TR, Knight RW (1998) Secular trends of precipitation amount, frequency, and intensity in the USA. Bulletin of American Meteorological Society 79: 231-241.
- Ahmed KF, Wang G, SilanderJ, Wilson AM, Allen JM, et al. (2013) Statistical downscaling and bias correction of climate model outputs for climate change impact assessment in the US northeast. Global and Planetary Change 100:320-332.
- Moberg A, Jones PD (2005) Trends in indices for extremes in daily temperature and precipitation in Central and Western Europe, 1901–1999.Int JClimatol25: 1149-1171.
- Choi G, Collins D, Ren G, Trewin B, Baldi M, et al. (2009) Changes in means and extreme events of temperature and precipitation in the Asia-Pacific Network region, 1955–2007.IntJ Climatol29: 1906-1925.
- Schlenker W, Hanemann WM, Fisher AC(2005) Will U.S. agriculture really benefit from global warming? Accounting for irrigation in the hedonic approach. The American Economic Review 95: 395-406.
- Ortiz R, Sayre KD, Govaerts B, Gupta R, Subbarao GV, et al.(2008) Climate change: Can wheat beat the heat? Agriculture, Ecosystems & Environment 126: 46-58.
- Diffenbaugh NS, Hertel TW, SchererM, VermaM (2012) Response of corn markets to climate volatility under alternative energy futures. Nature climate change 2: 514.
- Trenberth K (2005) Uncertainty in hurricanes and global warming. Science 308: 1753-1754.
- Bentsen M, Bethke I, Debernard JB, Iversen T, Kirkevag A, et al. (2013) The Norwegian earth system model, NorESM1-M—Part 1: Description and basic evaluation of the physical climate.Geosci. Model De 6: 687-720.
- Collins M, KnuttiR, ArblasterJ, Dufresne JL, Fichefet T, et al. (2013) Long-term climate change: Projections, commitments and irreversibility. IPCC AR5 WG1 2013 1045-1047.
- Dos Santos CA, Neale CM, Rao TV, Da Silva BB (2011) Trends in indices for extremes in daily temperature and precipitation over Utah, USA.IntJ Climatol31: 1813-1822.
- Dufresne JL, Foujols MA, Denvil S, Caubel A, Marti O, et al. (2013) Climate change projections using the IPSL-CM5 Earth System Model: from CMIP3 to CMIP5. Climate Dynamics 40: 2123-2165.
- Dunne JP, John JG, Adcroft AJ, Griffies SM, Hallberg RW, et al. (2012) GFDL’s ESM2 global coupled climate–carbon earth system models. Part I: Physical formulation and baseline simulation characteristics. J Climate 25: 6646-6665.
- Gebre SL, Ludwig F (2015) Hydrological response to climate change of the upper Blue Nile River Basin: based on IPCC Fifth Assessment Report (AR5).J Climatol Weather Forecasting 3: 2.
- Giorgi F, Coppola E, Solmon F, Mariotti L, Sylla MB, et al. (2012) RegCM4: Model description and preliminary tests over multiple CORDEX domains. Climate Research 52:7-29.
- Jones C, Hughes JK, Bellouin N, Hardiman SC, Jones GS, et al. (2011) The HadGEM2-ES implementation of CMIP5 centennial simulations.Geoscientific Model Development 4:543.
- Skamarock WC, Klemp JB, DudhiaJ, Gill DO, Barker DM, et al. (2005) A description of the advanced research WRF version 2 (No. NCAR/TN-468+ STR). National Center for Atmospheric Research Boulder Co Mesoscale and Microscale Meteorology Div.
Relevant Topics
- Atmosphere
- Atmospheric Chemistry
- Atmospheric inversions
- Biosphere
- Chemical Oceanography
- Climate Modeling
- Crystallography
- Disaster Science
- Earth Science
- Ecology
- Environmental Degradation
- Gemology
- Geochemistry
- Geochronology
- Geomicrobiology
- Geomorphology
- Geosciences
- Geostatistics
- Glaciology
- Microplastic Pollution
- Mineralogy
- Soil Erosion and Land Degradation
Recommended Journals
Article Tools
Article Usage
- Total views: 3630
- [From(publication date):
September-2017 - Nov 21, 2024] - Breakdown by view type
- HTML page views : 2870
- PDF downloads : 760

