Regional and Temporal Variations in the Prevalence of HCV among Hemodialysis Patients in Saudi Arabia
Received: 03-Mar-2016 / Accepted Date: 29-Mar-2016 / Published Date: 06-Apr-2016 DOI: 10.4172/2161-1165.1000235
Abstract
Hepatitis C infection among Hemodialysis (HD) patients is a recognized global problem. The incidence and prevalence of HCV in dialysis patients vary widely among geographical regions in the Kingdom of Saudi Arabia (KSA). However, the HCV incidence has marked decline in all regions within KSA. But it is noted that the risk of occasional nosocomial transmission remains. We intend to apply the Seemingly Unrelated Regression (SUR) models to develop a scientific strategy to estimate the future burden of HCV in dialysis units. These predictions may provide baseline information for disease management intervention and cost control. The model based predictions show that the decline in the HCV incidence which started in 2004 is projected to potentially reach zero by the year 2014.
Keywords: Hepatitis C infection; Regional variations; Seemingly unrelated regression; Prediction analysis; Models goodness of fit
164800Introduction
Infection with the hepatitis C virus (HCV) is the leading cause of chronic liver disease worldwide. With an estimated prevalence of 3% in the world population (around 170 million infected individuals), HCV heavily burdens public health [1]. An estimated 2-3% of the world’s population is living with hepatitis C virus (HCV) infection, and each year, >350000 die of HCV-related conditions, including cirrhosis and liver cancer. The epidemiology and burden of HCV infection varies throughout the world, with country-specific prevalence ranging from <1% to >10%. In contrast to the United States and other developed countries, HCV transmission in developing countries frequently results from exposure to infected blood in healthcare and community settings [1]. The World Health Organization (WHO) releases global estimates on the prevalence and burden of HCV infection [2].
Hepatitis C virus (HCV) infection is a significant problem in the management of hemodialysis patients. A high prevalence of HCV infection in hemodialysis patients has been reported. Risk factors such as the number of blood transfusions or duration on hemodialysis have been implicated.
Several studies documented that HCV infection is more common in dialysis patients than in healthy populations. The best data regarding prevalence among dialysis patients were provided by Dialysis Outcomes and Practice Patterns Study (DOPPS), which was a prospective, observational study that reported the prevalence of HCV among adult hemodialysis patients randomly selected from 308 representative dialysis facilities in France, Germany, Italy, Japan, Spain, the United Kingdom, and the United States [2]. The overall prevalence was 13.5% (compared with global prevalence in the general population of approximately 3%).
Several reports have documented the progressive increase in the prevalence of HCV among dialysis patients, in both Western and developing countries. A study in Syria reported that the overall prevalence of anti-HCV among HD patients was 48.9%; 24.4% in one center (Al-Mouassat Hospital) and 88.6% in the other (Kidney Hospital). It is interesting to see that there was a significant correlation between prevalence of anti-HCV and duration of HD. The prevalence was 36.7% for patients on HD for <3 years and 65% in patients on HD for >3 years (p < 0.05) [3].
Megmar et al. [4] reported that the HCV infection has declined in regions where the screening for anti-HCV in blood banks and hemodialysis-specific infection control measures were adopted. In Brazil, these measures were implemented in 1993 and 1996, respectively. Analysis of risk factors showed that length of time on hemodialysis, blood transfusion before screening for anti-HCV and treatment in multiple units were statistically associated with anti-HCV (p < 0.05) [5]. Studies by Espinosa et al. [6] and Natov et al. [7] showed a significant decline of hepatitis C infection in hemodialysis patients of Central Brazil, ratifying the importance of public health strategies for control and prevention of hepatitis C in the hemodialysis units. In addition, HCV infected hemodialysis patients have an increased risk of death when compared with those not infected [8].
Another study was conducted in Libya whose aim was to investigate the incidence and prevalence of HBV and HCV infection in the HD population, as well as risk factors for infection. All adult patients receiving maintenance HD (n = 2382) in Libyan dialysis centers (n = 39) were studied between May 2009 and October 2010. Patients who were seronegative for HBV and HCV (n = 1160) were followed up for 1 year to detect seroconversions. The prevalence of HBV ± HCV infection varied widely between HD centers from 0% to 75.9%. Wide variation in rates of newly acquired infections was observed between dialysis centers [9]. It is clear then that patients on maintenance HD in Libya have a high incidence and prevalence of HCV infection. The factors associated with HBV and HCV infection are highly suggestive of nosocomial transmission within HD units.
This paper has two objectives. Firstly; focusing on data from the Kingdom of Saudi Arabia, we quantify the regional and temporal variability in both the number of patients on hemodialysis (HD), and predict the number of HCV cases among them. Secondly; we use statistical prediction models to explore the pattern of increase (decrease) in the number of patients needing dialysis, and use these predictions to estimate the future count of HCV among HD patients. We summarize the results by constructing an-overall confidence limits on the perceived population prevalence, and focus on the regional variation in the prevalence of HCV among HD patients in Saudi Arabia. We develop a Seemingly Unrelated Regression (SUR) models to investigate regional and temporal variation in the prevalence of HCV among Saudi HD patients.
Methods
From the above studies we conclude that the main risk factors implicated for HCV infection among HD patients are:
The number of blood transfusions
The prevalence of anti-HCV antibodies increases with the number of units of blood products [5]. The risk of acquiring post transfusion HCV infection has declined. In one study, the risk was < 1 per 3000 units of blood products transfused [6]. Among hemodialysis patients, the decreased risk is due to both the screening of blood products for anti-HCV antibodies and to the decreased use of blood transfusion to treat anemia.
Dialysis vintage
The risk of seroconversion increases with time on dialysis. The interval since beginning dialysis has been reported to be significantly longer among anti-HCV-positive patients, compared with anti-HCVnegative patients, and the risk of HCV infection increases considerably after a decade of hemodialysis [10].
Mode of dialysis
Patients on peritoneal dialysis are at lower risk for HCV infection, compared with hemodialysis patients [7,10,11]. In a group of 129 anti- HCV-negative patients on chronic dialysis, for example, the rate of seroconversion was 0.15 per patient-year on hemodialysis, compared with 0.03 per patient-year on continuous ambulatory peritoneal dialysis (CAPD) [12]. In contrast to hemodialysis patients, the duration of peritoneal dialysis does not appear to be a risk factor for acquiring HCV infection [13,14]. Consistent with this observation are the findings from one Israeli study, in which, compared with peritoneal dialysis patients, the prevalence of HCV infection was higher among hemodialysis patients, and HCV-infected patients were treated longer than noninfected patients [13]. The majority of anti-HCV-positive CAPD patients may have acquired HCV infection while on hemodialysis
The prevalence of HCV infection in dialysis patients is quite variable. Several studies have been conducted in Saudi dialysis units. The data presented in (Table 1) support this claim. Summarizing the data we find that the prevalence is between 30% and 80%. This table is adapted from [14] and the references therein [15-32].
| (ID) Author, Year | # HD patients | % HCV patients and 95% CI |
|---|---|---|
| Ayoola et al. [18] | 74 | 42 (31-53) |
| Hussein et al. [19] | 67 | 40 (28-52) |
| Huraib et al. [20] | 1147 | 68 (65-71) |
| Ahmad et al. [21] | 92 | 82 (74-90) |
| Souqiyh et al. [28] | 1392 | 70 (68-72) |
| Al-Muhanna[23] | 125 | 43 (34-52) |
| Alshohaibet.al. [24] | 139 | 52 (44-60) |
| Bernieh et al. [25] | 94 | 60 (50-70) |
| Shaheen et al. [26] | 408 | 72 (68-76) |
| Omer et al. [27] | 149 | 85 (79-91) |
| Soyannwo et al. [28] | 97 | 51 (41-61) |
| Kumar [32] | 47 | 51 (37-65) |
| Souqiyyehetal. [33] | 6694 | 50 (40-60) |
| Saxena et al. [34] | 189 | 44 (73-51) |
| Al-Jiffrier al. [35] | 248 | 73 (67-70) |
| Kashem et al. [30] | 90 | 47 (37-57) |
| Almawi et al. [22] | 115 | 15 (8-22) |
| Karkar et al. [31] | 265 | 29 (24-34) |
Table 1: Adapted from Karkar [10]. HCV among HD patients in selected 18 studies.
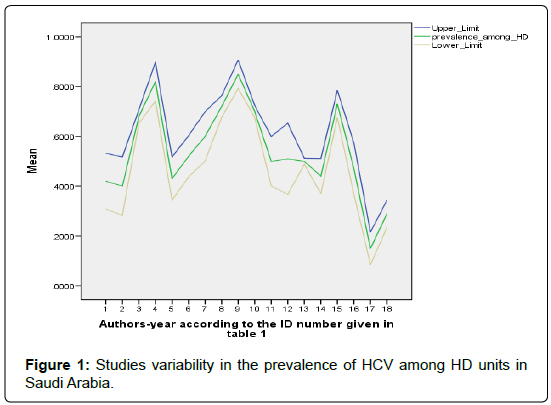
Data from the studies presented in Table 1, displayed in Figure 1, may be used to construct and overall 95% confidence interval on the HCV prevalence in dialysis units. This is given as (0.308, 0.810). This interval overlaps with the worldwide interval prevalence as reported in [10] (Figure 1).
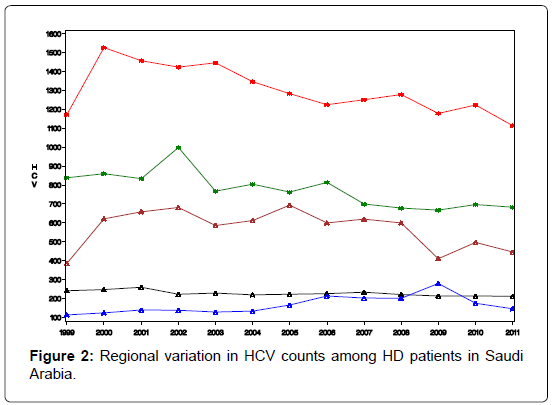
The Saudi data for the regional distribution of HCV among dialysis patients was obtained from the prospectively collected data by the Saudi Center for Organ Transplant that is reported yearly as SCOT annual report [32]. The database divides the transplant centers into five regions; central region (Riyadh & Qassim), western region (Jeddah and Makkah), eastern region (Dammam and Al-Khobar), northern region, and southern region. The number of HD patients and the count of HCV infected among them were reported for each region for the years 1999- 2011. These data will be used to train our prediction model, while data for the years 2012, 2013, and 2014 will be used for model validation. Figure 2 depicts the regional distribution of the HCV in dialysis patients over the period 1999-2011.
Results
Our prediction tool utilizes two equations with dependent variables (HD and HCV) that we consider as a group because they bear a close conceptual relationship to one another. Aside from this conceptual relationship, the two linear regression models have, outwardly, no connection with one another (Figure 2). Each equation models a different dependent variable and the independent variables in each equation need not be the same Zellner [33]. The two equations are:
HD = β01+ β11 Region+β21 Year +∈1
HCV = β02+ β12 Region+β22 Year +∈2
As can be seen from the above set-up the two equations appear unrelated, and we might be tempted to estimate the regression parameters independently, but in fact they are not. For this reason the system is referred to as a system of Seemingly Unrelated Regression (SUR) models. Of course, if the two equations actually are un-related, then we should estimate them separately. But it may be the case that there is a relation between the equations, brought forward by correlation between the two error terms. If the two error terms are correlated, then we can gain a more efficient estimator by estimating the two equations jointly, as was shown by Zellner [33]. If ∈1 is correlated with ∈2, then knowledge of ∈2 can help us predict the value of ∈1 efficiently. The estimation of these models is achieved quite easily using the Procedure “SYSLIN”, implemented in the SAS program [34].
Coding the independent variables:
Code year = Year -1999 +1


The Northern region is obtained when all the X’s are set to zero. The regression equations from the SUR are given as:
HD = -49.08 + 1624.77(X1) + 2530.31 (X2) +350.54 (X3) + 767.62 (X4) + 102.13 (code year) (1)
R2 = 0.949.
HCV = 227.35 + 611.15 (X1) + 1135.9 (X2) +61.5 (X3) + 403.7 (X4) -8.73 (code year) (2)
R2 = 0.966.
We produced predictions based on models (10) and (2) in Table 2. We use the concordance correlation coefficient introduced by Lin [35] as a measure of agreements between two sets of measurements, to assess the goodness of fit (GOF) of the prediction model. High agreement between the observed and the model based predicted counts would be an indicative of the reproducibility of the model. The measure of agreement is given by:

| Parameter | Observed #HD | Predicted #HD | Observed # HCV | Predicted # HCV |
|---|---|---|---|---|
| Mean (μ) | 1720 | 1720 | 608 | 608 |
| Standard deviation (s) | 1027 | 1000 | 424 | 417 |
| Pearson’s Corr.(r) | -0.974 | -0.983 | ||
| Concordance Corr.ρc | 0.974 | 0.982 |
Table 2: Summary statistics to test the model goodness of fit (Internal validity).
where r is the Pearson’s correlation between the observed and the model-based predicted counts, (μ0, μp) are the means of the observed and the model-based predicted counts, while (s0, sp) are their corresponding standard deviations. Note that r = ρc when μ0 = μp, and s0 = sp. Note that the sign of ρc, is the same as the sign of Pearson’s correlation coefficient. Close value of ρc to ± 1, indicate higher agreement among the observed and the predicted counts. From the summary statistics in Table 2, it can be seen that the models produced predicted counts that are in close agreement to the observed counts. We can also validate the model by comparing the observed counts in the validation set in the years (2012- 2014) with the predicted counts based on the SUR model in equations (1) and (2) (Table 3). For the HD counts, the concordance correlation between the observed counts in the years 2012-2014, and the model based predictions is ρc = 0.997, and for the HCV the corresponding concordance between the predicted counts and the observed counts is ρc = 0.995.
| Year | Region | Predicted HD | Predicted HCV |
|---|---|---|---|
| 2012 | Riyadh-Qassim | 3006 | 716 |
| 2012 | Jedda-Makka | 3911 | 1241 |
| 2012 | Eastern | 1731 | 167 |
| 2012 | Southern | 2148 | 509 |
| 2012 | Northern | 1381 | 105 |
| 2013 | Riyadh-Qassim | 3108 | 707 |
| 2013 | Jedda-Makka | 4013 | 1232 |
| 2013 | Eastern | 1833 | 158 |
| 2013 | Southern | 2250 | 500 |
| 2013 | Northern | 1482 | 96 |
| 2014 | Riyadh-Qassim | 3210 | 698 |
| 2014 | Jedda-Makka | 4115 | 1223 |
| 2014 | Eastern | 1935 | 149 |
| 2014 | Southern | 2352 | 491 |
| 2014 | Northern | 1585 | 88 |
Table 3: Model validation, validating data, 2012-2014.
Predicting the burden of HCV among dialysis patients: Ratio prediction
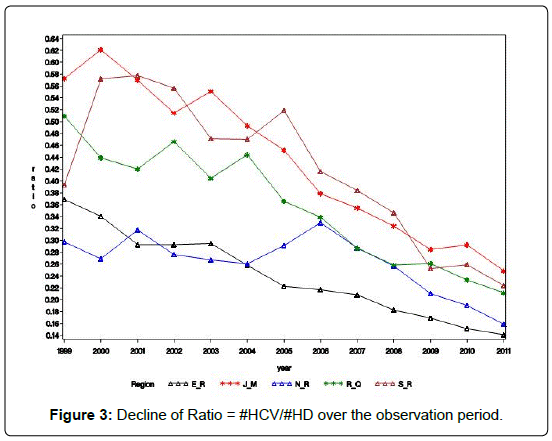
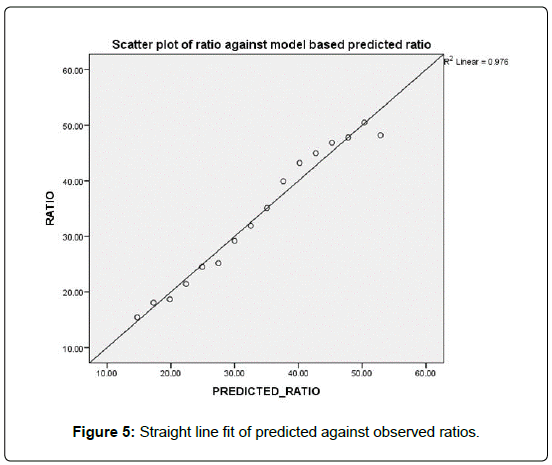
Alternative to the predictions models of counts, we may be interested in predicting the percentage of HCV patients among the dialysis patients. Figure 3 shows that the rate of decline of this ratio # HCV/# HD across the 5 regions is almost the same (Figures 3-5).
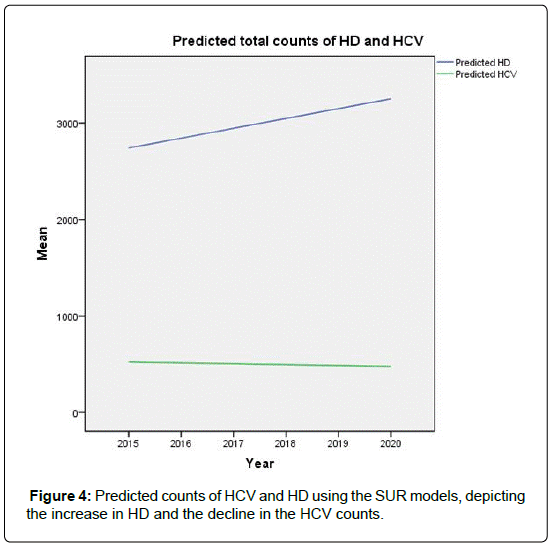
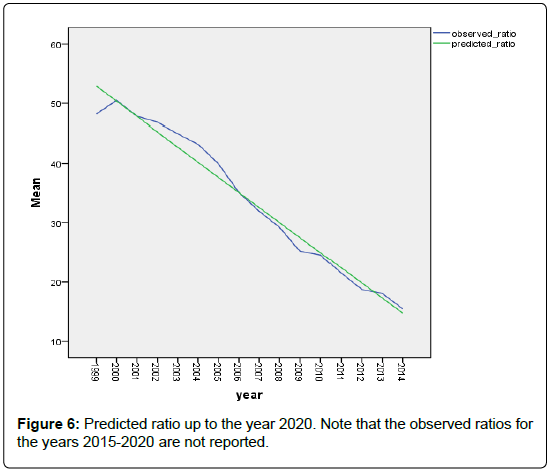
Figure 5 shows that the linear relationship between the predicted ratio and the observed ratios. The concordance correlation ρc = 0.988 indicating the excellent goodness of fit of the model to the data, and its high predictability. In Figure 6 we show the models based decline in the predictions of the future ratios.
Predicted ratio = 55.44 – 2.544 X year code.
Discussion
We have documented the significant variation in the rate of HCV in dialysis units among the regions in Saudi Arabia. We noted also that, starting from the year 2004, there has been a steady decline in this incidence in all regions. This decline coincides with the worldwide trend, and is attributed to the improved infection control practices, screening for blood products, and the strict adherence to universal hygiene precautions. Assuming that the infection control practices in Saudi Arabia will remain in place, we predict, based on the regression models introduced here, that the prevalence of HCV in dialysis units would be near zero by the year 2019.
There are two limitations to our study; firstly potential risk factors such as gender, age, and HBV or HIV infections were not investigated. Secondly; our study is ecological meaning that the analyses used retrospective information from a national surveillance system of registration. Therefore, we should cautiously interpret the results, and one should not be tempted to extend these findings to risk prediction at the individual subject level.
Conflict of interest
The Authors declare that there is no conflict of interest regarding the publication of this article.
References
- Work Group membership (2008) KDIGO clinical practice guidelines for the prevention, diagnosis, evaluation and treatment of hepatitis C in chronic kidney disease. Kidney International 73: S1-S99.
- Fissell R, Bragg-Gresham J, Woods J, Jadoul M, Gillespie B, et al. (2004) Patterns of hepatitis C prevalence and seroconversion in hemodialysis units from three continents: the DOPPS. Kidney International 65: 2335-2342.
- Othman B, Monem F (2001) Prevalence of antibodies to hepatitis C virus among hemodialysis patients in Damascus, Syria. Infection 29:262-265.
- Carneiro MAS, Martins RMB, Teles SA, Silva SA, Lopes CL, et al. (2001) Prevalence and Risk Factors in Hemodialysis Patients in Central Brazil: a Survey by Polymerase Chain Reaction and Serological Methods. Mem Inst. Oswaldo Cruz, Rio de Janeiro, Vol. 96: 765-769.
- Pereira BJ, Levey AS (1997) Hepatitis C virus infection in dialysis and renal transplantation. Kidney International 51:981.
- Espinosa M, Martin-Malo A, Ojeda R (2004) Marked reduction in the prevalence of hepatitis C virus infection in hemodialysis patients: causes and consequences. Am J Kidney Dis 43:685-689.
- Natov SN, Lau JY, Bouthot BA (1998) Serologic and virologic profiles of hepatitis C infection in renal transplant candidates. New England Organ Bank Hepatitis C Study Group. Am. J. Kidney Dis31:920-927.
- Fabrizio F, Poordad F, Martin P (2002) Hepatitis C infection and the patients with end-stage renal disease. Hepatology 36: 3-10.
- Alashek(2012) Hepatitis B and C infection in hemodialysis patients in Libya: prevalence, incidence and risk factors. BMC Infectious Diseases12:265.
- Jadoul M (2000) Epidemiology and mechanisms of transmission of the hepatitis C virus in haemodialysis. Nephrol Dial Transplant 15: 39-41.
- Bianco A, Bova F, Nobile CG, Pileggi C, Pavia M (2013) Healthcare workers and prevention of hepatitis C virus transmission: exploring knowledge, attitudes and evidence-based practices in hemodialysis units in Italy. BMC Infect Dis 13: 76.
- Girou E, Chevaliez S, Challine D, Thiessart M, Morice Y, et al. (2008) Determinant roles of environmental contamination and noncompliance with standard precautionsin the risk of hepatitis C virus transmission in a hemodialysis unit. Clin Infect Dis 47: 627-633.
- Mbaeyi C, Thompson ND (2013) Hepatitis C virus screening and management of seroconversions in hemodialysis facilities. Semin Dial 26: 439-446.
- Karkar A (2007) Hepatitis C in dialysis units: The Saudi experience. Hemodialysis International11: 354-367.
- Ayoola EA, Huraib S, Arif M (1991) Prevalence and significance of antibodies to hepatitis C virus among Saudi hemodialysis patients. J Med Virol35: 155-159.
- Hussein MM, Mooij JM, Roujouleh H, El-Sayed H (1994) Observations in a Saudi-Arabian dialysis population over a 13-year period. Nephrol. Dial. Transplant. 1994; 9: 1072-1076.
- Huraib S, Al-Rashed R, Aldrees A, Aljefry M, Arif M, et al. (1995) High prevalence of and risk factors for hepatitis C in hemodialysis patients in Saudi Arabia: A need for new dialysis strategies. Nephrology Dial Transplant 10:470-474.
- Ahmad MS, Mahtab AM, Al Shaibi A, Amin Tashkandy M, Kashreed MSD, et al. (1995) Prevalence of antibodies against the hepatitis C virus among voluntary blood donors at a Makkah hospital, Saudi Arabia. Saudi J Kidney Dis Transplant 6: 122-124.
- Almawi WY, Qadi AA, Tamim H (2004)Sero-prevalence of hepatitis C virus and hepatitis B virus among dialysis patients in Bahrain and Saudi Arabia. Transplant Proc36: 1824-1826.
- Al-Muhanna FA (1995) Hepatitis C virus infection among hemodialysis patients in the eastern region of Saudi Arabia. Saudi J Kidney Dis Transplant6: 125-127.
- Shohaib SSA, Abdelaal MA, Zawawi TH, Abbas FM, Shaheen FAM, et al. (1995) The prevalence of hepatitis C virus antibodies among hemodialysis patients in Jeddaharea, Saudi Arabia. Saudi J Kidney Dis Transplant6: 128-131.
- Bernieh B, Allam M, Halepota A, Mohamed AO, Parkar J, et al. (1995) Prevalence of hepatitis C virus antibodies in hemodialysis patients in Madinah Al Munawarah. Saudi JKidney Dis Transplant 6: 132-135.
- Shaheen FAM, Huraib SO, Al-Rashed R (1995) Prevalence of hepatitis C antibodies among hemodialysis patients in the Western Province of Saudi Arabia. Saudi J Kidney Dis. Transplant6: 136-139.
- Omer MN, Tashkandy MA, El Tonsy AH (1995) Liver enzymes and protein electrophoreticpatterns in hemodialysis patients with antibodies against the hepatitis C virus. Saudi J KidneyDis. Transplant 6: 163-166.
- Souqiyyeh MZ, Shaheen FAM, Huraib SO, Al-Khader AA (1995)The annual incidence of seroconversion of antibodies to the hepatitis C virus in the hemodialysis populationin Saudi Arabia. Saudi J Kidney Dis Transplant 6:167-173.
- Soyannwo MA, Khan N, Kommajosyula S (1996) Hepatitis C antibodies in hemodialysis and pattern of end-stage renal failure in Gassim, Saudi Arabia. Afr. J Med.Sci25: 13-22.
- Kumar R (1997) Hepatitis C virus infection among hemodialysis patients in the Najran Region of Saudi Arabia. Saudi J Kidney Dis Transplant8: 134-137.
- Souqiyyeh MZ, Al-Attar MB, Zakaria H, Shaheen FAM (2001) Dialysis centers in the Kingdom of Saudi Arabia. Saudi J Kidney Dis Transplant12: 293-304.
- Saxena AK, Panhotra BR, Sundaram DS (2003) Impact of dedicated space, dialysis equipment, and nursing staff on the transmission of hepatitis C virus in a hemodialysis unit of the Middle East. Am. J Infect Control 31: 26-33.
- Kashem A, Nusairat I, Mohamad M (2003) Hepatitis C virus among hemodialysis patients in Najran: Prevalence is more among multi-center visitors. Saudi J Kidney Dis Transplant 14: 206-211.
- Karkar A, Abdulrahman MR, Ghacha R, Tahir QM (2006) Prevention of viral hepatitis in hemodialysis units: The value of isolation. Saudi J Kidney Dis Transplant17:183-188.
- Al-Jiffri AMY, Fadeg RB, Ghabrah TM, Ibrahim A (2003) Hepatitis C virus infection among patients on hemodialysis in Jeddah: A single center experience. Saudi J Kidney Dis Transplant. 14: 84-89.
- Zellner A (1962)An efficient method of estimating seemingly unrelated regression equations and tests for aggregation bias. Journal of the American Statistical Association 57: 348-368.
- Lin LIK (1989) A concordance correlation coefficient to evaluate reproducibility, Biometrics45: 255-268.
Citation: Shoukri M, Sebayel MA, Abaalkhail F, Elbeshbeshy H, Abdelfatah M, et al (2016) Regional and Temporal Variations in the Prevalence of HCV among Hemodialysis Patients in Saudi Arabia. Epidemiology (Sunnyvale) 6:235. DOI: 10.4172/2161-1165.1000235
Copyright: © 2016 Shoukri M, et al. This is an open-access article distributed under the terms of the Creative Commons Attribution License, which permits unrestricted use, distribution, and reproduction in any medium, provided the original author and source are credited.
Share This Article
Recommended Journals
Open Access Journals
Article Tools
Article Usage
- Total views: 10924
- [From(publication date): 4-2016 - Apr 02, 2025]
- Breakdown by view type
- HTML page views: 10113
- PDF downloads: 811

