Reforming and Desulphurization of Syngas by 3D-printed Catalyst Carriers
Received: 30-Sep-2017 / Accepted Date: 06-Oct-2017 / Published Date: 12-Oct-2017 DOI: 10.4172/2576-1463.1000172
Abstract
Sulfur and CH4 are two important ingredients in synthesized gaseous fuels and they must be removed before use in solid oxide fuel cells. This study compares the gasification of mixtures of waste paper and plastics and with that for wood. The produced fuel (syngas), which is rich in H2, CH4 and CO, is reformed and desulfurized using stacks of 3D-printed catalyst carriers, which are made using thee ceramic powders (ZnO, θ-Al2O3, and CaCO3). The pyramid-shaped carrier features high porosity (50%) and good strength (ca. 6 MPa). It carries fine-grain Ni+CeO2 catalyst and increases the retention of the syngas. The performance of the thee carriers is determined with respect to the gas content (including H2, CH4, CO and H2S) in the syngas.
Keywords: Gasification; Reforming; Waste; 3D printing; Paper; Plastics
23170Introduction
Due to the increasing demand for efficient power, sustainable energy technologies are being developed to meet the requirements relating to cost, corrosion of power generators and air pollution. In order to minimize the costs that are associated with transportation, there is an increasing interest in producing electricity locally by locating the electricity supply close to end-users [1]. The price of fuel and other issues (e.g. renewability) are important for the development of sustainable energy.
The gasification of solid fuels is an appealing and synergistic technology that addresses the issues [2]. Waste materials, including waste paper, plastics and food, are also increasing because of the massive biomass that is produced by populations in megacities [3]. There are advantages in using Municipal Solid Waste (MSW) as a fuel, including a reduction in greenhouse gases gases emissions, reduced landfill and savings in transportation costs.
Several MSWs have been used as fuels for SOFC’s have been investigated in previous studies [4]. The gasification of recovered plastics results in several operational problems, such as the formation of tar, which is deposited inside the reactor. The syngas that is produced from waste paper normally contains H2S, which is a major cause of the corrosion of metal parts.
Ahmed et al. [5] reported a possible interaction mechanism in a pyrolyzing atmosphere, wherein PE acts as a hydrogen donor to radicals on the macromolecules, which stabilizes these radicals and gives a higher yield of hydrocarbon species. However, gasified syngas from paper with a low heat value consists mainly of CO and CO2, with a smaller tar content and fewer inorganic impurities [4]. The gaseous content of syngas that is produced by the gasification of plastics and paper is low in H2 and rich in CxH2x+2 and CO. The reformation of the syngas, especially the hydro-carbon gases (e.g. CH4 or C2H6), can produce 50-60% of H2, depending on the ratio and types of catalyst and the thermal processing parameters. After filtering, reformation and desulfurization, the syngas is cleaned and can be used as a fuel for solid oxide fuel cells (SOFCs) [2,6].
Additive Layer Manufacturing (ALM), which is also called 3D-printing (3DP), is a technique that has been developed in the past decade. 3D-printing allows rapid prototyping, less waste, short lead-times and a lower environmental impact [7]. For components with complicated shapes, or which must be produced in small quantities 3DP ALM technology is a good choice. In general, the best ALM technology for porous structures is the Fused Direct Method (FDM), which uses ceramic-based feedstocks [8]. FDM has been demonstrated to have low cost, better interconnectivity (i.e. porosity control) and the products have stronger mechanical properties than those made by the other technologies. Complex parts that are fabricated using this system are highly reproducible and their pore sizes are controllable [9].
This study designs a laboratory-scale heterogeneous catalytic system for the reformation and desulfurization of syngas. The system consists of sintered θ-Al2O3, ZnO and CaCO3 supports (i.e carrier of catalyst), on which CeO2 and NiO are impregnated via a solutionprecipitation process. A spiral pyramid of porous ceramic carriers is made using FDM to allow a better gas flow patterns, which increases the residence time for the syngas in the catalyst carrier. Aa porous catalytic structure with acceptable mechanical strength, a desirable surface-to-volume ratio and controlled porosity is implemented for the reformation and desulfurization of e syngas that is synthesized from a mixture of waste paper and plastics.
Experimental And Materials
MSW wastes
Waste paper and waste plastics were collected from McDonalds and sliced into small pieces of less than 5.0 mm. Both waste materials were mixed together in a ratio 0% to 100%, in 20% intervals and were named PPxx, to signify the percentage of plastics in the mixture. The analysis of the proximate properties of the wastes and wood used ASTM of D3173, D3175, D3174 and D2015 [10-13]. The results are shown in Table 1. The produced raw fuel contained H2 40.8%, CH4 33.0%, CO19.9% and H2S 38.5 ppm.
| RT-800°C | Paper | Plastics | Wood |
|---|---|---|---|
| Moisture | 4.50% | 0.20% | 7.60% |
| Fixed carbon | 14.80% | 1.30% | 25.50% |
| Ash (wt%) | 0.70% | 0.50% | 0.90% |
| Volatile | 84.50% | 98.00% | 73.60% |
| LHV (MJ kg-1) | 20.4 | 41.1 | 19.6 |
1. The source of paper and plastics is sampled from the paper cups and caps of McDonald.
2. Wood chips is cedar sampling from local area
Table 1: Proximate analysis of waste paper, plastics*1 and wood*2.
Synthesis of θ-Al2O3, ZnO and CaCO3 feedstocks
Thee ceramic powders were used: CaCO3 (NACALAI TESQUE, 99.5%, Japan) and ZnO and θ-Al2O3 (APA-0.2, Ceralox, US). The powder/binder feedstocks were formulated according to the specifications for precision injection molding [14]. The binders were PP (Polypropylene, PC366-5, LCY Corp, Taiwan), EVA (Ethylene Vinyl Acetate, UE633, USI Corp, Taiwan) and PW (Paraffin Wax, 140F, Taiwan Wax, LTD., Taiwan). The interfacial agent was SA (Stearic Acid, Acros, US). Both PP and EVA formed the backbone polymers and PW served as plasticizer. The solid loading for the thee feedstocks was 40 vol%. The detail of the kneading and 3D printing process used the same process as our previous work [14,15]. A catalyst carrier with a spiral-pyramidal shape is shown in Figure 1a.

Figure 1a: Picture of a pyramid catalyst carrier.
Gasification of waste mixture
The fixed-bed gasifier consisted of a quartz cylindrical reactor, (with an inner diameter of 90 mm and a length of 300 mm), a heating furnace, an air pump and a tar collector. For the gasification operation, 100 g of the waste mixture was placed in the gasifier. The gasifier was then heated to 800°C at a rate of 20°C min-1 with an air flow rate of 200 ml min-1. The gas volumetric yield and energy yield rate, the tar yield and various gas concentrations of CO, CO2, CH4 and H2 for the gas that was produced were then measured after holding for 5 min at 800°C. Tar was collected in two stages: firstly in a filter flask and then by a cold trap with glass fibers. The mass of tar was measured using the increments on the filter flask, the quartz tube and the fibers.
Preparation of reforming catalyst
Thee reforming catalysts were made. The preparation of the Ni- CeO2/carrier used two steps. ZnO was taken as an example. CeO2 was first coated onto a porous ZnO carrier by impregnating 1.0 M Ce(NO3)3 aqueous solution and calcining at 500°C for 1 h. CeO2/ZnO was then impregnated with 1 M Ni(NO3)2•6H2O alcohol solution and calcined at 500°C for 1 h to obtain the NiO-CeO2/ZnO (also named ZP) catalyst carrier. The mass ratio of NiO to CeO2 and carrier was 0.3:0.7:10.0, as measured by Electron Dispersive X-ray Spectroscopy (EDS).
Property characterization
SEM analysis: EDS analysis and the capture of SEM images used a scanning electron microscope (JSM-6510, JEOL, Japan). EDS analysis was used to determinate the elemental content of the ash and the catalyst carriers. SEM was used to observe the surface morphology of the pores and the catalysts.
Gas chomatography: The gaseous products - CO, CO2, CH4 and H2 - were analyzed using two separate chomatography/thermal conductivity detector analyzers (GC/TCD, 8900 GC, China Chomatography Co., Taipei, Taiwan). The GCs had the same packing for the columns (60/80 Carbonxen-1000, 15 ft × 1/8 in SS, Sigma-Aldrich, Saint Louis, MO, USA). Different carrier gases - helium (He) for the analysis of CO and CO2 and argon (Ar) for H2 - were used. The concentrations of every gaseous species were calculated after the calibration curves of each gas species are obtained.
Mechanical property: A four-point (4-pt) bending test was used to measure the flexure strength of sintered sample and calculations used CNS12701 [16], as below. The sizes of the test bars were 4 mm, 3 mm and 40 mm. The strain rate for the load cell was 0.5 mm min-1.
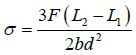 (1)
(1)
where σ is the fracture stress (MPa), F is the load (N) at the loading points, L1 is the length of the upper support span (mm), L2 is the length of the lower support span (mm), b is the width of test beam (mm) and d is the depth of the tested beam (mm);
Density measurement: The bulk density Db (g cm-3) of the sintered sample was calculated using the Archimedes’ method. The relationship is:
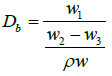 (2)
(2)
where w1 is the mass of the dried sample in air (g), w2 is the mass of the wet sample in air, w3 is the mass of the sample immersed in water and is the density of water.
Reforming and desulfurization: A stack of Ni-CeO2/catalyst carriers of 5.0 g were placed in a quartz tube and fixed with glass fiber (Figure 1b) at both ends. The flow distance for the syngas though the catalyst carrier stack was ca. 2.0 cm. The catalysts then reformed CH4 and other hydrocarbon fuel into H2 and CO at 800°C. The carriers were also used for the adsorption of H2S. The H2S concentration was measured using a gas detection tube (Gastec Co., Japan), that contained a chemical reagent that indicated the H2S concentration when the reagent was exposed to a 100 ml gas flow, which was driven using a hand pump. The measurement ranges for each H2S gas tube were 10- 4000 ppm, 1.0-240 ppm, or 0.05-4.0 ppm.

Figure 1b: Schematic diagram of reforming test using a stacks of catalyst carrier in a glass tube (2.2 cm dimeter) located at the center of reactor.
Results And Discussion
Properties of waste materials
The results for the proximate analyses of two city waste materials and a comparable case for wood are shown in Table 1. The amount of moisture in waste paper is 4.5 wt%, which is close to that of the wood. The waste plastics contain only 0.2 wt% moisture because they have a hydrophobic surface. Metal scraps and ceramics constitute some (2- 5%) of the MSW for Taipei and are the major source of ash. However, the ash content for waste paper and waste plastic are low, at only 0.8% and 0.5%, respectively. Plastic waste materials are also characterized by a very low content of fixed carbon. In contrast, similarly to wood, waste paper has a 14.8% fixed carbon content and a lower heat value (ca. 20 MJ kg-1), but the heat value of the waste plastics is 41.1MJ•kg-1. The high volatility and low moisture/ash content for waste paper and plastics render them suitable for gasification and the production of fuel gas for SOFCs.
Co-gasification of Plastics and Paper
The volumetric yield and energy yield for gasification of plastics and paper (PP) mixtures at 800°C are shown in Figure 2a. The volumetric yield was measured using the volume of syngas that is produced using heat treatment of 1.0 min by water the displacement method. Pure plastic waste has a higher LHV and does not have a good energy yield or syngas yield because of tar production. The tar that is produced by plastics is nearly 60%, as shown in Figure 2b.

Figure 2: (a) Syngas yield rate and energy yield rate and (b) tar production in total volatile plotted against percentage of plastics to PP mixture.
The presence of different amounts of plastics in the mixtures increases both rates. The syngas yield and energy yield reach a maximum either at 1441 ml min-1 (PP60) or 14.5 kJ min-1 PP40. However, when the amount of waste plastics increases, the tar production increases and the energy yield is decreased. A 5% to 10% reduction in the tar content is achieved if 40-60% plastic materials are present in the mixtures, compared to the values for tar production for an average weight (bold solid line) of waste paper and plastics.
Figure 2 shows that the presence of plastics greatly increases the energy gain from the waste mixture. In other words, there is a synergistic effect between plastics and paper during the gasification of the mixture. The optimized PP40, in terms of energy yield from the mixtures, was used for the following reforming and desulfurization tests.
Characterization of Carrier and Catalyst
Sintering properties of the 3DP ceramic carrier: This study produces a catalyst carrier with high porosity and appropriate strength. Thee oxides were made into test bars (4 x 3 x 40 cm3) to test the sintering behavior at 800°C–1300°C. The data for the relative sintered densities is shown in Figure 3, which shows that there is a two-stage sintering process for different sintering rates. The first stage at a lower rate changes to higher rate at 1100°C, 1200°C, and 1100°C for the θ-Al2O3, ZnO and CaO test bars, respectively. The turning-point temperature (T0) represents the starting point of sintering. The pores do not grow significantly at T0, but begin to exhibit necking between the ceramic particles. Therefore, the porosity remains high and the fracture strength increases because there is an increase in the neck area between the particles. Therefore, sintering was subsequently performed using selected temperatures for 1-8 h to determine how the density (porosity) and flexure strength changes with sintering time.

Figure 3: Relative densities of θ-Al2O3, ZnO (ZP) and CaO feedstocks in testbar shape plotted against sintering temperature held for 1 h.
The density of each sintered sample is shown in Figure 4. From the relative sintered densities, the open porosities for the samples can be calculated. The porous samples (test bars) have a porosity of 68% to 40%. In order to maintain a porosity of 48% for the thee ceramic samples and to determine the effect of the catalyst, final sintering times of θ-Al2O3, ZnO and CaO of 4, 1 and 8 h, were respectively used. The flexure strength of the samples is in the range 6.5 ± 1.0 MPa.

Figure 4: Relative densities of the test bars made from θ-Al2O3, ZnO, and CaO feedstocks plotted against sintering time at 1100°C, 1200°C, and 1100°C respectively. The dot line is selected at 48% relative density.
Microstructure of sintered carrier: SEM images of the microstructure (Figure 5) show a high porosity of ~52% and two sizes of pores for the thee carriers. The ceramic carriers were additive manufactured using FDM after de-binding of the polymeric binders. Because the low molecular-weight components (PW and SA) are removed by solvent de-binding, small, sub-micrometric open pores of less than 0.5 μm form. The pores are connected to the sample surface by the capillaries that are produced by the removal of the high-molecular-weight PP/EVA during thermal de-binding [15]. Two pores sizes - a sub-micron pore and micrometric capillary and with a high (~50%) open porosity - are seen in the microstructure (Figure 6).

Figure 5: Average flexural strength of the test bars made from θ-Al2O3, ZnO, and CaO feedstocks plotted against sintering time at 1100°C, 1200°C, and 1100°C respectively. The dot line is the acceptable strength of 3 MPa for use as a catalyst carrier.

Figure 6: SEM micrographs showing the pore structures of sintered (a) ZnO (b) θ-Al2O3, and (c) CaO carrier prepared from feedstocks.
Figure 7 shows a typical case for a coated catalyst particle on the surface of ZnO carrier. The image shows a homogeneous coating of CeO2 and NiO grains and in sizes of about 0.4-0.6 μm and 0.1-0.2-0.1 μm, respectively. The shape of the catalysts is almost spherical with a narrow distribution of typical coating on the thee oxide carriers.

Figure 7: SEM micrograph illustrating the CeO2 and NiO catalyst particles (by EDS) on ZnO carrier.
Effects of reforming and desulfurization
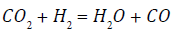
NiO is reduced in reducing atmosphere at ≥ 450°C [4]. After removal of the tar, the syngas was reacted with the catalyst, Ni-CeO2, on the carriers as:
 (3)
(3)
The CH4 and CO2 in syngas are reformed to H2 and CO in the presence of the catalyst at high temperatures. The results (Table 2) show that the content of CH4 is reduced for θ-Al2O3, ZP and CaO carriers from 33% to 10.5%, 15.4% or 2.8%, respectively. The lowest concentration of CH4 is achieved by reforming with the Ni-CeO2/ CaO. H2 content increases from 40.8% to 54.3%, 50.9% and 47.1%, respectively. For the same mass of catalyst, the Ni-CeO2/θ-Al2O3 reforms the syngas with the highest concentration (54.3%) of H2. This may be due to the fact that the θ-Al2O3 carrier has a higher specific surface area than the CaO and ZnO carriers.
| Catalyst carrier | H2 | CH4 | CO | CO2 | H2S | BET of absorbent (m2 g-1) |
|---|---|---|---|---|---|---|
| (Raw Gas) | 40.80% | 33.00% | 19.90% | 6.30% | 38.5 ppm | - |
| Ni-CeO2/θ-Al2O3 | 54.30% | 10.50% | 16.80% | 2.60% | 8.2 ppm | 7.72 |
| Ni-CeO2/ZnO | 50.90% | 15.40% | 23.50% | 3.20% | 0.9 ppm | 1.02 |
| Ni-CeO2/CaO | 47.10% | 2.80% | 31.20% | 8.50% | 2.8 ppm | 3.26 |
| Ni-CeO2/ZnO and CaO | 52.50% | 3.90% | 27.30% | 5.60% | 0.8 ppm | - |
Table 2: Gas compositions of the syngas from the gasification of PP40 using 5 g catalyst carriers in different catalytic conditions.
It is also noted that the Ni-CeO2/CaO shows an opposite change in the concentration of CO2. Udomsirichakorn et al. [17] reported that CO2 is captured by CaO via a carbonation reaction, to form CaCO3. As a result, this reduces CO2 partial pressure to reverse the water-gas-shift reaction as:
 (4)
(4)
This increases H2 production because of Le Chatelier's principle. However, CO2 concentration may also be increased by a decomposition reaction forCaCO3 at 800°C, which has a decomposition temperature of 650°C [4].
The catalyst, Ni-CeO2/ZnO (ZP), adsorbs significant amounts of H2S, which produces a reduction from 38.5 ppm to 0.9 ppm (Table 2). In comparison, the desulfurization result for Ni-CeO2/θ-Al2O3 shows a smaller decrease for H2S, from 38.5 ppm to 8.2 ppm.
The specific surface areas (BET) of the sintered θ-Al2O3, ZnO, and CaO carriers that are prepared from their feedstocks are 7.72 m2 g-1, 1.02 m2 g-1 and 3.26 m2 g-1, respectively. Although the specific surface area of ZnO is the smallest of the oxides, the absorption of H2S is the best, possibly because there is a better affinity to the gas-solid reaction for H2S with the ZP.
A combination of ZP and CaO catalyst carriers was also tried, which produced a synergetic effect of reducing the concentrations of CH4 and H2S. Table 2 shows that the H2S concentration is lowest for the same amount of 5.0 gm catalyst carrier. When the raw syngas is passed though Ni-CeO2/CaO, the concentration of CO2 decreases because of a carbonation reaction and triggers a reverse water-gas-shift reaction to form H2 and CO2. For the alternative carrier used in this test, the syngas undergoes a reaction process. As a result, the concentration of H2 is higher than that for the use of CaO or ZnO as the carrier. A decrease in the concentration of CH4 and H2S is achieved by using a combination of CaO and ZnO catalyst carriers.
Summary And Conclusion
The syngas is prepared by gasification and reformation and there is an improvement in the recovery of energy, a reduction in the concentration of CH4 to 3% a significant increase in H2 content to more than 47% and in de-sulfurization to a level of less than 1.0 ppm. The syngas is obtained from a mixture of waste paper and plastics.
40% plastic waste in the waste mixture (PP40) significantly reduces tar content to less than 5% and increases the recovered energy when it is gasified. The peak energy yield for PP40 is 14.5 kJ min-1. However, the highest syngas yield is 1441 ml min-1 for the PP60 mixture.
The sintering properties of porous ceramic carriers are determined and it is found that the appropriate sintering temperature for the feedstocks, θ-Al2O3, ZnO and CaO, are 1100°C, 1200°C and 1250°C, respectively. The flexural strength of θ-Al2O3, ZnO and CaO after sintering for 1, 4, or 8 h is about 6.5 MPa is sufficient for use as a catalyst carrier (Figure 5).
After reformation by the catalyst, the composition of the syngas changes. CH4 concentration decreases from 33% to <4% and the concentrations of both CO and H2 increase to >27% and >47%, respectively. After the syngas passes though different catalysts at 800°C, the concentrations of H2S is reduced from 38.5 ppm to 2S and reforms CH4 most effectively. The quality of the syngas is sufficient for use in a SOFC.
Acknowledgement
The authors thank the funding given by MOST 104-2218-E-002-009 and the free offer of using GC instrument by Prof. C.Y. Chang at Dept. Environment Engineering, National Taiwan University.
References
- Wei WCJ (2013) Fundamental and technologies of solid oxide fuel cells. Portable SOFCs, Gau-Li Publishing, New Taipei, Taiwan.
- Chandran R (2015) Gasification having integrated fuel cell power generation. US patent 8,968,433 B2.
- Taiwan EPA (2016) Yearbook of environmental protection statistics. Taiwan EPA, Taipei, Taiwan.
- Ke SY, Chen YY, Wei WCJ (2017) Gasification and syngas reforming of city waste papers for solid oxide  fuel cells. Innov Ener Resear 6: 171.
- Ahmed II, Nipattummakul N, Gupta AK (2011) Characteristics of syngas from co-gasification of polyethylene and woodchips. Appl Energ 88: 165-174.
- Koike M, Ishikawa C, Li D, Wang L, Nakagawa Y, et al. (2013) Catalytic performance of manganese-promoted nickel catalysts for the stream reforming of tar from biomass. Fuel 103: 122-129.
- Baufeld B, de Best OV, Gault R (2010) Additive manufacturing of Ti-6Al-4V components by shaped metal deposition: Microstructure and mechanical properties. Mater Design 31: 106-111.
- Zocca A, Colombo P, Gomes CM, Gunster J (2015) Additive manufacturing of ceramics: issues,
- Yen HJ, Tseng CS, Hsu SH (2009) Evaluation of chondrocyte growth in the highly porous scaffolds made by Fused Deposition Manufacturing (FDM) filled with type II collagen. Biomedical Microdevices 11: 615-624.
- ASTM. Standard Test Method for Moisture in the Analysis Sample of Coal and Coke. American Society for Testing and Materials, D3173.
- ASTM. Standard Test Method for Volatile Matter in the Analysis Sample of Coal and Coke. American Society for Testing and Materials, D3175.
- ASTM. Standard Test Method for Ash in the Analysis Sample of Coal and Coke from Coal. American Society for Testing and Materials, D3174.
- ASTM. Standard Test Method for Gross Calorific Value of Coal and Coke by the Adiabatic Bomb Calorimeter, D2015.
- Wu RY, Wei WCJ (2000) Torque evolution and effects on alumina feedstocks prepared by various kneading sequence. J Europ Ceram Soc 20: 67-75.
- CNS. Method of test for flexural strength modulus of rupture of high performance ceramics. 12701-1990.
- Fan NC, Wei WCJ, Liu BH, Wang AB, Luo LC (2016) Ceramic feedstocks for additive manufacturing. Conference of 3D printing technology, IEEE-ICIT-2016 at Taipei, Taiwan, ROCCNS 12701.
Citation: Chen KY, Chen YY, Wei WCJ (2017) Reforming and Desulphurization of Syngas by 3D-printed Catalyst Carriers. Innov Ener Res 6: 172. DOI: 10.4172/2576-1463.1000172
Copyright: ©2017 Chen KY, et al. This is an open-access article distributed under the terms of the Creative Commons Attribution License, which permits unrestricted use, distribution, and reproduction in any medium, provided the original author and source are credited.
Select your language of interest to view the total content in your interested language
Share This Article
Recommended Journals
Open Access Journals
Article Tools
Article Usage
- Total views: 2872
- [From(publication date): 0-2017 - Jul 03, 2025]
- Breakdown by view type
- HTML page views: 1996
- PDF downloads: 876