Research Article Open Access
Recent Trends in Soil Temperature Under Arid Agro-Ecosystem in Kuwait as a Prelude to the Gulf Region: Can Root-Zone Soil Temperature Be Predicted from Ambient Air Temperature?
Abdirashid AE1* and Hassan Al-Dashti21Department of Environmental Technology Management, College of Life Sciences, Kuwait University, Kuwait
2Department of Meteorology, Directorate General of Civil Aviation, Kuwait
- *Corresponding Author:
- Abdirashid AE
Department of Environmental Technology Management
College of Life Sciences, Kuwait University
Kuwait
Tel: 96524988888
E-mail: a.elmi@ku.edu.kw
Received date: January 29, 2017; Accepted date: February 07, 2017; Published date: February 14, 2017
Citation: Abdirashid AE, Al-Dashti H (2017) Recent Trends in Soil Temperature Under Arid Agro-Ecosystem in Kuwait as a Prelude to the Gulf Region: Can Root- Zone Soil Temperature Be Predicted from Ambient Air Temperature? J Earth Sci Clim Change 8: 387. doi: 10.4172/2157-7617.1000387
Copyright: © 2017 Abdirashid AE, et al. This is an open-access article distributed under the terms of the Creative Commons Attribution License, which permits unrestricted use, distribution, and reproduction in any medium, provided the original author and source are credited.
Visit for more related articles at Journal of Earth Science & Climatic Change
Abstract
Soil temperature plays an essential role in many ecological processes. Deserts ecosystems, like Kuwait, are extremely sensitive to changes in environmental conditions. Although large number of studies has been done worldwide to investigate responses of various ecosystems to rising air temperatures, less is known about changes in subsurface temperatures, and potential impacts on various ecosystem functions and services. In this study, we used eight recent years (2007-2014) of soil temperature data from different depths (0-5, 5-10, 10-20, 20-50, 50-100 cm depth increments) in three stations in the state of Kuwait: Abdali, Sulaibya and wafra. Air temperature data were obtained from Kuwait’s International Airport (KIA) meteorological station. Analysis of variance (ANOVA) revealed statistically significant variations in soil temperatures with depth in all locations. Another interesting feature of our analysis was the highly linear relationship between air temperatures and soil temperatures up to 0.5 m below soil surface when fitted by linear regression equations with R2 as high as 0.99. These findings shed an important light on whether or not ambient air temperature can be used as a reliable predictor of active root-zone (0-0.5 m) soil temperature for which there is a general lack of long term data availability. Consequently, this paper contributes to the body of knowledge about the potential of soil temperatures being estimated from air temperature in Kuwait and can be applied to other countries in the Gulf region with similar soil and climatic conditions.
Keywords
Air temperature; Desert; Regression; Soil; Subsurface layer
Introduction
Soil temperature has a number of agronomic, geo-environmental and geothermal applications. For example, soil temperature changes can alter the diversity and distribution of plant species leading to a change in biodiversity and plant production [1,2]. In arid deserts, like the Middle East region, the low moisture content severely limits microbial growth, abundance, diversity and growth of agricultural crops [3]. To make the situation even more troubling, the region, according to the most recent predictions, will be confronted with even more severe water shortages as temperature rises due to global warming [4]. What is uniquely interesting with soil temperature (Ts) is that whereas general public can easily relate to air temperature (Ta), Ts is not a commonly used environmental variable and understood concept. Furthermore, the Gulf region is located in low-elevation area close to sea level allowing humidity conditions to develop and, therefore, rising temperatures to accumulate at the earth surface [4].
One of the greatest challenges in projecting future impacts of climate changes on ecosystem functions is to understand how soil profile temperature tracks with ambient air temperature. Temperature in the desert environment, about one-third of the total global land area, can be very extreme with values exceeding 50°C during some of the hot summer days and falling below 10°C during winter nights [5]. Consequently, desert soil with little vegetation cover and low moisture content is subjected to large fluctuations in daily and annual temperatures. With global warming concerns, interest in soil profile temperature is growing because soil productive capacity, biodiversity and other essential ecosystem services heavily depend on soil temperature threshold [3]. Subsurface temperature variation not only affects living organisms, but also has a great potential to influence solute transport and leaching of salts and pollutant movement to groundwater aquifers [6].
Despite the aridity and hence greater vulnerability of the gulf region, only recently few climate change studies have been reported [4,7-9]. Most importantly, research on subsurface temperature measurements and monitoring at the root-zone effective depth is completely lacking. To the best of our knowledge, no study has so far been conducted to characterize soil profile temperature in Kuwait and the gulf region. This is a major knowledge deficiency since most ecological and agricultural processes are affected by temperature differences in the soil profile. This is especially critical when there is a renewed urgency in enhancing food production from domestic farming to free, partially at least, the region from complete reliance on food import. The primary objectives of this study were to: 1) quantify changes in temperature in the soil profile at different locations under agriculture management practices in the state of Kuwait, and 2) examine whether or not soil temperature fluctuations follow a similar trend to air temperature fluctuations, and 3) develop simple methodology for the prediction of soil temperature using ambient air temperature.
Brief Overview of Study Areas and the Gulf Region
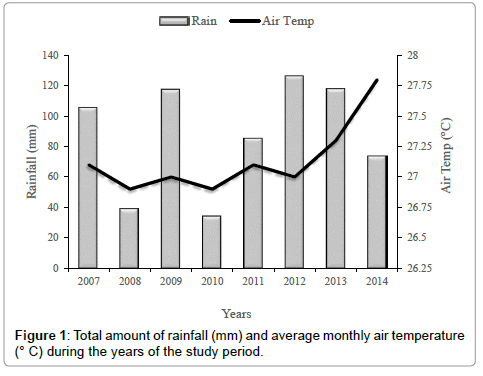
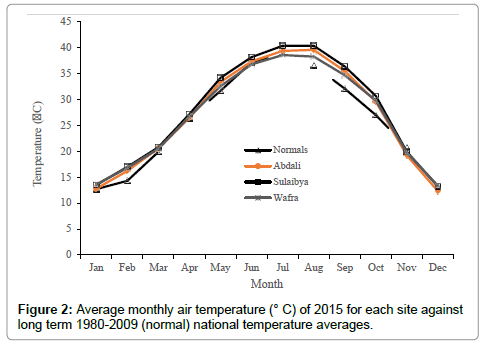
The Arabian Gulf region is characterized by extremely arid and hot climate, and is prone to severe climatic changes. Rainfall in the Gulf is not only scarce but also highly irregular. Rainfall and air temperature data during study period is shown in Figure 1; the year of 2010 being the driest year (34 mm) followed by 2008 (39 mm). The wettest year recorded over the 8 years of this study was 2012 receiving a total of 127 mm rain. Also, there was a sharp warming trend from 2012 to 2014. To ascertain long term behavior of atmospheric temperature, monthly average air temperatures averaged across all the three sites measured during study period and the long term normal (30 year) averages (1980-2009) were calculated and shown in Figure 2. One important feature that must be emphasized is the consistent monthly trend that temperatures for all the sites being higher than normal, suggesting a trend of warming by about 1°C (Figure 2). Warmer temperatures and not only dry but also less predictable rainfall portend to upset the delicate balance of desert soil ecology, which has sustained life for thousands of years. All these factors combined, average annual loss of potentially productive land due to desertification (a key vulnerability indicator for ecological change) is predicted to be among the highest in the world [10]. According to some estimates, over 90% of the total land area suffers some sort of over-grazing, and close to 50% of the total land area is highly degraded [5].
On the agriculture front, arable land of Kuwait is characterized by a soil with a sandy texture, containing 80-90% sand and excessively salty [11]. It has good drainage and airing characteristics but a very low water retention capacity. It is very poor in organic matter and the nutritional elements needed by plants. Estimates for crop production potential areas vary between 25 000 and 37 500 ha of which about 80% has been occupied by annual crops [12]. As shown in Figure 3, these areas are located mainly in: i) Abdali area near the northern border with Iraq; ii) Sulaibya agricultural area in the center of the country near Kuwait city. iii) Al Wafra area near the southern border with Saudi Arabia. Sulaibya area is described to be the most suitable land for crop production, where the soil is much better, as it is deep with a sandy texture, good drainage characteristics and relatively low salt [11].
Moving forward, environmental conditions are not favorable for farming due to high temperature, water scarcity, and severity of land degradation. Consequently, food import has had played a crucial role in compensating local food deficit. Oil-rich Gulf States have so far been able to afford food import. However, because of vulnerability of import routes in the event current violence escalates to a level of instability within the wider Middle East and North Africa (MENA) region and recent sharp decline in oil prices, there are potential risks associated with the complete reliance on food import. Hence, there is a renewed and intense interests in exploring possibilities of meeting, partially at least, food security demands by enhancing domestic food production. It is, therefore, important to have scientific insight into soil temperature behavior and use this knowledge for ecological and agricultural applications.
Materials and Methods
Description of study area
The State of Kuwait is situated in the north-east of the Arabian Peninsula in Western Asia [latitudes 28° and 31° N, and longitudes 46° and 49° E]. It is bordered by Saudi Arabia to the South, and Iraq to the North. It lies on the north-western shore of the Arabian Gulf. Kuwait is one of the smallest countries in the world in terms of land area, flat sandy Desert terrain and generally low lying, with the highest point being 306 m (1,004 ft) above sea-level. The land area is considered arable and sparse vegetation is found along coastline. Kuwait has four distinct seasons: summer, winter, autumn, and spring. The summer months are: June, July, August, and part of September. Autumn starts in September, October, and November. The winter season spans December, January, February, and part of March. Finally, spring is a very shifty season and covers part of March until summer.
Data collection
Kuwait’s meteorological department initiated a survey program to monitor soil temperatures at different depths in 2007. The stations selected were: Kuwait’s International Airport (KIA) from which meteorological data (Air temperature and rainfall) was obtained, and Abdali, Sulaibya and wafra for soil temperature measurements (Figure 3). Except for the KIA station, all other stations were located under agricultural land use. For the purpose of this study, data were collected from the agricultural stations from 2007 to 2014 at five depths, namely 0.05, 0.01, 0.02, 0.5 and 0.1 m, and analyzed for fluctuation in soil temperature in response to atmospheric temperature. The average monthly Ts at each site were used. Atmospheric temperatures at Kuwait’s International Airport was used as a potential predictor for Ts data.
Data analysis
Monthly Ts, spanning from 2007 to 2014 were compiled and analyzed for temporal fluctuations or trends. Analysis of variance (ANOVA) was conducted on collected Ts across all locations: Abdali, Sulaibya, and Wafra. For each year, soil temperatures were examined for significance across the different locations, depths, and their interaction. Also, all years were compared for any significant yearly variations. Atmospheric temperature data from Kuwait’s International Airport were compared to soil temperatures for any change in monthly averages that could be attributed to global warming. Significance of the differences between main factors were investigated using Fisher's F test statistic was used to determine statistical significance within each main factor and a probability level of 0.05 (α=0.05) was selected to declare whether or not differences are statistically significant. Once the data has been tested, preplanned LSD (Least Significant Difference) multiple comparisons were used on the factors which were found to be significant to quantify the differences. All statistical analyses were conducted using general linear models (GLM) available in Statistical Analysis System, SAS (SAS Institute, Version 9.4) for Windows.
Results and Discussion
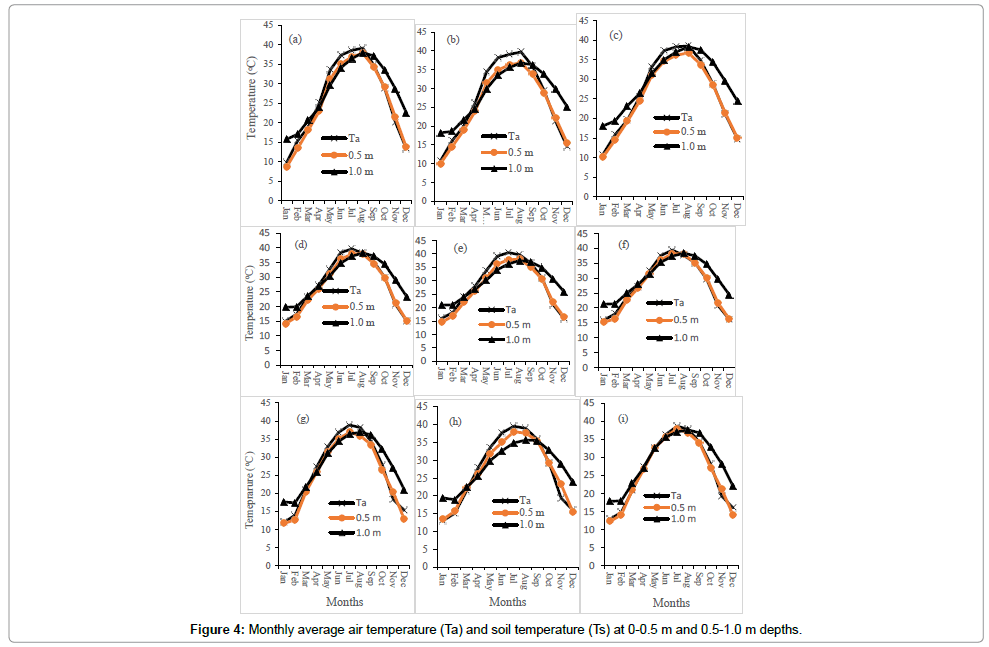
Soil temperature varied significantly (P< 0.001) between month, soil depth (P< 0.001) and, occasionally, location (P< 0.05). Summary of statistical analysis and significance is shown in Table 1. Mean soil temperatures showed significant variation according to depth (P< 0.001) (Table 1). However, there was no significant difference (p>0.05) in soil temperature across locations; exceptions were 2009, 2013, and 2014 when Abdali site was significantly colder than the other sites (Table 2). Averaged across all locations, temperatures at the two uppermost soil layers (0.05 and 0.01 m) were consistently lower than 1.0 m soil depth (Table 3). Because of the limited agronomic, ecological and engineering applications of the soil surface temperatures, we grouped the four uppermost (0.05, 0.1, 0.2, 0.5 m) soil layers temperature measurements into one average monthly value. Hence, this average value, along with 1.0 m soil depth, was plotted against Ta to investigate possible patterns for all the years and sites. The most commonly occurring observation was the trend that Ts at 1.0 m soil depth being warmer than the average of the four uppermost soil layers (0.05, 0.10, 0.20, 0.5 m) for all locations and years (Figure 4). This is likely due to the heat retained at the surface radiating deep into the soil profile; the ability of the soil to store heat and the slow propagation of heat lead to elevated soil temperatures at deeper depth of the soil profile. Another notable trend was the close association between air temperatures (Ta) and soil temperatures (Ts) at the uppermost layers (Figure 4). It can be deducted from this observation that monthly Ts at 0-0.5 m depth for various sites may be predicted from Ta, beyond which soil depth correlation between Ta and Ts is not as significant.
| Years | ||||||||
|---|---|---|---|---|---|---|---|---|
| Factors | 2007 | 2008 | 2009 | 2010 | 2011 | 2012 | 2013 | 2014 |
| Model | <0.001 | <0.001 | <0.001 | <0.001 | <0.001 | <0.001 | <0.001 | <0.001 |
| Location | 0.359 | 0.829 | 0.004 | 0.156 | 0.51 | 0.544 | 0.008 | 0.05 |
| Depth | <0.001 | <0.001 | <0.001 | <0.001 | <0.001 | <0.001 | <0.001 | <0.001 |
| Month | <0.001 | <0.001 | <0.001 | <0.001 | <0.001 | <0.001 | <0.001 | <0.001 |
Table 1: Summary of statistical analysis (p values) in relation to main factors.
| 2007 | 2008 | 2009 | 2010 | 2011 | 2012 | 2013 | 2014 | |
|---|---|---|---|---|---|---|---|---|
| Abdally | 25.84a* | 26.13a | 25.84a | 27.43a | 25.71a | 26.26a | 25.88a | 23.23a |
| Sulaibiya | 26.21a | 26.12a | 26.06ab | 27.75a | 26.08a | 26.57a | 27.03ab | 24.20ab |
| Wafra | 26.27a | 25.85a | 26.9b | 27.91a | 26.53a | 26.73a | 26.7b | 24.08b |
Table 2: Statistical significance of locations grouped by years.
| Depth (m) below soil surface | |||||
|---|---|---|---|---|---|
| Year | 0.05 | 0.01 | 0.02 | 0.5 | 1 |
| 2007 | 21.41a* | 24.68b | 27.02c | 28.63c | 28.80c |
| 2008 | 21.67a | 24.70b | 26.88c | 28.36d | 28.57d |
| 2009 | 22.46a | 24.80ab | 26.94b | 28.44c | 28.63c |
| 2010 | 26.23a | 26.94a | 29.61b | 30.47b | 30.33b |
| 2011 | 22.06a | 24.35ab | 25.64b | 28.68c | 29.21c |
| 2012 | 22.64a | 25.50a | 25.06a | 26.96b | 27.94b |
| 2013 | 23.49a | 25.44b | 27.38c | 26.87bc | 27.48c |
| 2014 | 22.46a | 23.82a | 24.80b | 25.64b | 25.23b |
| Total Avg. | 22.8 | 25.02 | 26.66 | 28 | 28.27 |
Table 3: Summary of statistical significant depths in (cm) grouped by years averaged across locations.
As shown in the preceding section, temperatures increased with soil depth, and this trend persists in all locations and years to a varying degree. A plausible explanation for this observation is that soil and atmospheric heat exchange is highest at the soil surface layers [3]. Water’s heat capacity is five times that of mineral soil particles [3]. Thus, wet surface soils warm up slower than dry deep soils and their particle heat conductivity is expected to increase. As by explained by [13], heat loss is amplified by surface evaporation leading to cooler soil temperatures within the first 0.05 to 0.10 m depth. Water accumulating in lower depths tends to retain heat compared to the upper surface layers where evaporation accelerates cooling [3] Reported that lower soil depths, from 0.50 m up to 0.100 m, are significantly higher in temperature than surface depths during otherwise cold season [14] Reported that the annual mean Ts profile was more or less constant with depth under grassland ecosystem, which is in sharp contrast to our findings. This may be due to the difference between dry, mostly bare, desert ecosystems and the grassland of predominantly clay soils.
Desert plants and animals are generally adapted to extreme warm temperatures, but some species may be approaching their tolerance threshold [15]. While no study has yet to be reported from this region regarding cultivated crops or plant experiencing increases in temperature-driven changes, their optimal growth may nonetheless be affected. For example, estimates that if temperatures increase by 3°C or more, agricultural adaptive capacity could be exceeded in regions closest to the equator, posing large risks to food security [16].
Air and subsurface soil temperatures regression analysis
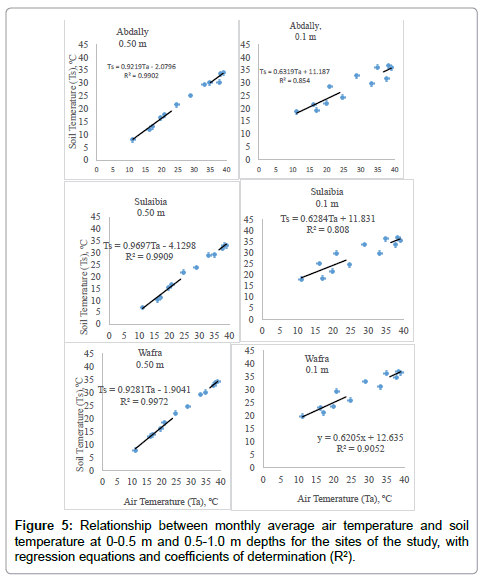
Soil temperature data are often not available for a given sitespecific region. The reason for this is that it is often difficult and costly to monitor soil temperatures for extended periods of time [17]. The prospect, therefore, of developing tractable models which relate Ts to other ore easily measurable parameters such as Ta remains attractive. Predicting daily/monthly mean Ts from mean Ta would decrease the amount of time and cost necessary for on-site monitoring of Ts. In this study, we analyzed monthly average Ts in conjunction with ambient Ta, using least squares linear regression model in order to determine the nature of the relationship between Ta, and Ts. Figure 5 depicts linear regression equations with coefficients of determinations of the average monthly Ts at 0.5 m soil depth derived from average monthly Ta. The relationship between Ta and Ts exhibits stronger correlation at at 0.5 m soil depth in comparison to deeper (0.5-1.0 m) soil depths. High values of R2 is a clear indication that Ta is strongly related to Ts in a linear manner, especially at shallower depths (Figure 5). These observations are consistent with [18] who reported all ground temperatures at depths up to 0.50 m displaying very high relationship to air temperature for both daily and monthly average values, and producing statistically significant regression models that fit adequately the temperature data. Similarly, [19] investigated prediction of Ts at shallow depth from air temperature for seven regions in Turkey. The authors found that Ta and Ts followed same trend, but varying percentage errors, where Ts were more stable at deeper soil depth compared to shallower depths.
It is worth noting that Ts at depths below 0.5 m displayed weaker relationship with Ta (Figure 5), which means that beyond 0.5 m for these sites there is a change of subsurface thermal behavior. This weak tracking between Ta and Ts may be due to the time lag that exists between Ta and Ts because of the large capacity of the surface ground to absorb solar energy [20,21].
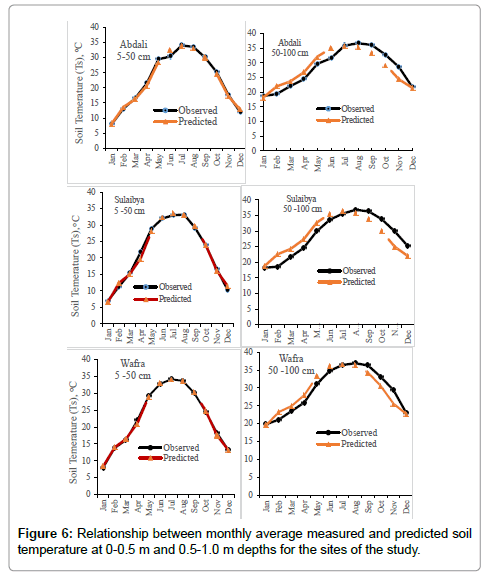
Next, we evaluated the potential for predicting Ts using simulated values. In Figure 6 recorded Ts is plotted against corresponding Ts predicted from Ta. Again, it is clear from this analysis that average Ts at 0.5 m depth can be predicted very accurately from Ta, whereas average Ts at depths below 0.5 m the model consistently over-predicts from January to June and under-predicts from July to December (Figure 6). At the deeper soil layers, there appears to be a time lag of Ts response to Ta variations. Ts for a given day is usually considered to be the result of Ta in the past several days, a hypothesis more likely to be correct for deeper soil layers temperatures. This finding suggests there is a need to investigate Ta and Ts at deeper soil layers relationships on a two separate data group basis to account for seasonal variations and the time lag associated with it; one set of values for January-June and one for July-December. For the purpose of this study however, accurate prediction of Ts at 0-0.5 m is sufficiently important, because this soil depth is the most critical where ecological processes are most intense, especially for vegetation growth, soil biological activities and nutrient recycling, including global carbon budget [22,23].
Conclusion
Soil temperature as function of time, location and depth is an important parameter in agronomic, geo-environmental and geothermal energy applications. In our study, Ts was significantly influenced by soil depth. Comparing air and soil temperature changes reveal a tracking pattern, where Ts at the shallow depths follow the atmospheric temperature fluctuations. Results show that the simple regression model can predict Ts up to 0.50 m with high level of accuracy; with larger differences in measured and predicted soil temperatures occurring soil depth below 0.5 m. Considering the temporal association between Ta and the average Ts at 0.5 m soil layer, this study proves that Ta can be used to estimate Ts up to 0.5 m soil depth for all the sites and years examined. This is especially relevant considering the ease with which ambient air temperatures can be measured and monitored and, on the other hand, the absence of long-term subsurface soil temperature data in many regions of the world and the difficulty of monitoring and maintaining Ts measurement instruments in the soil. Predicted Ts from regression equations and observed Ts were strongly correlated in all sites, especially at shallower soil depths. Finally, any extrapolations should be taken cautiously seeing that the years studied are limited and cannot show a long term trend of temperature change. For example, oil texture has a significant effect on soil thermal diffusivity, with the sandy soils which are the dominant soil texture class in desert ecosystems having higher thermal conductivity. There is a need for more research on the links between air and soil temperatures in the context of ecosystem function’s sustainability under environmental changes driven by climatic changes.
Acknowledgments
This work was supported by Kuwait University Research Grant No [WE01/13], for which we are grateful. The authors appreciate Kuwait Meteorology Administration for providing climate data for the study areas.
References
- Goldblum D, Rigg S (2009) Simulating climate change (temperature and soilmoisture) in a mixed-deciduous forest, Ontario, Canada. WASET 57: 103-107.
- Qian B, Gregorich EG, Gameda S, David WH, Xiaolan LW (2011) Observed soil temperature trends associated with climate change in Canada. J Geophys Res 116: D02106.
- Hu Q, Feng S (2004) A role of the soil enthalpy in land memory. AmerMeteoSoc 17:3633-3643.
- Pal JS, Eltahir EAB (2016) Future temperature in southwest Asia projected to exceed a threshold for human adaptability. Nat ClimChang 6: 197-200.
- Erskine W, Moustafa AT, Osman AE, Zaki L, Arash N, et al. (2004) Date palm in the GCC countries of the Arabian Peninsula.
- Mon EE, Hamamoto S, Kawamoto K, Komatsu T, Moldrup P (2016) Temperature effects on solute diffusion and adsorption in differently compacted kaolin clay. Environ Earth Sci 75: 562.
- Al Sarmi S, Washington R (2013) Changes in climate extremes in the ArabianPeninsula: Analysis of daily data. Int J Climatol 34: 1329-1345.
- Athar H (2013) Seasonal variability of the observed and the projected daily temperatures in northern Saudi Arabia. Clim Change 119: 333-344
- Al-Kalbani MS, John C, Martin FP(2015)Recenttrends in temperature andprecipitation in Al Jabal Al Akhdar, Sultanate of Oman, and the implications for future climate change. J Earth SciClim Change 6: 295
- Al-Awadhi J, Raafat F, Misak RF, Omar SS (2003) Causes and consequences ofdesertification in Kuwait: A case study of land degradation. Bull EngGeol Environ 62: 107-115
- FAO (2008) Irrigation in the Middle East region in figures – AQUASTAT Survey 2008.
- Shahid SA, Omar SAS, Jamal ME, Shihab A (2004) Soil survey for farm planning in northern Kuwait. Kuwait J SciEng 31: 43-57.
- Bai Y (2009) Distribution of soil temperature regimes and climate change in the Mojave Desert region.
- Jacobs AFG, Heusinkveld BG, Holtslag AAM (2011) Long-term record andanalysis of soil temperatures and soil heat fluxes in a grassland area, The Netherlands. AgricMeteorol 151: 774-780
- Serra-Diaz JM, Franklin J, Ninyerola M, Frank WD, Alexandra DS, et al. (2014) Bioclimatic velocity: The pace of species exposure to climate change. Diver Distrib 20: 169-180
- IPCC (2014) Climate change: Impacts, adaptation, and vulnerability-contribution of working group II to the fifth assessment report of the Intergovernmental panel on climate change.
- Brown SE, Pregitzer KS, Reed DD, Burton AJ (2000) Predicting daily mean soil temperature from daily mean air temperature in four northern hardwood forest stands. Forest Sci 46: 297-301.
- Tsilingiridis G, PapakostasK (2014) Investigating the relationship between air and ground temperature variations in shallow depths in northern Greece. Energy 73: 1007-1016
- Yener D, Ozgener O, Ozgener L (2017) Prediction of soil temperatures for shallow geothermal applications in Turkey. Renew Sust Energy Rev 70: 71-77.
- Lei S, Daniels JL, Bian Z, Wainaina N (2011) Improved soil temperature modeling Environ Earth Sci 62: 1123-1130
- Liu Y, Wang L, Liu B, Mark H (2016) Observed changes in shallow soil temperatures in Northeast China, 1960-2007. Clim Res 67: 31-42
- Higashino M, Stefan HG (2016) Water temperature dynamics and heat transport in a typical Japanese river. Environ Earth Sci 75: 618
- Zheng D, Hunt Jr ER, Running SW(1993) A daily soil temperature model based on air temperature and precipitation for continental applications. Clim Res 2: 183-191.
Relevant Topics
- Atmosphere
- Atmospheric Chemistry
- Atmospheric inversions
- Biosphere
- Chemical Oceanography
- Climate Modeling
- Crystallography
- Disaster Science
- Earth Science
- Ecology
- Environmental Degradation
- Gemology
- Geochemistry
- Geochronology
- Geomicrobiology
- Geomorphology
- Geosciences
- Geostatistics
- Glaciology
- Microplastic Pollution
- Mineralogy
- Soil Erosion and Land Degradation
Recommended Journals
Article Tools
Article Usage
- Total views: 30505
- [From(publication date):
February-2017 - Jul 01, 2025] - Breakdown by view type
- HTML page views : 29350
- PDF downloads : 1155

