Recent and Future Trend Analysis of Inter-Seasonal to Seasonal Rainfall and Temperature to Climate Change and Variability in Dire Dawa city Administration, Ethiopia
Received: 03-Dec-2020 / Accepted Date: 02-Feb-2021 / Published Date: 09-Feb-2021 DOI: 10.4172/2573-458X.1000200
Abstract
The trend analysis has been employed to inspect the change of rainfall and temperature in Dire Dawa city administration, using gauged monthly precipitation and Temperature data obtained from National meteorological Agency of Ethiopia from 1980 to 2014 and the future climate data of GCM used by the Intergovernmental Panel on Climate Change fifth generation CMIP5 and World Clim obtained from Agricultural Model inter-comparison and Improvement Project (AgMIP) website. Two models such as HadGEM2-ES and MRI-CGCM3 under rcp4.5and 8.5 have been considered to generate rainfall, maximum and minimum temperature data using AgMIP R script of “run_ agmip_simple_delta.R”in R software 3.5.3 version. Recent and future rainfall variability CV, Standard deviation and rainfall Anomaly have been computed using excel spreadsheet for variability analysis and the Mann-Kendall test was used to detect the time series trend of inter-seasonal to seasonal temperature and rainfall using R software version 3.5.3. The inter-seasonal to seasonal observed and projected rainfall data shown highly variable while the annual rainfall variability shown in moderate range of variability. The declining trend for belg and inclining trend of kiremt mean observed and HadGEM2-ES(CMIP5) under rcp8.5 model rainfall were found to be statistically significant while that of annual and other monthly trend were not significant except July in observed data but the other projected model for future rainfall trend shown no statistical significant. Therefore, the concerned bodies should take in to consideration climate change adaptation strategy and finally, it is recommended to extend farther study with Ensemble GCM model and RCM.
Keywords: Climate change; Mann-Kendall test; Seasonal rainfall; Trend analysis
Introduction
Warming of our planet due to the emission of Greenhouse Gases (GHGs) is now undeniable; and over the last century, atmospheric concentration of CO2 has increased significantly which induced the average global temperature to increase by 0.74oC as compared with the preindustrial era [1]. The other scientific Researches have shown that surface air temperature increased by 0.2oc to 0.6oc in 20th centuries and [2]. Global climate has undergone significant and unprecedented changes during the past 100 years [3]. And warming will continue beyond 2100 under all RCP scenarios except RCP2.6 [4]. According to report state that, if no additional efforts are taken to mitigate the effects of climate change CO2eq concentration are likely to increase to approximately about 450ppm by 2030 and between 750ppm to 1300ppm by 2100.If this occurs, by 2100 the earth may experience global mean surface temperature increase of 3.7oc to 7.8oc compared to pre-industrial era [4]. So, there is increasing evidence that global warming has resulted in an increase in the frequency and severity of precipitation and drought events [5].
Surface precipitation is an important component of the global climate and one of the most important variables in the global hydrological cycle as well as an important indicator in evaluation of water resources [6,7]. Rainfall and temperature are the two of the most important variables in the field of climate sciences and hydrology frequently used to trace extent and magnitude of climate change and variability [8]. Uncertainty of rainfall and uneven temporal and spatial distribution in one hand, creating flooding and of the other hand longer dry spells evoking drought conditions. Increase in precipitation trends can also result in an increase in the frequency of floods occurrence. On the other hand, a decrease in rainfall trend could imply an increase in instances of drought. Climate change studies are mainly focused on the probable changes in the climatic parameter such as rainfall or temperature. Several climate change models (physical models) are being used to study the long term changes in climate parameters on temporal and spatial scale [9-11]. Temporal and spatial variability of climatic parameters can also be studied using statistical approach through the analysis of long term climatic data [12]. Analysis of rainfall trend on different spatial and temporal scales is needed to construct the climate scenarios comprehensively [13]. Using these scenarios on specific location can solve the problems associated with flood and drought as well as the availability of water can be handled accordingly.
In Africa, precipitation amounts are likely to decrease for most parts of Sub-Saharan Africa (SSA) while rainfall variability is expected to increase [4]. And World Bank (2010) argued that Africa is expected to experience mainly negative climate change impacts, in terms of un increase in the already high temperatures and a decrease in the largely erratic rainfall in its context of widespread poverty and low development. A marked note that is worthy to be noted is that of the increase in the number of heavy precipitation events, which can also be found even in areas experiencing reduction in total precipitation amount. Thus, study on precipitation has received much attention over the past few decades as understanding rainfall patterns is necessary for assessment of climatic change, managing agricultural issues and also water resources management. Most of the scientists have shown that by 2100, parts of the Sahara are likely to be the most vulnerable with frequently occurrence of extreme climate events will make the region under stress and adverse impacts will be felt in associated with climate change [14].
The long-term climatic change related to changes in precipitation patterns, rainfall variability, and temperature is most likely to increase the frequency of droughts and floods in Ethiopia [15]. Current climate variability is already imposing a significant challenge to Ethiopia by deterring the struggle to reduce poverty and sustainable development efforts [15]. The ranked Ethiopia among the most vulnerable countries in the world to the adverse effects of climate change; mainly due to its high dependence on rain fed agriculture, low adaptive capacity and a higher reliance on natural resources base for livelihood, among others [15-18]. The impact of climate change on precipitation in Ethiopia is more on its distribution and timing than the total amount [15,18,19].
Trend analysis studies conducted so far in Ethiopia are not conclusive and some are conducted at macro scale; which needs further research. The spatial rainfall distribution in Ethiopia is too much variable from place to place, due to variation in local feature like topography. Thus, the study of climate in specific location is important to identify the trend of climate change on rainfall and temperature variables. Diredawa City Administration is found in Eastern Ethiopia, which is frequently influenced by flood and drought. Though trend analysis of meteorological variables is not new in Ethiopia, no prior comprehensive study was conducted in the study area, which is a drought-prone area of the country, needs more attention to analysis the trends of climatic variables for adaptation. The variation in rainfall and increase in temperature due to climate change and variability may causes to lack of water availability and heat stress. In view of above, this study was undertaken to detect the temporal trends in the interseasonal to seasonal time series of rainfall and Temperature analysis which will be helpful for detecting climate related events and in devising climate change and variability state.
This study incorporates both variability investigation, trend analysis (based on historical data of (1980–2014) years and considering two GCM models such as HadGEM2-ES and MRI-CGCM3 for future projection climate scenarios under RCP 4.5 and RCP 8.5 for interseasonal to seasonal as well as annual rainfall trend and variability analysis using descriptive statistics and trend test for rainfall, maximum and minimum temperature on the climate change induced variability in Dire dawa City. This information is helpful in quantifying the magnitude of risks posed by climate change and variability to guide prioritization risk management by directing appropriate measures. Therefore, understanding the temporal patterns of climate change and variability is a key step towards designing and targeting appropriate adaptation strategies.Therefore the study hypothesis that, understanding past and future climate change and variability for decision supporting in appropriate adaptive measures.
Therefore, the general objective is to analysis trends of rainfall and temperature, on various time-scales, and rainfall variability analysis indicating the occurrence of extreme events in order to investigate the influence of climate change and variability in Dire dawa City Administration is
➢ To analysis the recent and future temporal variability of rainfall
➢ to analysis occurrence of climate change and variability trends of the recent and future rainfall and temperature data in Dire dawa City administration
Materials and Methods
Familiarizing the study area
Dire dawa lies in Eastern Ethiopia having an altitude of about 1200 m a.s.l. It receives 638.2 mm average annual rainfall and experiences frequent droughts, dry spell and floods (Figure 1). The mean annual maximum temperature of the area is 32.1 0c while its mean annual minimum temperature of 19.10c.The rainfall type of Dire Dawa is a bimodal type characterized by two rainy seasons and one dry season, namely belg a small rainy period ranges from the months of half of February to May, and Kiremt, second rainy season occurring from June to September. The distribution of rainfall mostly occurs from mid-June to mid-September (second rainy season), locally known as kiremt, and Mid-February to May is the first rainy season, which is locally known as belg [20,21].

Figure 1: Map of the study area of Dire Dawa City.
However, the rainfall is highly characterized by inter-annual and inters- seasonal variation. In general, the Major rain bearing systems during the belg season are the development of thermal low over South Sudan, generation and propagation of disturbances over the Mediterranean Sea, sometimes coupled with easterly waves, development of high pressure over the Arabian Sea, the interaction between mid-latitude depressions and tropical systems accompanied by troughs and the subtropical jet and occasional development of the Red Sea convergence Zone (RSCZ) [22]. While, the Major rain producing systems during Kiremt, on the other hand, include Northward migration of ITCZ, development and persistence of the Arabian and South Sudan thermal low along 20oN latitude, development of quasipermanent high pressure systems over south Atlantic and south Indian Oceans, development of tropical easterly jet and the generation of low level Somali jet that enhance low level south westerly flow [22].
Research design
Data type and sources: Daily observations of surface temperature and precipitation for the period 1980–2014 were taken from the National Meteorological Agency (NMA) and the future climate data of GCM used by the Intergovernmental Panel on Climate Change (IPCC) fifth generation CMIP5 and WorldClim data have been obtained from AgMIP format as described in the AgMIP.
Generating future daily weather aata: Since each climate model has its own uncertainty, more than one climate model will be better for dealing with the accurate projection problem. Based on this recommendation this study considered two GCM models such as HadGEM2-ES and MRI-CGCM3 under rcp4.5 scenarios to generate rainfall, Tmax and Tmin data of 2010 to 2100, in range of near, medium and end century separately and under rcp8.5 for medium and end century has been used to generate future climate data. The climate data of five GCMs namely: CCSM4, GFDL- ESM2M, HadGEM2- ES, MIROC5, and MPI-ESM-MR were recommended for monsoon benefited regions. Because these GCMs subset were selected due to their long history of development and evaluation, a preference for higher resolution, and established performance in monsoon regions [23]. According to [24-26]. Recommendation for East African climate study, Had GEM2-ES and MRI-CGCM3 model have been proposed for east African climate study based on its spatial resolution for atmospheric and there are highly applicable a new feature of the updated tool out of the 20 combination models found in GCM. HadGEM2-ES, and MPIESM- MR, were separately analyzed for mean changes in projected climate compared with baseline (1980 -2010) and the two models were considered in this study for Future climate projections of Diredawa meteorological station (Table 1).
| Model Name | Resolution, Lat Lon˚ | Institution | Reference |
| HadGEM2-ES | 1.2414 × 1.875 | MetOffice Hadley Centre | (Collinset al., 2011) |
| MRI-CGCM3 | 1.125 × 1.125 | Meteorological Research Institute | (Yukimoto et al., 2012) |
Table 1: GCM model selected for generation of climate data.
RCPs usually refer to the portion of the concentration pathway extending up to 2100, for which Integrated Assessment Models have produced corresponding to emission scenarios [3]. The RCP8.5 is a high emissions scenario, corresponding to projections of high human population (12 billion by 2100), high rates of urbanization and limited rates of technological change, all resulting in emissions approaching 30 Gt of carbon by 2100 compared with 8Gt in 2000 [27]. The RCP4.5 scenarios is an intermediate mitigation scenario characterized by continuously increasing human population but at a rate lower than in the RCP8.5 scenario, intermediate levels of economic development and less rapid and more diverse technological change [28]. Therefore, Representative Concentration Pathways (RCP) proposed contains a range of low, moderate and high emissions pathways. According to AR5 report, the highest estimated RCP in the year of 2100 is RCP8.5 and lower is RCP of 2.6 W/m2. Based on those emissions scenario, RCP (4.5) medium lower and RCP (8.5) upper maximum have been selected for future mid and end century in climate projection in this study. The tools to generate the future weather data for Diredawa meteorological station was AgMIP R script of “run_agmip_simple_delta.R” in R sofware 3.5.3 version.
Data analysis techniques: A number of techniques have been developed for the analysis of rainfall and temperature, which generally fall into variability and trend analysis categories. Variability analysis involves the use of Coefficient of Variation (CV), rainfall anomaly, monthly and seasonal contribution to annual rainfall, departure of model output rainfall data from the observed mean and other basic statistical analysis have been applied to this study. Additionally, trend detection and analysis are performed through parametric and non-parametric tests using Mann– Kendall test and sense slope estimator. As a result, Mann-Kendall (MK) test is widely used to detect trends of meteorological variables [29-32]. MK test is a nonparametric test, which tests for a trend in a time series without specifying whether the trend is linear or non-linear [33].
Inter-Seasonal to Seasonal Climate Variability Analysis: The seasonal rainfall data from 1980 to 2014 of Diredawa meteorological station and projected future model data were taken to analysis interseasonal to seasonal rainfall coefficient of variation of seasonal rainfall variability of a given station. The temporal variation was derived by calculating coefficient of variation (CV) for interested period of time period. In this study, rainfall variability CV and Standard deviation have been computed using excel spreadsheet. A higher value of CV is the indicator of larger variability, and vice versa. The coefficient of variation of inter-seasonal to seasonal rainfall variability of observed and projected rainfall data has been analyzed by:

Where CV is the coefficient of variation; Xi is rainfall of each year, N is number of rainfall observation, δ is standard deviation and μ is the mean of precipitation. According to Hare (2003), justification, CV is used to classify the degree of variability of rainfall events is less (CV < 20), moderate (20 ≤CV < 30), and high (CV ≥30).
Seasonal rainfall anomaly analysis: The Rainfall Anomaly Index (RAI), designed by Van Rooy (1965), considers rainfall anomaly index values to calculate positive and negative precipitation anomalies. Based on his suggestion, the seasonal rainfall performance of each rainy season was obtained by making the rainfall anomaly of the study area using excel spreadsheet. The variability is the difference between total rainfall for each year/season and the LTM was divided by standard deviation to derive the annual rainfall anomalies. The anomalies indicate the departure from LTM with negative values below -0.5 representing periods of below normal rains while positive values above +0.5 reveal above normal rains. The rainfall anomaly index can gives a representation of abnormal wetness and dryness of a given season.
where, RAI is standardized rainfall anomaly; Xi is the seasonal rainfall of a particular year; X is long term mean annual rainfall over a period of observation and ‘δ’ is the standard deviation of seasonal and annual rainfall over the period of observation and projection period.
The analysis of inter-seasonal to seasonal contribution of Rainfall was undertaken by
Where X is monthly or seasonal long year mean and Annual Rf is annual long year mean of rainfall of the study area.
Trend analysis of recent and future climate: Increasing or decreasing trend of all the independent weather parameters (e.g. annual and seasonal temperature, rainfalls etc.) were statistically examined in two phases. First one is the using of non-parametric Mann-Kendall test and second one is the nonparametric Sens slope estimator. MK test is non-parametric test, which tests for a trend in a time series without specifying whether the trend is linear or non-linear. The increasing or decreasing trend was tested based on normalized test statistics (Z) value. When Z is positive, trend is said to be increasing and when Z is negative, it is said to be decreasing. The trend’s slope gives the annual rate and direction of change [34]. Several researchers have widely used this method for different hydro-meteorological parameters [35,36]. Analysis of rainfall trend on different spatial scales is needed to construct the climate scenarios comprehensively [13]. Using these scenarios, problems associated with flood, drought and the availability of water can be handled accordingly.
Therefore, MK test has been used to detect the presence of monotonic (increasing or decreasing) trends in the study area to analysis whether the trend is statistically significant or not. Trend analysis has been carried out on annual bases, inter-seasonal and seasonal with observed and projected rainfall and temperature data. Since the study area gets first rainy season from half of Feb to May and its second rainy season is kiremt rainfall from half of June to September, monthly trends test of recent and future rainfall and temperature data have been analyzed separately. The trend analysis considered rainfall amount, Tmax and Tmin of Dire Dawa meteorological station have been analyzed in base line years (1980 to 2010) and future climate scenarios 2010 to 2100 with two GCM model data. The Software used for performing the Mann Kendall and trend statistical test was R software Kendall, plotly and trend package.
The Mann–Kendall statistical test has been frequently used to quantify the significance of trends in climatic parameters time series .The Mann–Kendall test Tau statistic is calculated as
 (4)
(4)
Where n is the length of the time series(x1,x2,x3,.......xn),Xi and Xj are the data values in the time series i and j ( j>i ), respectively, and sgn(Xj – Xi) is the sign function [37,38].
The variance V(S) of statistics S is computed as
“ti” is the number of ties of extent i.
Where n is the number of data points, p is the number of tied groups, the summation sign (Σ) indicates the summation over all tied groups ti the number of data values in path group. If there are no tied groups, this summation process can be ignored. A tied group is a set of sample data that have the same value. In cases where the sample size n > 30, the standard normal tests statistical Zs is computed as follows:
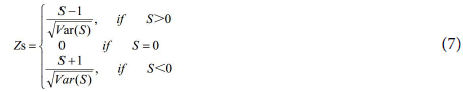
Positive values of ZS indicate increasing trends, while negative ZS values show decreasing trends. Testing trends is performed at the specific α significance level. When |ZS| >|Z1-α/2|, the null hypothesis is rejected, indicating that a significant trend exists in the time series. Z1-α/2 is obtained from the standard normal distribution table.MK test is used to detect if a trend in annual and seasonal precipitation series is statistically significant. The significance level of Mann–Kendall test has proven to be useful in determining the possible existence of statistically significant trends assuming a 95% probability level [39]. which is P value ≤0.05. At the 5 % significance level, the null hypothesis of no trend is rejected if |ZS|>1.96.
Sen's Slope estimation test computes both the slope (i.e. the linear rate of change) and intercept according to Sen's method. The magnitude of the trend is predicted by Theil (1950) and Sen (1968) slope estimator methods. A positive value of β indicates an ‘upward trend’ (increasing values with time), while a negative value of β indicates a ‘downward trend’. Here, the slope (Ti) of all data pairs is computed as [40]. Teil- Sen Approach. Teil-Sen’s estimator is used to quantify the magnitude of trends and has been widely used in analyzing hydrological time series data [31]. The magnitude of the trend is estimated by Sens slope method which is proceeds by calculating the slope as a change in measurement per change in time,

Where Xj and Xi ith and jth data point in time series (j>i), respectively. Teil-Sen’s estimator’s main advantage lies in the global median used, which makes it more resistant to the effect of extreme values in the time series [40,31]. And Q is the slope between data points Xj and Xi ,Sens slope estimator is simply given by the median slope,
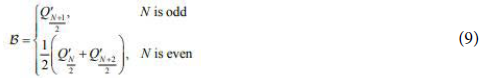
Where, N is the number of calculated slopes. A positive value of β indicates an increasing trend and a negative value indicates a decreasing trend in the time series. Finally, this paper used linear regression, quadratic and cubic line to assess trends in these extreme indicators for each season and model.
Result and Discussion
Descriptive statistics and rainfall variability analysis
The mean annual rainfall of the area during the study period was 638.2 mm with 158.1 mm standard deviation and 24.8% CV. The annual minimum and maximum ever recorded rainfalls were 379.4 mm (in 1980- the driest year) and 1012.7 mm (in 2010-the wettest year) per year respectively. And the Kiremt Seasonal minimum and maximum ever recorded rainfalls were 97 mm (in 1987- the driest seasonal) and 521.8mm (in 2010-the wettest season) per kiremt seasonal rainfall respectively, while 47.4 mm (in 2000- the driest seasonal) and 615.5mm (in 1987-the wettest season) per belg seasonal rainfall respectively (Table 2). The result showed on Table 2 is that a time series of percentage contributions of each rainfall month to the total seasonal rainfall since records began.
| Month | Min | Max | Mean | Contribution % |
| January | 0 | 128.2 | 19.7 | 3.1 |
| February | 0 | 135.2 | 24.2 | 3.8 |
| March | 1.3 | 222 | 75.8 | 11.9 |
| April | 22 | 249.9 | 110.8 | 17.4 |
| May | 0 | 243.5 | 55.2 | 8.7 |
| June | 0 | 75 | 23.9 | 3.8 |
| July | 2.3 | 206.9 | 83.9 | 13.1 |
| August | 51.6 | 241.5 | 115.3 | 18.1 |
| Sept | 16.2 | 215.2 | 72.1 | 11.3 |
| October | 0 | 266.9 | 31.9 | 5.0 |
| Nov | 0 | 82.1 | 13.6 | 2.1 |
| Dec | 0 | 129.8 | 11.9 | 1.9 |
| FMAM | 47.4 | 615.5 | 265.8 | 41.6 |
| JJAS | 97 | 521.8 | 295.3 | 46.3 |
| ONDJ | 0.2 | 381.6 | 77.1 | 12.1 |
| Annual | 379.4 | 1012.7 | 638.2 | 100.0 |
Table 2: Basic statistical analysis of rainfall in Dire dawa Meteorological station (1980–2014).
As depicted in Table 2 the kiremt and belg seasonal rainfall contribution have shown almost similar contribution rain season in the study area contributes about 46.3% of the total rainfall (where nearly 41.6% comes only in belg season which clearly revealed that relatively presence of more concentration of rainfall. while ONDJ contributes only 12%: monthly maximum contribution were 18.1% and 17.4% in August and April respectively while minimum monthly contribution were about 3.1% ,3.8% and 3.8% in January, February and June rainfall respectively). It is easy to understand that June monthly rainfall has less contribution to kiremt rainfall for the study area.
Analysis of climate variability
Inter-Seasonal to seasonal climate variability of monthly and seasonal time scale of rainfall mean and coefficient variation of Dire dawa meteorological station were analyzed. The result reveals that the rainfall either in monthly or seasonal time scales is highly variable (Tables 3 and 4). The rainfall anomalies also witnessed for the presence of seasonal variability and the trend being below the long-term average become more pronounced (Figures 2 and 3). The Kiremt seasonal rainfall anomalies indicated in (Figure 2) revealed that the study area received above normal rainfall in 1983, 1992, 1994,1996,1998,2001,2007 and 2010, whiel with the latter being the most severe and Widespread droughts (below normal rainfall) were experienced in1980,1981,198 4,1987,1989,1990,1991,1993 and 2009 of kiremt seasons in the study area (Figure 2). Similarly, belg seasonal extreme drought years were experienced in 1980,1984,1992,2000,2002,2003,2004,2009,2011 and 2012 and extremely wet belg season were in 1981,1983,1986,1987,1989 ,1990,1991,1996 and 2010 (Figure 3). While Very low values of rainfall anomaly correspond to severe belg seasonal drought periods -1.7 in 2000 and -1.6 in 2009 (Figure 3).
| Period | Observed Rainfall data (1980-2010) | MRI-CGCM3(CMIP5) rcp4.5 Rainfall data (2010-2100) |
HadGEM2-ES(CMIP5) rcp4.5 Rainfall Data (2010-2100) | ||||||||
| δ | μ1 | CV | δ | μ2 | CV | ∆μ | δ | μ3 | CV | ∆μ | |
| January | 30.1 | 19.7 | 152.8 | 22.6 | 17.0 | 132.9 | -2.7 | 34.6 | 25.9 | 133.4 | 6.2 |
| February | 34.2 | 24.2 | 141.1 | 55.6 | 26.3 | 211.5 | 2.1 | 71.3 | 47.4 | 150.5 | 23.2 |
| March | 57.7 | 75.8 | 76.1 | 74.5 | 88.2 | 84.6 | 12.4 | 27.1 | 35.4 | 76.5 | -40.4 |
| April | 66.3 | 110.8 | 59.8 | 77.2 | 117.7 | 65.6 | 6.9 | 73.9 | 123.1 | 60.0 | 12.3 |
| May | 51.2 | 55.2 | 92.7 | 57.2 | 61.3 | 93.3 | 6.1 | 37.9 | 41.2 | 92.0 | -14.0 |
| June | 23.2 | 23.9 | 96.6 | 22.8 | 23.0 | 99.4 | -0.9 | 19.9 | 20.1 | 98.9 | -3.8 |
| July | 43.3 | 83.9 | 51.6 | 48.9 | 87.7 | 55.7 | 3.8 | 47.0 | 83.4 | 56.3 | -0.5 |
| August | 45.9 | 115.3 | 39.8 | 41.5 | 91.6 | 45.3 | -23.7 | 52.7 | 121.5 | 43.4 | 6.2 |
| Sept | 39.4 | 72.1 | 54.7 | 41.7 | 74.7 | 55.8 | 2.6 | 35.1 | 64.7 | 54.3 | -7.4 |
| October | 48.5 | 31.9 | 152.1 | 55.9 | 37.6 | 148.6 | 5.7 | 59.6 | 39.8 | 149.7 | 7.9 |
| Nov | 19.9 | 13.6 | 145.8 | 19.7 | 13.3 | 148.5 | -0.3 | 23.8 | 17.0 | 139.9 | 3.4 |
| Dec | 26.8 | 11.9 | 223.9 | 68.1 | 33.0 | 206.4 | 21.1 | 38.2 | 18.8 | 202.9 | 6.9 |
| ONDJ | 73.3 | 77.1 | 95.0 | 95.3 | 100.9 | 94.5 | 23.8 | 92.7 | 101.5 | 91.3 | 24.4 |
| FMAM | 123.4 | 265.8 | 46.4 | 149.2 | 293.5 | 50.8 | 27.7 | 126.2 | 247.1 | 51.1 | -18.7 |
| JJAS | 97.7 | 295.3 | 33.1 | 98.4 | 276.9 | 35.5 | -18.4 | 100.1 | 289.6 | 34.5 | -5.7 |
| Annual | 158.1 | 638.2 | 24.8 | 167.4 | 671.3 | 24.9 | 33.1 | 159.7 | 638.3 | 25.0 | 0.1 |
Table 3: Basic statistical analysis of rainfall in Dire dawa Meteorological station during observed period and (CMIP5) under rcp4.5 future model data.
| Period | Observed Rainfall data(1980-2010) | MRI-CGCM3(CMIP5) rcp8.5 Rainfall data(2040-2100) |
HadGEM2-ES(CMIP5) rcp8.5 Rainfall Data (2040-2100) | ||||||||
| δ | μ1 | CV | δ | μ2 | CV | ∆μ | δ | μ3 | CV | ∆μ | |
| January | 30.1 | 19.7 | 152.8 | 41.5 | 31.9 | 130.2 | 12.2 | 28.9 | 21.2 | 136.1 | 1.5 |
| February | 34.2 | 24.2 | 141.1 | 57.2 | 39.5 | 144.8 | 15.3 | 30.7 | 21.1 | 145.4 | -3.1 |
| March | 57.7 | 75.8 | 76.1 | 60.0 | 78.7 | 76.2 | 2.9 | 148.8 | 181.7 | 81.9 | 105.9 |
| April | 66.3 | 110.8 | 59.8 | 133.1 | 221.4 | 60.1 | 110.6 | 100.1 | 160.3 | 62.4 | 49.5 |
| May | 51.2 | 55.2 | 92.7 | 46.6 | 49.4 | 94.4 | -5.8 | 69.5 | 72.8 | 95.5 | 17.6 |
| June | 23.2 | 23.9 | 96.6 | 26.2 | 26.7 | 98.0 | 2.8 | 24.1 | 24.4 | 98.9 | 0.5 |
| July | 43.3 | 83.9 | 51.6 | 57.5 | 101.5 | 56.7 | 17.6 | 45.4 | 79.3 | 57.2 | -4.6 |
| August | 45.9 | 115.3 | 39.8 | 60.8 | 135.0 | 45.0 | 19.7 | 30.5 | 61.6 | 49.5 | -53.7 |
| Sept | 39.4 | 72.1 | 54.7 | 28.0 | 51.0 | 55.0 | -21.1 | 33.5 | 59.6 | 56.2 | -12.5 |
| October | 48.5 | 31.9 | 152.1 | 60.8 | 40.1 | 151.7 | 8.2 | 60.5 | 39.6 | 153.0 | 7.7 |
| Nov | 19.9 | 13.6 | 145.8 | 24.1 | 17.0 | 141.8 | 3.4 | 26.6 | 17.0 | 156.8 | 3.4 |
| Dec | 26.8 | 11.9 | 223.9 | 53.8 | 26.2 | 205.5 | 14.3 | 52.2 | 25.3 | 206.4 | 13.4 |
| ONDJ | 73.3 | 77.1 | 95.0 | 100.1 | 115.2 | 86.9 | 38.1 | 91.6 | 103.0 | 88.9 | 25.9 |
| FMAM | 123.4 | 265.8 | 46.4 | 188.6 | 389.0 | 48.5 | 123.2 | 230.7 | 436.0 | 52.9 | 170.2 |
| JJAS | 97.7 | 295.3 | 33.1 | 111.3 | 314.1 | 35.4 | 18.8 | 88.6 | 224.9 | 39.4 | -70.4 |
| Annual | 158.1 | 638.2 | 24.8 | 211.0 | 818.3 | 25.8 | 180.1 | 216.0 | 763.9 | 28.3 | 125.7 |
Table 4: Basic statistical analysis of rainfall in Dire dawa Meteorological station during observed period and (CMIP5) under rcp8.5 future model data.

Figure 2: Kiremt Seasonal rainfall variability in Diredawa rainfall station.

Figure 3: Belg Seasonal rainfall variability in Diredawa rainfall station.
Historical Kiremt seasonal droughts in Ethiopia had been linked with ENSO events in the past [15,41-44]. Recent documented kiremt seasonal droughts of 1984, 1987, 1991–1992,1993–94, 2002, 2009, and 2012, were either coincide or follow El Nino events shortly. As depicted (Figure 2); the rainfall anomaly for these drought years were found to be very low (Figures 2and 3).
The descriptive statistics of inter-seasonal precipitation such as the coefficient of variation (CV) has been discussed in (Table 2). So from the analysis it is observed that the monthly precipitation coefficient of variation ranging from 51.6 in month of July and 223.9 % in the month of December (Table 3). According to Hare (2003), CV is used to classify the degree of variability of rainfall events as less (CV < 20), moderate (20 < CV < 30), high (CV > 30), very high CV>40% and CV>70% indicate extremely high inter-annual variability of rainfall. Based on this classification, the observed rainfall data in all the months, belg and kirent season had above 30 % coefficient of variation (CV) highlighting the high variability of precipitation over the study area while the annual rainfall shown that moderate variability (Table 3). The rainfall CV of belg (46.4%) is higher than that of kiremt CV (33.1%) which implies more inter-annual variability of belg rainfall is higher than that of kiremt one (Table 3). The result of seasonal rainfall variability agrees with the findings of [29,43,45]. And where more variability in belg rainfall than the kiremt rainfall in most parts of Ethiopia [46].
When the rainfall amount of the recent (1980–2014) is compared with the near, mid and end of the 21st Centuries under RCP 4.5 of model MRI-CGCM3 CMIP5 and HadGEM2-ES (CMIP5), a reduction in kiremt mean rainfall and annual mean has shown slight increment within both considered model while ONDJ has shown an increment of mean rainfall within both model. On the other hand FMAM mean rainfall in MRI-CGCM3 (CMIP5) under rcp4.5 has shown an increment while decrement in HadGEM2-ES(CMIP5) model data while annual rainfall variability in MRI-CGCM3(CMIP5) under rcp4.5 is about 24.9% and HadGEM2-ES(CMIP5) under rcp 4.5 is 25.0%. Based on Hare (2003), CV of rainfall classification, the annual rainfall variability of Diredawa station has shown moderate rainfall variability in both model under rcp 4.5, while inter-seasonal and seasonal rainfall variability have shown that highly variable in observed and future model data (Table 3).
When the rainfall amount of the recent (1980–2014) is compared with the mid and end of the 21st Centuries under RCP 8.5 of model HadGEM2-ES (CMIP5), a has shown that reduction in kiremt rainfall mean while annual mean, ONDJ and FMAM mean were shown a slight increment within both considered MRI-CGCM3 CMIP5 and HadGEM2-ES (CMIP5 model but rainfall variability will be expected to increase. According to CV classification of Dire dawa meteorological station in observed as well mid and end century of both considered model, rainfall variability indicated that 24.8% in observed 25.8 in MRI-CGCM3 (CMIP5) and 28.3% in HadGEM2-ES(CMIP5) under rcp8.5, which is categorized under moderate rainfall variability [47] (Table 4).
Rainfall and temperature trend analysis
The Inter-seasonal and seasonal mean of time series data of climatic parameters, particularly temperature (maximum and minimum) and precipitation were analyzed using MK test for Dire dawa Meteorological station with observed data from (1980 to 2014) and GCM model data from (2010 to 2100). MK statistics and p-values derived at 5% level of significances were considered in this study. In the MK test, parameters like Kendall’s Z statistic, p-Value, Sen's Slope were considered to identify the increasing or decreasing trend in the time series of climatic parameters. The test results are discussed in detail separately for each parameter in (Tables 5-9). The observed rainfall trend based on monthly and seasonal time series have shown that month of July and JJAS seasonal rainfall were shown an inclined trend at 5% statistical significant level, while FMAM (belg) seasonal rainfall has shown declining at 5% statically significant level. Other time period considered in this study has no statistical significant (Table 5) and (Figure 5). Similarly, the observed maximum temperature trend shown that an inclining trend at 5% statistical significant level while minimum temperature change is not statistically significant at 5% level except declining in March and incline in April and May (Table 5) and (Figures 5 and 4). The mean maximum temperature changes were more significant than the mean minimum temperature change. Figure 4 shows that the annual maximum temperature was increased significantly through time series 1980-2014 as per indicated by the trend line.
| Rainfall(1980-2014)N=35 | Tmax(1980-2014)N=35 | Tmin (1980-2014)N=35 | ||||||||||
| Time series | MKZ | P value |
Sig | Sen's Slope | MK Z |
P value |
Sig | Sen's Slope | MKZ | P value |
Sig | Sen's Slope |
| Jan | 1.167 | 0.243 | - | 0.00 | 4.21 | 0.00003 | *** | 0.06 | -0.54 | 0.589 | - | -0.012 |
| Feb | -1.4 | 0.1699 | - | -0.0579 | 3.73 | 0.0002 | *** | 0.076 | -1.15 | 0.25 | - | -0.025 |
| Mar | -0.7 | 0.4954 | - | -0.5 | 3.02 | 0.0026 | ** | 0.069 | -2.18 | 0.029 | * | -0.029 |
| April | -1.5 | 0.1251 | - | -1.6444 | 4.04 | 0.00005 | *** | 0.129 | 2.74 | 0.0062 | ** | 0.033 |
| May | -0.23 | 0.8203 | - | -0.1125 | 4.25 | 0.00002 | *** | 0.104 | 2.06 | 0.039 | * | 0.036 |
| June | 1.52 | 0.1286 | - | 0.4238 | 4.7 | 0.000002 | *** | 0.079 | 0.47 | 0.638 | - | 0.004 |
| July | 3.09 | 0.0019 | ** | 1.8388 | 2.68 | 0.0072 | *** | 0.039 | -1.81 | 0.071 | - | -0.0214 |
| Aug | 1.42 | 0.1556 | - | 1.1571 | 1.79 | 0.074 | 0.025 | -1.45 | 0.1458 | - | -0.0192 | |
| Sept | 0.16 | 0.8759 | - | 0.1111 | 3.32 | 0.0009 | *** | 0.054 | -0.87 | 0.3834 | - | -0.008 |
| Oct | 0.06 | 0.9547 | - | 0.000 | 3.64 | 0.0003 | *** | 0.062 | -0.09 | 0.9319 | - | 0.000 |
| Nov | 1.13 | 0.2575 | - | 0.000 | 3.98 | 0.00007 | *** | 0.056 | 0.36 | 0.7219 | - | 0.004 |
| Dec | 0.96 | 0.3353 | - | 0.000 | 4.27 | 0.00002 | *** | 0.0533 | -0.71 | 0.4767 | - | -0.0111 |
| ONDJ | 0.45 | 0.645 | - | 0.25 | 5.3 | 0.000001 | *** | 0.06 | -0.83 | 0.4067 | - | -0.005 |
| FMAM | -2.10 | 0.0355 | * | -4.700 | 4.8 | 0.000002 | *** | 0.108 | 0.527 | 0.5981 | - | 0.0051 |
| JJAS | 2.27 | 0.0231 | * | 3.547 | 4.4 | 0.000009 | *** | 0.05 | -1.4 | 0.162 | - | 0.009 |
| Annual | -0.23 | 0.8203 | - | -0.55 | 6.4 | 0.00000 | *** | 0.072 | -0.63 | 0.5291 | - | 0.000 |
Table 5: Monthly Mann-Kendall results of precipitation and Temperature for Diredawa station.
| HadGEM2-ES(CMIP5)rcp4.5 Rainfall Model Data (2010-2100) ,N=91 | HadGEM2-ES(CMIP5) rcp4.5Tmax Model Data (2010-2100),N=91 | HadGEM2-ES(CMIP5) rcp4.5Tmin Model Data (2010-2100),N=91 | ||||||||||
| Time series | MKZ | P value |
Sig | Sen's Slope | MK Z |
P value |
Sig | Sen's Slope | MKZ | P value |
Sig | Sen's Slope |
| Jan | -0.34 | 0.732 | - | 0.000 | 8.31 | 0.0000 | *** | 0.033 | 4.93 | 0.0000 | *** | 0.028 |
| Feb | -0.10 | 0.924 | - | 0.000 | 6.4 | 0.0000 | *** | 0.039 | 4.01 | 0.00005 | *** | 0.026 |
| Mar | -0.984 | 0.325 | - | -0.082 | 6.1 | 0.0000 | *** | 0.033 | 5.8 | 0.0000 | *** | 0.033 |
| April | -1.89 | 0.058 | - | -0.533 | 5.6 | 0.0000 | *** | 0.045 | 8.8 | 0.0000 | *** | 0.038 |
| May | -0.16 | 0.875 | - | -0.121 | 5.9 | 0.0000 | *** | 0.038 | 8.1 | 0.0000 | *** | 0.041 |
| June | 1.1 | 0.283 | - | 0.042 | 8.4 | 0.0000 | *** | 0.042 | 6.6 | 0.0000 | *** | 0.032 |
| July | 2.48 | 0.013 | - | 0.344 | 6.8 | 0.0000 | *** | 0.026 | 4.7 | 0.0000 | *** | 0.022 |
| Aug | 1.7 | 0.089 | - | 0.283 | 6.5 | 0.0000 | *** | 0.03 | 5.4 | 0.0000 | *** | 0.025 |
| Sept | -0.79 | 0.426 | - | -0.098 | 8.4 | 0.0000 | *** | 0.044 | 6.3 | 0.0000 | *** | 0.030 |
| Oct | 0.74 | 0.459 | - | 0.059 | 6.4 | 0.0000 | *** | 0.031 | 7.8 | 0.0000 | *** | 0.041 |
| Nov | 0.78 | 0.431 | - | 0.000 | 7.8 | 0.0000 | *** | 0.032 | 7.1 | 0.0000 | *** | 0.033 |
| Dec | 0.68 | 0.497 | - | 0.000 | 9.9 | 0.0000 | *** | 0.038 | 4.5 | 0.0000 | *** | 0.024 |
| ONDJ | 1.16 | 0.247 | - | 0.311 | 10.1 | 0.0000 | *** | 0.033 | 8.3 | 0.0000 | *** | 0.031 |
| FMAM | -1.54 | 0.124 | - | -0.822 | 7.3 | 0.0000 | *** | 0.039 | 8.1 | 0.0000 | *** | 0.035 |
| JJAS | 1.5 | 0.137 | - | 0.559 | 9.1 | 0.0000 | *** | 0.036 | 5.7 | 0.0000 | *** | 0.026 |
| Annual | 0.082 | 0.934 | - | 0.064 | 10.4 | 0.0000 | *** | 0.037 | 7.9 | 0.0000 | *** | 0.031 |
Table 6: Inter-seasonal to Seasonal Mann-Kendall test results of precipitation and Temperature for Dire dawa station within HadGEM2-ES (CMIP5) model data under RCP 4.5.
| MRI-CGCM3 (CMIP5)rcp4.5 Rainfall Model Data (2010-2100) ,N=91 | MRI-CGCM3 (CMIP5)rcp4.5 Tmax Model Data (2010-2100),N=91 | MRI-CGCM3 (CMIP5) rcp4.5 Tmin Model Data (2010-2100),N=91 | ||||||||||
| Time series | MKZ | P value |
Sig | Sen's Slope | MK Z |
P value |
Sig | Sen's Slope | MKZ | P value |
Sig | Sen's Slope |
| Jan | 0.09 | 0.9268 | - | 0.000 | 6.7 | 0.0000 | *** | 0.023 | 4.8 | 0.0000 | *** | 0.027 |
| Feb | 1.02 | 0.3062 | - | 0.000 | 3.9 | 0.0000 | *** | 0.022 | 3.9 | 0.0000 | *** | 0.026 |
| Mar | -3.25 | 0.0012 | ** | -0.743 | 5.3 | 0.0000 | *** | 0.029 | 4.9 | 0.0000 | *** | 0.021 |
| April | 0.94 | 0.3475 | - | 0.267 | 3.8 | 0.0002 | *** | 0.0312 | 7.5 | 0.0000 | *** | 0.025 |
| May | -0.98 | 0.3268 | - | -0.129 | 3.9 | 0.0000 | *** | 0.027 | 4.7 | 0.0000 | *** | 0.18 |
| June | 1.313 | 0.1891 | - | 0.066 | 4.8 | 0.0000 | *** | 0.0212 | 5.5 | 0.0000 | *** | 0.016 |
| July | 1.8 | 0.798 | - | 0.248 | 3.1 | 0.002 | ** | 1.84 | 3.7 | 0.0002 | *** | 0.011 |
| Aug | -1.1 | 0.2848 | - | -0.168 | 5.8 | 0.000 | *** | 0.0242 | 4.4 | 0.0000 | *** | 0.0133 |
| Sept | -0.45 | 0.651 | - | -0.061 | 6.7 | 0.0000 | *** | 0.029 | 5.8 | 0.0000 | *** | 0.021 |
| Oct | 1.3 | 0.2045 | - | 0.092 | 0.87 | 0.382 | - | 0.004 | 5.3 | 0.0000 | *** | 0.018 |
| Nov | 1.1 | 0.2673 | - | 0.000 | 4.1 | 0.00003 | *** | 0.016 | 5.1 | 0.0000 | *** | 0.017 |
| Dec | 1.1 | 0.292 | - | 0.000 | 6.4 | 0.0000 | *** | 0.019 | 3.8 | 0.0001 | *** | 0.020 |
| ONDJ | 2.0 | 0.0431 | * | 0.467 | 6.1 | 0.0000 | *** | 0.016 | 7.6 | 0.0000 | *** | 0.02 |
| FMAM | -0.75 | 0.4528 | - | -0.444 | 5.4 | 0.0000 | *** | 0.028 | 7.0 | 0.0000 | *** | 0.023 |
| JJAS | 0.1 | 0.9235 | - | 0.048 | 7.5 | 0.0000 | *** | 0.023 | 5.9 | 0.0000 | *** | 0.015 |
| Annual | 0.7 | 0.4822 | - | 0.567 | 7.5 | 0.0000 | *** | 0.0233 | 7.9 | 0.0000 | *** | 0.019 |
Table 7: Monthly Mann-Kendall results of precipitation and Temperature for Dire dawa station within MRI-CGCM3 (CMIP5) model data under RCP 4.5.
| HadGEM2-ES(CMIP5)rcp8.5 Rainfall Model Data (2040-2100) ,N=61 | HadGEM2-ES(CMIP5)rcp8.5 Tmax Model Data (2040-2100),N=61 | HadGEM2-ES(CMIP5) rcp8.5 Tmin Model Data (2040-2100),N=61 | ||||||||||
| Time series | MKZ | P value |
Sig | Sen's Slope | MK Z |
P value |
Sig | Sen's Slope | MKZ | P value |
Sig | Sen's Slope |
| Jan | -0.6 | 0.5472 | - | 0.0000 | 7.8 | 0.0000 | *** | 0.086 | 4.7 | 0.0000 | *** | 0.054 |
| Feb | -0.73 | 0.4654 | - | 0.0000 | 6.8 | 0.0000 | *** | 0.087 | 4.2 | 0.00003 | *** | 0.0553 |
| Mar | 0.77 | 0.4403 | - | 0.293 | 6.3 | 0.0000 | *** | 0.082 | 3.9 | 0.00009 | *** | 0.054 |
| April | 0.16 | 0.8764 | - | 0.135 | 5.9 | 0.0000 | *** | 0.089 | 6.7 | 0.0000 | *** | 0.055 |
| May | -0.18 | 0.8568 | - | -0.033 | 6.2 | 0.0000 | *** | 0.077 | 6.3 | 0.0000 | *** | 0.0575 |
| June | 1.78 | 0.075 | - | 0.175 | 8.0 | 0.0000 | *** | 0.09 | 4.8 | 0.0000 | *** | 0.038 |
| July | 3.5 | 0.00047 | *** | 1.103 | 6.4 | 0.0000 | *** | 0.048 | 3.1 | 0.002 | ** | 0.026 |
| Aug | 2.6 | 0.0105 | * | 0.98 | 5.3 | 0.0000 | *** | 0.041 | 3.9 | 0.00008 | *** | 0.028 |
| Sept | -0.67 | 0.5015 | - | -0.13 | 7.5 | 0.0000 | *** | 0.085 | 5.4 | 0.0000 | *** | 0.0444 |
| Oct | 0.55 | 0.5839 | - | 0.069 | 6.65 | 0.0000 | *** | 0.067 | 6.1 | 0.0000 | *** | 0.062 |
| Nov | 1.3 | 0.1944 | - | 0.000 | 7.8 | 0.0000 | *** | 0.069 | 4.9 | 0.0000 | *** | 0.064 |
| Dec | 1.3 | 0.2087 | - | 0.000 | 8.4 | 0.0000 | *** | 0.069 | 5.1 | 0.0000 | *** | 0.0634 |
| ONDJ | 1.2 | 0.2297 | - | 0.662 | 9.1 | 0.0000 | *** | 0.072 | 5.9 | 0.0000 | *** | 0.0576 |
| FMAM | -0.068 | 0.9454 | - | -0.077 | 7.6 | 0.0000 | *** | 0.086 | 6.1 | 0.0000 | *** | 0.057 |
| JJAS | 3.1 | 0.002 | ** | 2.32 | 8.2 | 0.0000 | *** | 0.067 | 4.1 | 0.00005 | *** | 0.032 |
| Annual | -0.227 | 0.8203 | - | -0.55 | 9.9 | 0.0000 | *** | 0.075 | 5.3 | 0.0000 | *** | 0.048 |
Table 8: Monthly Mann-Kendall results of precipitation and Temperature for Dire dawa station within HadGEM2-ES(CMIP5) model data under RCP 8.5.
| MRI-CGCM3 (CMIP5)rcp8.5 Rainfall Model Data (2010-2100) ,N=91 | MRI-CGCM3 (CMIP5)rcp8.5 Tmax Model Data (2010-2100),N=91 | MRI-CGCM3 (CMIP5) rcp8.5 Tmin Model Data (2010-2100),N=91 | ||||||||||
| Time series | MKZ | P value |
Sig | Sen's Slope | MK Z |
P value |
Sig | Sen's Slope | MKZ | P value |
Sig | Sen's Slope |
| Jan | -1.1 | 0.2763 | - | 0.000 | 7.3 | 0.0000 | *** | 0.0585 | 4.9 | 0.0000 | *** | 0.0576 |
| Feb | -0.39 | 0.6914 | - | 0.000 | 5.2 | 0.0000 | *** | 0.0567 | 3.1 | 0.002 | ** | 0.0378 |
| Mar | 1.7 | 0.0917 | - | 1.56 | 4.5 | 0.0000 | *** | 0.047 | 3.6 | 0.0003 | ** | 0.039 |
| April | 0.7 | 0.4858 | - | 0.453 | 2.7 | 0.00654 | ** | 0.038 | 5.7 | 0.0000 | *** | 0.0365 |
| May | -0.1 | 0.9256 | - | -0.267 | 2.5 | 0.014 | * | 0.0306 | 4.7 | 0.0000 | *** | 0.0345 |
| June | 1.0 | 0.3224 | - | 0.0965 | 6.5 | 0.0000 | *** | 0.0552 | 4.7 | 0.0000 | *** | 0.0342 |
| July | 0.17 | 0.8666 | - | 0.0242 | 6.3 | 0.0000 | *** | 0.047 | 2.7 | 0.008 | ** | 0.0193 |
| Aug | -2.65 | 0.0082 | ** | -0.543 | 6.1 | 0.0000 | *** | 0.0502 | 3.8 | 0.0001 | *** | 0.0264 |
| Sept | -1.44 | 0.1506 | - | -0.289 | 7.0 | 0.0000 | *** | 0.0665 | 4.9 | 0.0000 | *** | 0.035 |
| Oct | -0.17 | 0.8665 | - | -0.102 | 6.7 | 0.0000 | *** | 0.0693 | 5.8 | 0.0000 | *** | 0.049 |
| Nov | 1.8 | 0.0716 | - | 0.000 | 5.4 | 0.0000 | *** | 0.067 | 4.7 | 0.0000 | *** | 0.0422 |
| Dec | 1.3 | 0.1943 | - | 0.000 | 7.8 | 0.0000 | *** | 0.052 | 4.7 | 0.0000 | *** | 0.054 |
| ONDJ | 1.11 | 0.2653 | - | 0.567 | 8.8 | 0.0000 | *** | 0.054 | 5.9 | 0.0000 | *** | 0.0489 |
| FMAM | 0.98 | 0.3224 | - | 1.6 | 4.7 | 0.0000 | *** | 0.044 | 5.7 | 0.0000 | *** | 0.0394 |
| JJAS | -1.1 | 0.2873 | - | -0.663 | 7.9 | 0.0000 | *** | 0.0557 | 4.0 | 0.0000 | *** | 0.0276 |
| Annual | 1.04 | 0.2987 | - | 1.67 | 8.8 | 0.0000 | *** | 0.052 | 5.3 | 0.0000 | *** | 0.0369 |
Table 9: Monthly Mann-Kendall results of precipitation and Temperature for Diredawa station within MRI-CGCM3(CMIP5) model data under RCP 8.5.

Figure 4: Seasonal rainfall anomaly with HadGEM2-ES model under rcp 4.5.

Figure 5: Seasonal rainfall anomaly with HadGEM2-ES model under rcp 8.5.
There were many climate trend related studies have been conducted in different parts Ethiopia with different results. In this study as depicted in (Table 5) , though the declining trend of belg rainfall and inclining in Kiremt season and particularly July monthly rainfall shown an inclining trend statistical significance mjjm (Table 5), In this study, there is statistical significant decreasing trend of belg rain through time was obtained which coincides with in the eastern part of South Wollo (Ethiopia) had found a slight decrease in rainfall during the short belg season while the long rainy season (kiremt) had shown an increasing trend through time and where belg rainfall showed a significant decreasing trend and On other hand, the results are different from the findings of disclosed a significant decline in the annual and kiremt rainfalls for the eastern, southern and southwestern stations since about 1982 [29,46]. And also [48] had investigated the spatiotemporal variability of annual and seasonal rainfall over Ethiopia and reported decreasing trends of kiremt and annual rainfall in northern, northwestern and western parts of the country; while an increasing trend in annual rainfall was observed in a few grid points in eastern parts of the country. And in his study where statistically non-significant increasing trend was recorded in all seasons (including annual time scale) and where no significant trend of belg rainfall totals while kiremt rainfall exhibited a significant decreasing trend [49].
Based on HadGEM2-E and MRI-CGCM3 (CMIP5) Model under rcp 4.5 future generated data of Diredawa station from (2010 to 2100) trend analysis of climate parameters, the result of HadGEM2- ES (CMIP5) under rcp4.5 shown that rainfall has no statistical significant at 5% significance level at each time period taken (Table 6) and (Figure 6). And the result of MRI-CGCM3 (CMIP5) model data under rcp4.5 of rainfall trend shown that no significant trend at a given significance level except month of March which has shown declining trend and ONDJ has shown inclining trend (Table 7). Similarly, the two considered model under rcp 8.5 have shown different rainfall trend results. i.e the HadGEM2-ES(CMIP5) under rcp 8.5 analysis result revealed that inclining trend in kiremt seasonal rainfall and inclining trend in July and August monthly time period while the other monthly and seasonal rainfall trend has no statistical significance of trend at a given statistical level (Table 8). And MRI-CGCM3 (CMIP5) model data under rcp 8.5 analysis result of rainfall trend has no statistical significant except declining in the month of August (Table 9). It could be seen that different GCMs predicted different sets of values for rainfall increase (or decrease).In relation this, the analysis of both maximum and minimum temperature generated with both GCM model data under rcp 4.5 and 8.5 shown that an inclining trend in all time period (Tables 6-9).

Figure 6: Seasonal and annual observed Tmax trend analysis for the period 1980-2014.
Climate projections generated by UNDP (cited in DFID, 2009) for Ethiopia highlight the likelihood of mean temperature increases of 1°C in 2020s and up to 3.9°C to 2080s. Using a multi-model dataset the National Meteorological Agency of Ethiopia indicates that the mean annual temperature is likely to rise significantly when compared with the 1961–90 level by a maximum of 1.1oC by 2030, 2.1oC by 2050 and 3.4oC by 2080 (Weldegebriel and Prowse, 2013). The following figure shown that, the trend graph of Rainfall, Tmax and Tmin in different season and annual within observed and two model data under rcp4.5 and 8.5 (Figures 7-20).

Figure 7: Seasonal and annual observed Tmin trend analysis for the period 1980-2014.

Figure 8: Seasonal and annual observed RF trend analysis for the period 1980-2014 of Dire dawa.

Figure 9: Had(CMIP5) model under rcp4.5 RF trend for the period 2010-2100 of Diredawa.

Figure 10: Had (CMIP5) model under rcp4.5 Tmin trend for the period 2010-2100 of Dire dawa.

Figure 11: Had(CMIP5) model under rcp4.5 Tmax trend for the period 2010-2100 of Dire dawa.

Figure 12: MIR(CMIP5) model under rcp4.5 RF trend for the period 2010-2100 of Diredawa.

Figure 13: MIR(CMIP5) model under rcp4.5 Tmin trend for the period 2010-2100 of Diredawa.

Figure 14: MIR(CMIP5) model under rcp4.5 Tmax trend for the period 2010-2100 of Diredawa.

Figure 15: MIR(CMIP5) model under rcp8.5Tmin trend for the period 2010-2100 of Diredawa.

Figure 16: MIR(CMIP5) model under rcp8.5 RF trend for the period 2010-2100 of Diredawa.

Figure 17: MIR(CMIP5) model underrcp8.5 Tmax trend for the period 2010-2100 of Diredawa.

Figure 18: Had(CMIP5) model under rcp8.5Tmin trend for the period 2010-2100 of Diredawa.

Figure 19: Had(CMIP5) model under rcp8.5Tmax trend for the period 2040-2100 of Diredawa.

Figure 20: Had(CMIP5) model under rcp8.5 RF trend for the period 2040-2100 of Diredawa.
Summery and Conclusion
This study analyzed the temporal variability and monotonic trends in rainfall and temperature in Dire dawa City Administration with observed (1980 to 2014) and future model data of (2010 to 2100). The study area is susceptible to climate change and variability, the monthly rainfall was highly variable in study area and moderate in annual time period with observed and future generated data. Annual rainfall anomalies revealed temporal distributions of extreme wet with above normal rains and extreme dry with below normal rainfall. Increased surface temperature has been observed and also warming will be continued. Analysis of the 35 years monthly precipitation data by taking a representative ground based Dire dawa meteorological station showed a coefficient of variation ranging from 39.8(July) to 223.9 (December) % which is categorized in highly variable in inter-seasonal time period. While, seasonal and annual coefficient of variation of rainfall of Diredawa meteorological station during ONDJ, FMAM, JJAS and Annual were shown as 95.0, 46.4, 33.1 and 24.8 % respectively, which indicated that highly seasonal variable and medium annual rainfall variability.
Though, recorded meteorological data analysis of maximum temperature and future maximum and minimum indicate that increasing trends detected, the minimum mean temperature recorded trend change is not significant except decline in March and inclining in April and May. While the future rainfall trend under both considered model and rcp 4.5 and 8.5 have shown erratic trend and under both model output different trend has been observed. Regarding to the Mann–Kendall monotonic trend analysis test, the maximum temperature examination bring about in a general warming trend. Information generated in this paper could be used to inform targeting of appropriate adaptive measures across multiple sectors. The concerned bodies should take in to consideration of highly rainfall variability and inclining of temperature of the area in to their climate change adaptation strategy. Lastly, other GCM climate model are recommended to generating future climate data, which can decrease uncertainty of incorrect detection and interpretation compared with a little GCM model data in the study area.
References
- NMSA (2001) Initial National Communication of Ethiopia to the United Nations Framework Convention on Climate Change (UNFCCC). National Meteorological Services Agency (NMSA) Addis Ababa Ethiopia.
- Abaurrea, Cerian (2001) Trend and variability analysis of rainfall time series and their extremesevents.
- IPCC Climate Change (2013) Te Physical Science Basis. Working Group I Contribution to the Fifh Assessment Report of the Intergovernmental Panel on Climate Change. Cambridge University Press, Cambridge, UK.
- IPCC (2014) Climate Change 2014: Impacts, Adaptation, and Vulnerability; Part a: Global and Sectoral Aspects. Contribution of Working Group II to the Fifth Assessment Report of the Intergovernmental Panel on Climate Change. Cambridge University Press, Cambridge, United Kingdom and New York 1132.
- Deng H Chen, Y Shi X (2014) Dynamics of temperature and precipitation extremes and their spatial variation in the arid region of northwest China. Atmospheric Research 138: 346-355.
- Hulme (1995) Estimating global changes in precipitation Weather. 50: 2-34.
- Vijaya KP, Bindi M, Crisci A, Maracchi G (2013) Detection of variations in precipitation at different time scales of twentieth century at three locations of Italy. Weather and Climate Extremes 2: 7-15.
- IPCC (2007) Climate Change 2007: Impacts, Adaptation and Vulnerability. Cambridge University Press and New York, USA.
- IPCC (2001) Climate change: the scientific basis. Intergovernmental panel on climate change. Cambridge (UK): Cambridge Univ Press.
- INCCA (2010) Indian network for climate change assessment, Climate Change and India: A 4x4 Assessment, Ministry of Environment and Forests, Government of India.
- Krishna KK, Patwardhan SK, Kulkarni A, Kamala K, KoteswaraRao K, et al. (2011) Simulated projections for summer monsoon climate over India by a high-resolution regional climate model (PRECIS). Current Science 101: 312-26.
- Patle GT, Singh DK, Sarangi R, Khanna A, Sahoo M (2013) Temporal variability of climatic parameters and potential evapotranspiration. Indian journal of Agricultural Sciences 83: 518-24.
- Kumar V, Jain SK (2011) Trends in rainfall amount and number of rainy days in river basins of India (1951–2004). Hydrol Res 42: 290-306.
- UNDP (2014) Sustaining Human Progress: Reducing Vulnerabilities and Building Resilience; Human Development Report.
- NMA (2007) Climate Change National Adaptation Programme of Action (NAPA) of Ethiopia. National Meteorological Agency (NMA) Addis Ababa Ethiopia.
- World Bank (2010) Development and Climate Change: 2010 World Development Report. The World Bank Washington DC New York.
- EPCC (Ethiopian Panel on Climate Change), 2015. First Assessment Report, Working Group II Agriculture and Food Security.
- Kinguyu SM, Ogallo LA, Anyamba EK (2000) Recent trends of minimum and maximum surface temperatures over Eastern Africa. J Clim 13: 2876-86.
- Belay S, Zaitchik BF, Foltz JD (2014) Agroecosystem specific climate vulnerability analysis: application of the livelihood vulnerability index to a tropical highland region. Mitig Adapt Strategies Glob Change 21:39-65.
- Workineh D (1987) Some aspects of meteorological drought in Ethiopia. In: Glantz, M.H. (Ed) Drought and Hunger in Africa. Cambridge University Press Cambridge.
- Rosell S, Holmer B (2007) Rainfall change and its implications for belg harvest in South Wollo, Ethiopia. Geogr Ann 4: 287-99.
- National Meteorological Services Agency NMSA (1996) Climate and agro climatic resources of Ethiopia, Meteorological Research Report Series.
- Rosenzweig C, Jones J, Hatfield J, Antle J, Ruane A, et al. (2013). AgMIP Guide for Regional Integrated Assessments: Handbook of Methods and Procedures.
- Thornton PK, Jones PG, Alagarswamy A, Andresen J (2009) Spatial variation of crop yield responses to climate change in East Africa. Global Environmental Change 19: 54-65.
- Yang W, Seager R, Cane MA, Lyon B (2014) The East African long rains in observations and models. J Climate 27: 7185-7202
- Yang W, Seager R, Cane MA, Lyon B (2015) The annual cycle of East African precipitation. J Climate 28:Â 2385-04.
- Riahi K, Grübler A, Nakicenovic N (2007) Scenarios of long-term socioeconomic and environmental development under climate stabilization. Technological Forecasting and Social Change 74: 887-935.
- Moss RH, EdmondsJA, Hibbard KA, et al. (2010) The next generation of scenarios for climate change research and assessment. Nature 463: 747-756.
- Yilma S, Zanke U (2004) Recent changes in rainfall and rainy days in Ethiopia. Int J Climatol 24: 973-983.
- Daniel M, Woldeamlak B, Lal R (2014) Recent spatiotemporal temperature and rainfall variability and trends over the upper Blue Nile river basin, Ethiopia. Int J Climatol 34.
- Tabari H, Aghajanloo MB (2013) Temporal pattern of aridity index in Iran with considering precipitation and evapotranspiration trends. International Journal of Climatology 33: 396-409.
- Gebremedhin K, Shetty A, Nandagiri L (2016) Analysis of variability and trends in rainfall over northern Ethiopia. Arab J Geosci 9.
- Yue S, Pilon P, Cavadias G (2002) Power of the Mann-Kendall test and the Spearman's rho test for detecting monotonic trends in hydrological time series. J HydrO259: 254-271.
- Helsel DR, Hirsch RM (2002) Statistical Methods in Water Resources. Chapter A3, Book 4, Hydrologic Analysis and Interpretation, Techniques of Water-Resources Investigations of the United States Geological Survey.
- Aziz OIA, Burn DH (2006) Trends and variability in the hydrological regime of the Mackenzie river basin. Journal of Hydrology 319: 282-94.
- Mondal A, Kundu S, Mukhopadhyay A (2012) Rainfall trend analysis by Mann-Kendall test: A case study of north-eastern part of Cuttack district, Orissa. International Journal of Geology, Earth and Environmental Sciences 2: 70-78.
- Mann HB (1945) Non-parametric test against trend. Econometrica 13: 245-259.
- Dufek AS, Ambrizzi T (2008) Precipitation variability in Sao Paulo State, Brazil. J Ðeor Appl Climatol 93: 167-178.
- Sen PK (1968) Estimates of the Regression Coefficient Based on Kendalls Tau. Journal of the American Statistical Association 63: 1379-89.
- Shanko D, Camberlin P (1998) The effects of the Southwest Indian Ocean tropical cyclones on Ethiopian drought. Int J Climatol 18: 1371-88.
- Daniel G, Yirgaw (2011) Climate Variability in the Drought Prone Regions of Afar and Amhara, Northern Ethiopia.
- Viste E, Korecha D, Sorteberg A (2012)Â Recent drought precipitation trends in Ethiopia. Theor Appl Climatol 112: 535-51.
- Â Recent drought precipitation trends in Ethiopia. Theor Appl Climatol 112: 535-51.
- Seifu A, Abdulkarim HS (2006) Analysis of rainfall trend in Ethiopia. Eth J Sci and Technol 3: 15-30.
- Kassa F, (2015) Ethiopian seasonal rainfall variability and prediction using canonical correlation analysis (CCA). Earth Sci 4:112–9.
- Hare W (2003) Assessment of Knowledge on Impacts of Climate Change, Contribution to the Specification of Art 2 of the UNFCCC. WBGU.
- Arragaw A, Woldeamlak B (2017) Local spatiotemporal variability and trends in rainfall and temperature in the central highlands of Ethiopia. Geogr.
- Negash W, Goel NK, Jain MK (2013) Temporal and spatial variability of annual and seasonal rainfall over Ethiopia. Hydrol Sci J 58: 354–373.
Citation: Tolosa AA, Tolossa TT (2021) Recent and Future Trend Analysis of Inter- Seasonal to Seasonal Rainfall and Temperature to Climate Change and Variability in Dire Dawa city Administration, Ethiopia. Environ Pollut Climate Change. 5: 200. DOI: 10.4172/2573-458X.1000200
Copyright: © 2021 Tolosa AA, et al. This is an open-access article distributed under the terms of the Creative Commons Attribution License, which permits unrestricted use, distribution, and reproduction in any medium, provided the original author and source are credited.
Share This Article
Recommended Journals
Open Access Journals
Article Tools
Article Usage
- Total views: 2525
- [From(publication date): 0-2021 - Apr 04, 2025]
- Breakdown by view type
- HTML page views: 1699
- PDF downloads: 826