Rainfall Variability and Land-Use Change in Arid Basins with Traditional Agricultural Practices; Insight from Ground Water Monitoring in Northwestern Iran
Received: 08-Oct-2018 / Accepted Date: 12-Nov-2018 / Published Date: 22-Nov-2018 DOI: 10.4172/2157-7617.1000498
Abstract
The challenge of water resources is very important in regions like Middle East, which has a dry and semi-arid climate and extreme land use changes. Most countries like Iran in this region are encountered with water scarcity. Zaribar Lake basin in the west of Iran has undergone many changes over recent years due to land use and climate variations. This watershed is an important source of water for industry and agriculture and supports valuable ecosystems such as Zaribar wetland. Therefore, in this research, we investigate the effects of rainfall variability and land use changes on the availability of water resources in this basin between the year from 1990 to 2016 through analyzes of satellite images, meteorological and hydrological data. The results show that during this period the amount of precipitation has dropped, and the area of land uses like agricultural and residential sectors, which consume the most amount of water, has grown while the area of forests which preserve water in the catchment has decreased. Generally, the area of the lake has not changed significantly but the depth of water inside the lake and the water table and availability in the whole of the basin have decreased because of land use changes and climate variation.
Keywords: Land use change; Climate change; Water resources; Zaribar Lake basin
Introduction
Water is a limited and irreplaceable resource for human survival, ecosystem health and socio-economic development [1], and is connected with food security and regional conflicts [2,3]. 7% of the world’s population is in the regions with less than 1.5 % of the supply of the world’s renewable fresh water. Water has been basic to human societies development in regions like Middle east and North Africa [4]. Water scarcity has led to increasing conflict in Middle East and due to the recent drought, that has started in 2007, this problem has been exacerbated. Although the water is vital resource to the increased population, improved living standards, industry, irrigation agriculture, and truism in middle east [5], hydrological data, regulations and monitoring groundwater is lacking both nationally and internationally in this region [6]. Water can strongly affect sustainable development [1], and adaptation to climate and land use changes [7,8]. At the same time, water resources are greatly impacted by climate and land use changes [9-11]. Therefore, understanding the relations between climate, land use and water resources is critical to the effective management of water resources.
Land use and land cover changes are very important factors in challenges of hydrology [9,12], and water resources globally and locally [5]. They are also crucial items in adopting strategies for monitoring environmental changes and natural resources [13]. Land use/cover changes directly impact water resources condition primarily through modifications to watershed hydrology processes, including soil moisture, runoff, infiltration of surface, and evapotranspiration [14]. Changes in hydrology with land-use changes have to be considers alongside the change caused by climate variations, which influence the amount of precipitation and evaporative demand [2,15]. Investigating the impacts of climate and land use changes on watershed hydrology is vital to plan and manage water resources [16,17], and to preserve the cycle of hydrology [18]. Therefore, in recent years, there has been a lot of attention in Iran and other countries to the impacts of land-use and climate variation on water resources [2,3,5,9,11,14]. The challenge of managing water resources is very important in countries like Iran whit dry and semi-arid climate and extreme land use changes, for example the area of natural forests have declined from 19 million hectares to 12.4 million hectares between the year 1950s to 1990s [19]. In most parts of Iran, there is an urgent demand for agricultural and residential lands while rainfall is low, and the consumption of water is high [20]. Zaribar Lake basin in the west of Iran has a Mediterranean weather condition which over time has provided the status for the formation of suitable forests and preserving water resources [21]. This watershed has undergone many changes over recent years due to deforestation and changing lands to agricultural and residential area and also decrease in the amount of precipitation. So, in this area, the effects of climate and land use changes on water resources must be assessed and determined for policy makers and planners to adopt suitable and effective strategies and measurements in managing water resources and environmental changes. The effects of land use and climate changes on water resources can be assessed by many methods [18]. Remote Sensing (RS) techniques can provide a better alternative than traditional methods, such as crop simulation and bio economic methods, to monitor and manage natural resources. The advantages of RS are due to its ability in synoptic views, observing objects in different resolution and calibrated sensors to detect changes [22]. As well, assessing meteorological data is an effective way to determine effects of climate change [23]. Remote sensing is a practical technique to monitor and detect land use/cover changes [24,25]. It is able to extract the land use/cover classes at any required time and determine the speed and breadth of these changes [11,26]. Thus, in this research, we combined RS and hydro-meteorological data to detect the effects of land use and climate changes on the availability of water resources in Zaribar Lake basin during the years from 1990 to 2016.
Methods and Materials
Study area
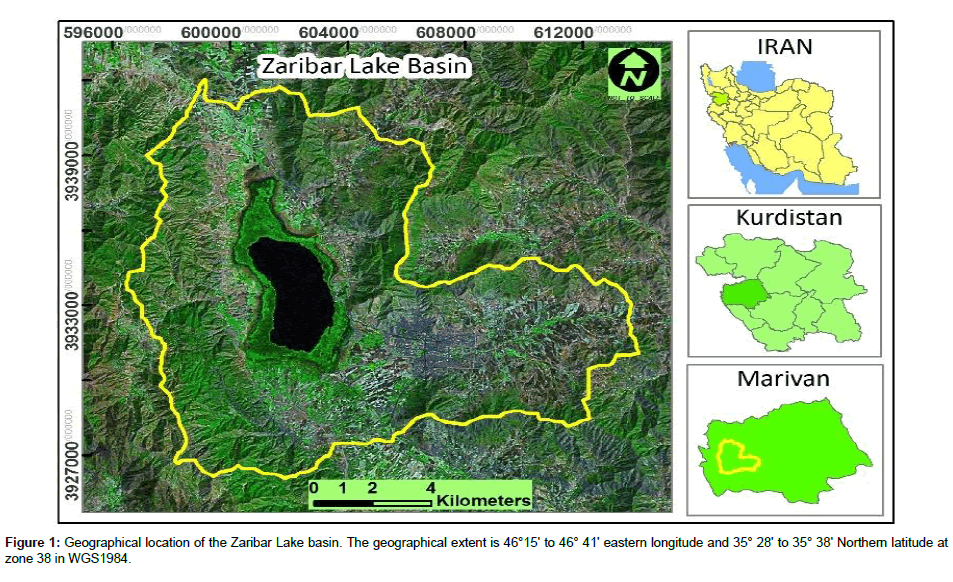
The Zaribar Lake basin is a catchment in Marivan county with an area of 160.18 km2 (Figure 1). This basin is located in the west of Iran. An average elevation is 1320 meters above sea level and the climate is Mediterranean [21], with mean annual precipitation and temperature 991.2 mm and 13.7°C respectively. Most of the precipitation occurs in the late winter and early spring. Mountains and hills are an important part of this watershed. Most of the soil is suitable for steppe plants and Mediterranean semi-humid forest, which is dominated by Oak trees. The watershed feeds a large region where agriculture is the primary land-use and source of income. Farmers mostly produce crops like grape and strawberry which need a lot of water and have traditionally been irrigated through the extraction of ground water.
Zaribar Lake is located at high altitudes and no permanent river enters it. Precipitation is the only natural source to recharge the water of the basin. In 1995, a channel from Ghezelcheso Basin, which is in the northern part of Zaribar Basin was dug, which transfers water to the lake during the spring when precipitation is high. Moreover, in 1994, to increase the volume of water in the lake, a dam was built at the downstream and outlet of the lake. Zaribar Lake acts as a water reservoir in the basin. The outlet forms the Zaribar River that is the only seasonal river which flows from the southern part of the lake and watershed. This river in the event of floods in spring drives water to out of the basin.
Methodology
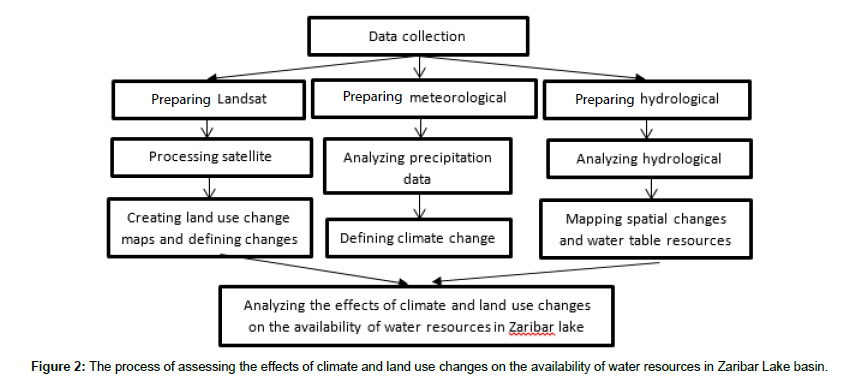
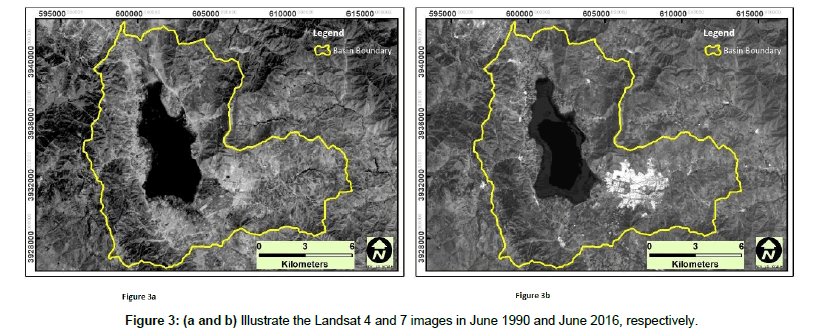
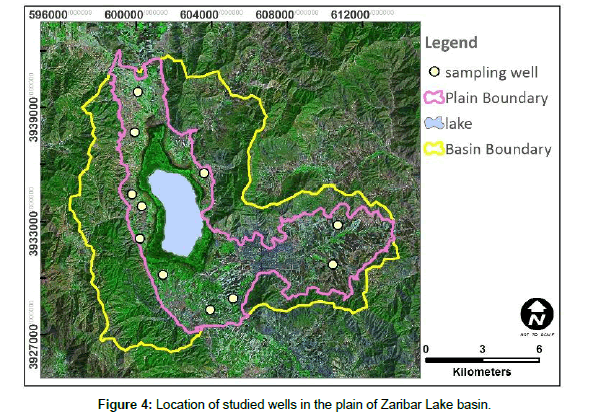
The purpose of this study is to investigate impacts of land use/cover and climate changes on the availability of water resources in Zaribar Lake basin during the years from 1990 to 2016. The general approach outlined in Figure 2 involved surveying Landsat images, and analyzing metrological and hydrological data. To detect land use changes from the beginning to the end of the study period, two Landsat satellite images covering the study area were obtained from the American Geological Survey [27]. Table 1 shows the characteristics of the data source. Figures 3a and 3b illustrate the Landsat 4 and 7 images in June 1990 and June 2016, respectively. The data was analyzed in terms of radiometric errors such as stroke, the error of the hexadecimal classes, and double pixels. To classify land use/cover changes, visual interpretation of images was applied. Using ENVI 5.3 software the bands 2, 3, and 4 of Landsat images were processed, and different classes of land use/cover were detected. Land use/cover were classified into 5 classes consist of, humanmade constructions, lake, everglade, forest, and agricultural lands. The accuracy of the classification of land use maps was investigated using Google Earth images and control points in GPS by field visits of the study area. Kappa coefficient was determined using locating 5 percent of well distributed classes in the region. Kappa coefficient was 0/83. After classifying and assessing the accuracy of the classification method, ArcGIS 10.2 software were used to produce and calculate the area of each class for the years from 1990 to 2016. The role of climate variability on water availability was determined from precipitation record available from the Zaribar meteorological station. To analyze availability of water in the basin in 1990 and 2016, changes in the water table for the recharging and harvesting period were analyzed by interpolating the depth and spatial changes of water in Zaribar Lake and wells. Recharging period is spring and late winter seasons which precipitation is high and water consumption is low, and harvesting period is summer and early autumn seasons when precipitation is low and water consumption due to agricultural activities is high. The changes and the water table of Zaribar Lake were determined from data collected at 11 wells (Figure 4) inside the plain sector of the basin. Kriging Interpolation method in the ArcGIS 10.2 software were used to produce a spatial representation of the eater table from point data at the wells. Although, there are many methods to produce bathymetric maps, interpolation spatial forms are the most commonly used among them. This method has also been designed in GIS applications to support the analysis and work on maps [28]. Finally, the availability and changes in water resources of the Zaribar Lake basin were investigated by analyzing the results and information obtained from the survey of land use and climate changes and water table variations.
| Satellite | Sensor | Datum | Acquisition date | Path | Row |
|---|---|---|---|---|---|
| Landsat 4 | TM | WGS84 | 20/06/1990 | 168 | 35 |
| Landsat 7 | ETM | WGS84 | 19/06/2016 | 168 | 35 |
Table 1: Data source to detect land use changes in Zaribar Lake basin.
Results
Land use changes
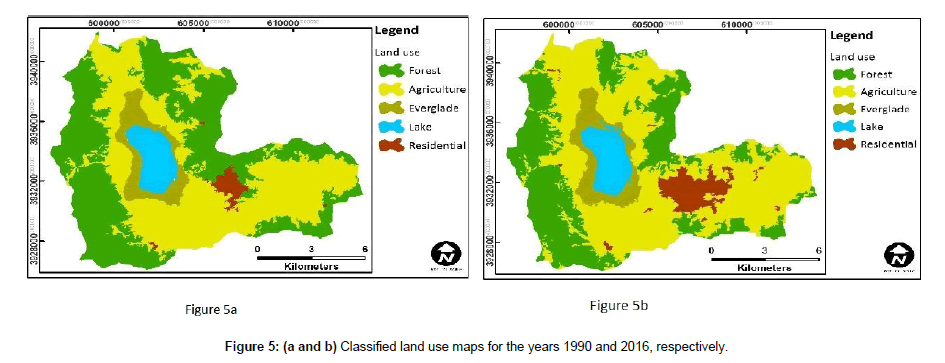
Land use/cover types were classified into 5 categories including, human-made constructions (towns, villages, industrial facilities, mines, etc.), lake, everglade, forest, and agricultural lands. Inside this region, there is no rangeland except that a few very small patches in which are used by farmers to feed livestock. These parts were considered as agricultural lands. The dominant area is oak forests. Figures 5a and 5b show classified land use maps for the years 1990 and 2016, respectively. The total area of the basin is 160/18 km2. According to the land use map in 1990, the forest was the largest land cover with an area of 70.48 km2. The area of the agricultural land calculated 68.1 km2, and everglade around the lake covered 9.97 km2. The area of the lake and Humanmade constructions were 8.66 km2, and 2.97 km2, respectively. Table 2 shows the area of different land uses in 1990 and 2016. According to the land use map in 2016, the forest covers 50.2 km2 of the total. The agricultural lands are 82.25 km2, and everglade around the lake is 10.68 km2. The area of the lake and human-made constructions are 8.72 km2 and 8.33 km2 respectively. Comparing the results of land use maps shows changes in the extant of area of each land uses. The results of land use changes illustrate that agricultural and residential areas have grown dramatically, while the area of forest has declined sharply.
| Land use | Area (Hectares) | Area (Percent) | ||
|---|---|---|---|---|
| 1990 | 2016 | 1990 | 2016 | |
| Forest | 70.48 | 50.2 | 44 | 31.34 |
| Agricultural (Farm and rangeland) | 68.1 | 82.25 | 42.52 | 51.35 |
| Everglade | 9.97 | 10.68 | 6.22 | 6.67 |
| Lake | 8.66 | 8.72 | 5.4 | 5.44 |
| Human-made constructions | 2.97 | 8.33 | 1.86 | 5.2 |
| Total | 160.18 | 160.18 | 100 | 100 |
Table 2: Area of different land uses in 1990 and 2016.
Rainfall variability
The average of annual precipitation is 992 mm. Comparing data shows that there is a strong decreasing trend in precipitation in each year between 1990 and 2016 (Figure 6).
Water table and availability
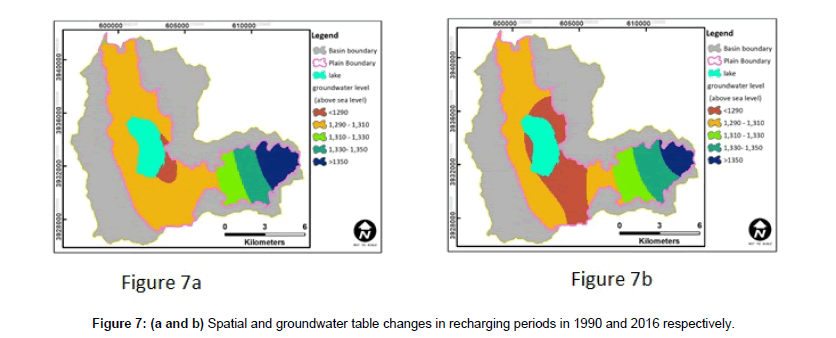
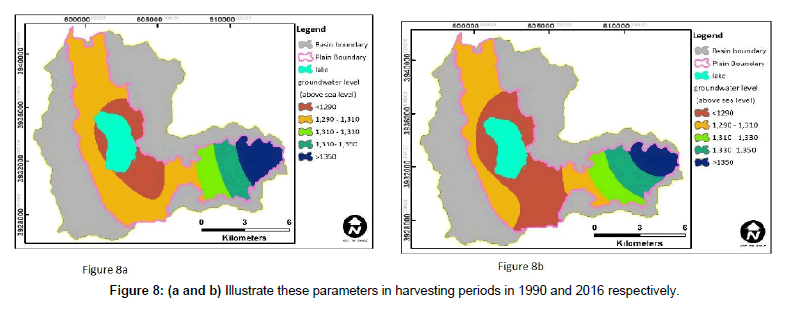
Figures 7a and 7b show spatial and groundwater table changes in recharging periods in 1990 and 2016 respectively, and Figures 8a and 8b illustrate these parameters in harvesting period for these years. Comparing groundwater table in 1990 with 2016 for both feeding and harvesting periods shows that from the year 1990 to 2016 groundwater depth and availability of water has decreased. As well as, the comparison of feeding period with harvesting period in both years of 1990 and 2016 indicates that the water table due to consumption in harvesting period has sharply dropped. The drop of water in the eastern part of the basin is low while in other parts of the basin especially around the lake and southern part is more intensive.
Discussion
It is expected that freshwater availability to be one of the most important societal challenges in the 21st century [29]. Climate variation [30], and land use changes are two important factors which affect the cycle and availability of water resources [31]. In this research, reviewing meteorological data between the years from 1990 to 2016 showed a significant decrease in the amount of annual precipitation, which have reduced water availability in Zaribar Lake basin. In addition, there have been dramatic changes in land use in the area, whit a shift toward land uses which require and consume more water. Studies have showed that in all countries the highest amount of water is consumed to agricultural activities [32,33]. In Iran, agricultural sector consumes more than 90% of exploited water [34]. In most parts of the Zaribar Lake basin forests have been converted to agricultural area, especially in highlands which are vital in preserving and maintaining water. The area of forest has decreased from 44% to 31.34%, while the area of agricultural sector has increased from 42.52% to 51.35%. The extent of these forests due to fire and decrease of precipitation and then water has increasingly decreased, while agricultural area has increased. Agricultural activities in this area relies on traditional irrigation ways and flood irrigation, which consume and waste huge amount of water. Although, the depth of groundwater and water content has decreased, there are a lot of legal and illegal wells that farmers use them to extract and pump water to irrigation crops. After extracting, water transfers through open, long and not well-designed channels which leads to wasting of huge amount of water. In addition, most agricultural products in this region are rice, potato, vegetables, and wheat which are most water intensive products. Land use conversion has led to consumption of more water and reduced water reserves in this region. As a study in China showed that fields irrigation can change the hydrological cycle while reforestation of croplands by decrease the evapotranspiration can increase the water yield fields [35]. Urbanization, especially in developing countries like Iran, has led to land use/cover changes [36]. Like agricultural sector, human population centers or residential areas consume plenty of water due to household consumption [37]. In Zaribar Lake basin the area of these residential sectors has increased from 1.86% in 1990 to 5.2% in 2016, which during this time forest has converted to residential area. Groundwater resource is the only source of water to domestic consumption for all the cities and villages in this region. While water management companies provide water for all people, some people have well inside their properties. The average water consumption in Iran is twice the global average [38]. The exact rate of water consumption in these types of forests are not available, however, based on the literature more generally there seems to be general tendency for residentially areas to consume more water than these forests in this region. In fact, increasing population needs more lands for settling people and feeding them by converting forests to agriculture area. While conversion of large scale forest to pasture by changing microclimate creates a drier and warmer climate, In Mediterranean region due to growing water demand for increasing population and then through household, industry, agriculture is exacerbating pressure on water resources [39]. Therefore, the conversion to residential land use would be accompanied by more water consumption. Most of these changes have occurred around the suburban of Marivan county and in small areas around the villages. The area of the lake has increased slightly from 8.66% in 1990 to 8.72% in 2016. This is due to the Ghezelcheso Channel and Zaribar Dam which were constructed to increase and preserve water in the basin. In addition the debris flows along channels and runoffs can convey a lot of hillslope sediments to lake basin [40,41], which are trapped behind the dam [42]. Prior to the construction of the dam, muddy materials and sediments along the water could move out of the lake during floods. After the construction of the dam, all the sediments from floods and Ghezelcheso Channel have accumulated and deposited in the lake and has reduced the depth of the lake. Consequently, by increasing the volume of sediments on the margin of the lake, suitable conditions have been provided for the growth of everglade around the lake, and its area largely remained unchanged.
Conclusion
Water has an important role in human life and environmental processes. Climate variability and land use/cover changes are two important factors that can affect water availability regionally and locally. Detecting and analyzing these changes can help planners and policy makers to adopt better management and reduce the risks and problems with the shortage of water. In this study, by processing satellite images to detect land use/cover changes and by analyzing meteorological and hydrological data we tried to determine the effects of rainfall variability and land use/cover changes on water resources in Zaribar Lake basin for duration of 26 years from 1990 to 2016. Based on the features and characteristics of this region five land use/cover classes including, forest, everglade, agricultural, residential, and lake area were determined. Then Kappa coefficient was calculated to evaluate classification accuracy, which was 0/83. The results detected that during this time land use and land cover in Zaribar Lake basin has changed. The area of forest has decreased, while agricultural and residential area have increased. Investigations showed that although the sediments inside the lake particularly the edge of the lake has increased, the area of the lake and everglade largely remained unchanged. Analyzing meteorological data showed a significant decrease in the amount of annual precipitation, which have reduced water availability in Zaribar Lake basin. In general, the amount and availability of water resources in Zaribar Lake basin have fallen from 1990 to 2016. Groundwater table have dropped and the depth of water in the lake has also decreased. These are due to climate variation and drop in the amount of precipitation and land use changes. Land use/cover changes in this region between the year from 1990 to 2016 have led to a shrinkage in area of forests which preserve water and an expansion of agricultural and residential lands which require a great deal of water.
References
- UWWAP (2015) The United Nations World Water Development Report 2015: Water for a sustainable world. United Nations World Water Assessment Programme.
- Pervez MS, Henebry GM (2015) Assessing the impacts of climate and land use and land cover change on the freshwater availability in the Brahmaputra River basin. Journal of Hydrology: Regional Studies 3: 285-311.
- Schuol J (2008) Estimation of freshwater availability in the West African sub-continent using the SWAT hydrologic model. Journal of Hydrology 352: 30-49.
- Michel D (2012) Water challenges and cooperative response in the Middle East and North Africa. Brookings Insititution, Washington, DC, USA.
-  López-Moreno JI (2011) Impact of climate evolution and land use changes on water yield in the Ebro basin 15: 311-322.
- Voss KA (2013) Groundwater depletion in the Middle East from GRACE with implications for transboundary water management in the Tigris-Euphrates-Western Iran region. Water Resour Res 49: 904-914.
- Ponpang-Nga P, Techamahasaranont J (2016) Effects of climate and land use changes on water balance in upstream in the Chao Phraya River basin, Thailand. AGNR 50: Â 310-320.
- Tomer MD, Schilling KE (2009) A simple approach to distinguish land-use and climate-change effects on watershed hydrology. J Hydrol 376: 24-33.
- Laurent A, Tushar S, Manashi P, Jae-Hyung J, Adnan R (2017) Streamflow response to potential land use and climate changes in the James River watershed, Upper Midwest United States. J Hydrol Reg Stud 14: 150-166.
- Zhi L, Wen Z, Xun-Chang Z, Fen-Li Z (2009) Impacts of land use change and climate variability on hydrology in an agricultural catchment on the Loess Plateau of China. J Hydrol 377: 35-42.
- Ling Z, Zhuotong N, Wenjun Y, Yingchun G (2015) Hydrological responses to land-use change scenarios under constant and changed climatic conditions. Environ Manage 57: 412-431.
- Gianbattista B, Victoria J, Paul G, Whitehead S, Simon J, et al. (2017) Dynamic response of land use and river nutrient concentration to long-term climatic changes. Sci Total Environ 590: 818-831.
- Â Lambin EF, Geist HJ, Lepers E (2003) Dynamics of land-use and land-cover change in tropical regions. Annu Rev Env Resour 28: 205-241.
- Yin J, He F, Xiong YJ, Qiu GY (2017) Effects of land use/land cover and climate changes on surface runoff in a semi-humid and semi-arid transition zone in northwest China. Hydrol Earth Syst SC 21: 183-196.
- Labat D (2004) Evidence for global runoff increase related to climate warming. Adv Water Resour 27: 631-642.
- Hanak E, Lund JR (2012) Adapting California’s water management to climate change. Climatic Change 111: 17-44.
- Elzie MV, Jason JG, Jesse ED, Ferré TPA, Claudia R, et al. (2017) Interannual to multidecadal climate forcings on groundwater resources of the US West Coast. J Hydrol Reg Stud 11: 250-265.
- Bridget RS, Robert CR, David AS, David EP, Kevin FD (2005) Impact of land use and land cover change on groundwater recharge and quality in the southwestern US. Global Change Biol 11: 1577-1593.
- Â Bahrami A (2010) Land-use change and soil degradation: A case study, North of Iran. Agriculture and Biology Journal of North America 1: 600-605.
- Â Madani K (2014) Water management in Iran: What is causing the looming crisis? J Environ Sci 4: 315-328.
- khoram MR (2012) Assessment of biodiversities and spatial structure of Zarivar Wetland in Kurdistan Province, Iran. Biodiversitas Biodiversitas 13: 135-139.
- Jayanth J, Kumar AT, Shivaprakash K, Krishnashastry S (2016) Identification of land cover changes in the coastal area of Dakshina Kannada district, South India during the year 2004–2008. Egypt. J Remote Sens Space Sci 19: 73-93.
- Â Loehle C (2011) Criteria for assessing climate change impacts on ecosystems. Ecology and Evolution 1: 63-72.
- Saeid M, Saeed K, Hadi R, Jabbar K (2015) Detecting land use changes affected by human activities using remote sensing (Case study: Karkheh River Basin). Curr World Environ 10: 473-481.
- Bruzzone L, Prieto DF (2001) Unsupervised retraining of a maximum likelihood classifier for the analysis of multitemporal remote sensing images. IEEE Trans Geosci Remote Sens 39: 456-460.
- Dewan AM, Yamaguchi Y (2009) Land use and land cover change in Greater Dhaka, Bangladesh: Using remote sensing to promote sustainable urbanization. ‎Appl Geogr 29: 390-401.
- Marcelo C, Joaquim L, Igor O, João L, José S (2015) Assessment of spatial interpolation methods to map the bathymetry of an Amazonian hydroelectric reservoir to aid in decision making for water management. ISPRS Int J Geo Inf 4: 220-235.
- Sheila MWR, Robert IM, Alexander SM, Anthony R, Evan HG, et al. (2015) Finding solutions to water scarcity: Incorporating ecosystem service values into business planning at The Dow Chemical Company’s Freeport, TX facility. Ecosystem Services 12: 94-107.
- Nkhonjera GK, Dinka MO (2017) Significance of direct and indirect impacts of climate change on groundwater resources in the Olifants River basin: A review. Global Planet Change 158: 72-82.
- Yira Y, Diekkrüger B, Steup G, Bossa AY (2016) Modeling land use change impacts on water resources in a tropical West African catchment (Dano, Burkina Faso) J Hydrol 537: 187-199.
- Hartley TW (2006) Public perception and participation in water reuse. Desalination 187: 115-126.
- Kourgialas NN (2018) Groundwater footprint methodology as policy tool for balancing water needs (agriculture & tourism) in water scarce islands-The case of Crete, Greece. Sci Total Environ 615: 381-389.
- Â Abdolmotalleb R, Morteza S, Fatemeh R, Mojtaba K (2017) An empirical analysis of effective factors on farmers adaptation behavior in water scarcity conditions in rural communities. International Soil and Water Conservation Research 5: 265-272.
- Mingliang L, Hanqin T, Guangsheng C, Wei R, Zhang C, et al. (2008) Effects of landâ€use and landâ€cover change on evapotranspiration and water yield in China during 1900â€2000. J Am Water Resour AS 44: 1193-1207.
- Hazhir K, Javad J, Jabbar K, Parisa A (2018) Monitoring and prediction of land use/land cover changes using CA-Markov model: a case study of Ravansar County in Iran. Arab J Geosci 11: 592.
- Rico-Amoros AM (2013) Beyond megaprojects? Water alternatives for mass tourism in coastal Mediterranean Spain. Water Resources Management 27: 553-565.
- Madani KA, Kouchak A, MirchiIran A (2016) Socio-economic drought: Challenges of a water-bankrupt nation. Iranian Studies 49: 997-1016.
- Â Birot Y, Gracia C, Palahi M (2011) Water for forests and people in the Mediterranean region: A challenging balance. European Forest Institute (EFI).
- Petter N, Gary JS, Hugh GS, Patrick NJL (2011) Evidence of debris flow occurrence after wildfire in upland catchments of south-east Australia. Geomorphology 125: 383-401.
- Â Hugh GS, Gary JS, Petter N, David PC, Patrick NJL, et al. (2012) Quantifying sources of fine sediment supplied to post-fire debris flows using fallout radionuclide tracers. Geomorphology 139: 403-415.
- Ramos-Diez I, Navarro-Hevia J, Roberto SMF, DÃaz-Gutiérrez V, Mongil-Manso J (2017) Evaluating methods to quantify sediment volumes trapped behind check dams, Saldaña badlands (Spain). International Journal of Sediment Research 32: 1-11.
Citation: Sadeghi A, Khaledi J, Nyman P (2018) Rainfall Variability and Land-Use Change in Arid Basins with Traditional Agricultural Practices; Insight from Ground Water Monitoring in Northwestern Iran. J Earth Sci Clim Change 9: 498. DOI: 10.4172/2157-7617.1000498
Copyright: © 2018 Sadeghi A, et al. This is an open-access article distributed under the terms of the Creative Commons Attribution License, which permits unrestricted use, distribution, and reproduction in any medium, provided the original author and source are credited.
Share This Article
Recommended Journals
Open Access Journals
Article Tools
Article Usage
- Total views: 3372
- [From(publication date): 0-2018 - Apr 03, 2025]
- Breakdown by view type
- HTML page views: 2569
- PDF downloads: 803

