Research Article Open Access
Rainfall Seasons Analysis as a Guiding Tool to Small Holder Farmers in The Face of Climate Change in Midlands in Zimbabwe
Simba FM* and Chayangira JDepartment of Physics, Geography and Environmental Science Great Zimbabwe University, Zimbabwe
- *Corresponding Author:
- Simba Farai Malvern
Department of Physics
Geography and Environmental Science
Great Zimbabwe University, Zimbabwe
Tel: 26339266645
E-mail: faraimsimba@gmail.com
Received Date: February 15, 2017 Accepted Date: March 21, 2017 Published Date:March 25, 2017
Citation: Simba FM, Chayangira J (2017) Rainfall Seasons Analysis as a Guiding Tool to Small Holder Farmers in The Face of Climate Change in Midlands in Zimbabwe. J Earth Sci Clim Change 8: 392. doi: 10.4172/2157-7617.1000392
Copyright: ©2017 Simba FM, et al. This is an open-access article distributed under the terms of the Creative Commons Attribution License, which permits unrestricted use, distribution, and reproduction in any medium, provided the original author and source are credited.
Visit for more related articles at Journal of Earth Science & Climatic Change
Abstract
A rigorous analysis of trends in rainfall season of an area over a lengthy period of time can be effectively used as a tool to guide small holder farmers in their activities. Climate change adaptation is important to ensure sustainability and survival in rainfed crop farming. In this study two districts (Chirumhanzu and Zvishavane) in the Midlands Province of Zimbabwe were selected and rainfall data for the areas was provided by Zimbabwe Meteorological Services Department. Rainfall characteristics that include onset times, cessation times, length of seasons, total amount of rainfall, number of rainy days, dry spell and risk of water logging were analysed to provide farmers with an indicative picture of possibilities in their respective areas in a bid to reduce risks of crop failure due to uncertainties brought about by climate change and variability. Time series analysis method together with risk analysis were the statistical methods employed to understand better the risk and measures that can be taken by farmers. For Chirumhanzu it was concluded there is a 41% risk of replanting if farmers plant with the first rains received. However, over the period this risk seems to be decreasing. Farmers are encouraged to stagger the planting to minimise risk. Risk analysis showed that for Zvishavane the mean number of rainy days for Zvishavane is 34 with a possibility of 45 days in good seasons and 23 days in poor seasons The tool guides meant for farmers require proper packaging and systematic channels to promote buy-in by the end users of the information.
Keywords
Climate; Crop failure; Farmers; Rainfall; Risk
Introduction
The entire Zimbabwe generally experience unimodal rainfall pattern. The unimodal nature of rainfall corresponds with the southward migration of the Inter-Tropical Convergence Zone (ITCZ) that follows the position of the overhead sun. Small holder farmers have in many years been depended on favourable rainfall patterns for a good yield in Zimbabwe. Farming communities do not only respond to rainfall quantity, but also to variations in time, as a result, the relatively small changes in rainfall frequency may have strong effects on communities [1-3]. The farmers mostly practise rain-fed crop farming with a handful irrigating as this situation is driven by lack of resources and funds to have the irrigation infrastructure.
Climate change is a reality. Studies have found that human activities have contributed to an increase in concentrations of atmospheric greenhouse gases contributing to intensification of heavy rainfall events [4,5]. In recent years, there have been erratic rainfall and noticeable shortening of the seasons worsened by high ambient temperatures resulting in perennial crop failure and droughts [6-8]. Climate change in Zimbabwe also shows a trend similar to the global trend, daytime temperatures over Zimbabwe have risen by up to 0.8°C from 1933 to 1993, which translates to a 0.1°C rise per decade [9]. Precipitation has declined by up to 10% on average over the period 1900 to 1993, which is about 1% per decade. It can also be concluded that warming has been greatest over urban settlements, where both night- time and daytime temperatures show an increase, consistent with the heat island effect. On a national average, minimum ambient temperatures show a cooling trend, whereas maximum temperature shows a warming trend. It is difficult at this stage to attribute the observed climatic trends to any single factor [10,11]. Russell revealed that six warmest years on record in Zimbabwe have occurred since 1987 and that the increased frequency of droughts since 1990 (90/91, 91/92, 92/93, 93/94, 94/95, 97/98, 01/02, 02/03, 04/05, 06/07) is causing a massive drop in crop yields in the country's agricultural sector [12]. Various studies indicated that adaptation to climate change has the potential to significantly reduce negative impacts on crop production [13-15]. There have been discussions involving various stakeholders at different levels on climate change from district level to the national level in the country to try and come up with adaptation strategies that help alleviate the impacts of climate change. Outcomes of deliberations and research undertaken by climate scientists have been forwarded to policy makers to encourage them to mainstream climate change and variability issues in day to day business and be given priority. As such it is imperative to equip policy makers with factual and scientific evidence of the rainfall and temperature patterns that are prevailing in the country for crafting of concrete and sustainable mitigation and adaptation related policies.
One way of helping farmers is to come up with a tool guide of how effective they can respond to certain weather conditions to save their crops or even improve the yield. Understanding rainfall season characteristics that include onset time, cessation time, length and frequency of mid-season droughts or dry spells, rainy days, total amounts, and distribution patterns will to a large extend help reduce the risk of loss and improves levels of preparedness among farmers. Precipitation variations are closely linked to the atmospheric circulation though in this study we did not seek to explore the atmospheric circulations [16]. Zimbabwe is a country with basically two seasons, one that is dry and cold (winter) which comes in May to September and another that is wet and hot (summer) that comes between October and April. Agriculture is the mainstay of the Zimbabwean economy and many people produce for subsistence and a few have extra to sell.
The study seeks to look at the rainfall patterns for the two districts in the province namely Chirumhanzu (Mvuma area) and Zvishavane and seeks to investigate the historical rainfall patterns, understand them and provide farmers in the region with a guide of how best they can cope to an ever changing climate.
Methodology
Study area
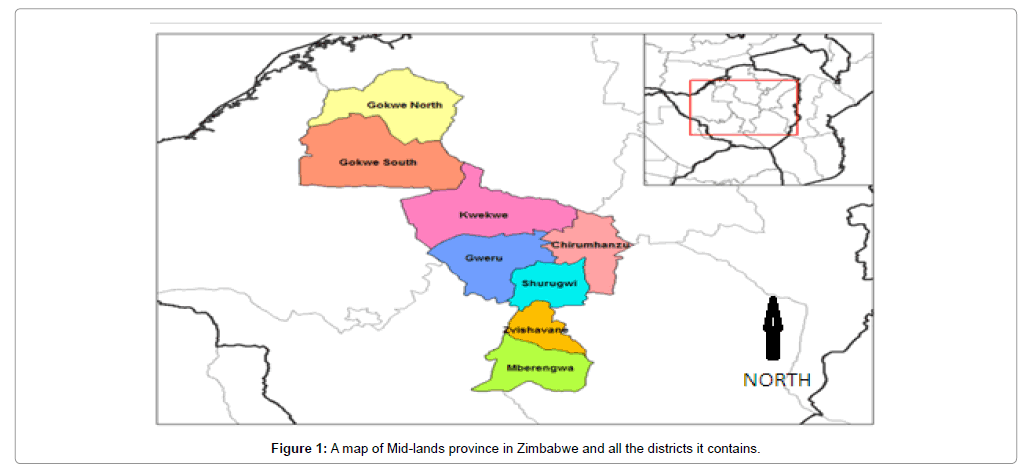
It has an area of 49,166 km² and a population of 1,614,941 million [17]. Gweru is the capital of the province. It is home to various people. As a central point in Zimbabwe it has a blend of Shona, Ndebele, Tswana, Suthu, Chewa among various other languages spoken in Zimbabwe (Figure 1). It has the third largest City in Zimbabwe and that is Gweru, followed by Kwekwe, which is considerably the town with the richest industries in both mining and manufacturing with gold mines all-over [18].
Problem statement
Effective adaptation to climate change by farmers is underpinned on rigorous analysis of the historical climate of a region. In particular trends in rainfall, which is the main determining and problematic variable in crop farming. The risks associated with planting on certain periods, type of seed and planting in areas prone to high dry spell activity for the Midlands Province region in Zimbabwe. Mitigation of these risks will go a long way in improving the yield, and overally build resilience against climate change and variability in communities.
Objectives
To analyse the historical rainfall data characteristics for two districts in Zimbabwe.
To provide small holder farmers with a picture of rainfall season characteristics trends in their districts.
To provide a guiding farming tool to the small holder farmers to cope when faced with certain rainfall phenomenon.
Collected data
The rainfall data was provided by the Zimbabwe Meteorological Services Department (ZMSD) [19]. The data for Zvishavane district spans from 1952 to 2010 and for Chirumhanzu district (Mvuma area) spans from 1914 to 1969. Rainfall characteristics that were analysed are: onset times, cessation times, length of seasons, total amount of rainfall, number of rainy days, dry spell and risk of water logging. Time series analysis was mainly used and probability analysis to estimate risk. The data was analysed using MS Excel spreadsheets. The data was normalised and subjected to a randomness test to make sure it was random. The motive is to target small holder farmers in these districts and beyond in order to prepare them in times of such climatic phenomenon. Graphs mainly were used to illustrate the rainfall events over long periods of time and agro-meteorological recommendations were made to come up with sustainable coping strategies.
Test of randomness (Independence)
The data was subjected to randomness test. Randomness test was carried out by examining Auto Correlation Functions (ACFs). Sample ACF of the residual was computed. Residuals were independent (random) since they did not form any pattern and were statistically insignificant (i.e., they were within Z α/2 standard deviation).
Results
Various rainfall characteristics are explored graphically and agrometeorological inferences and recommendations are provided.
Chirumhanzu climate analysis
Start of season Mvuma: The mean start of the growing season for Chirumhanzu district is around 23 November. This implies that normally if a farmer plants his crops around this time, there will be greater chances of the crops being established successfully and not get affected by a dry spell within the next 20 days. Planting around this time reduces the risks of replanting due to the dry spells. However, there is also a possibility that the growing season might start earliest around the 4th of November. The implication being that farmers in Chirumhanzu district should be prepared in terms of land preparation and input procurement around this time. The latest possible start for the growing season in Chirumhanzu district is the 12th of December. This implies that the optimum planting window for the district is between the 4th of November and the 12th of December with higher chances of success being around the 20th of November and the 26th of November (Figure 2).
End of season Mvuma: On average the growing season in Chirumhanzu district ends on the 14th of April. Farmers should be aware that for crop planning they should be sure that all crops should have reached physiological maturity stage by this time of the year. The growing period may also on earliest end around the 1st of April and may extend further than the 14th of April until the 27th of April. This implies that when farmers are planning their cropping programmes they should have in mind these probabilities which inform them on the likelihood of the season ending. From this analysis, it is clear that the greater possibility, in Chirumhanzu, of the season ending lies towards the end of April than the season ending towards the first week of April (Figure 3).
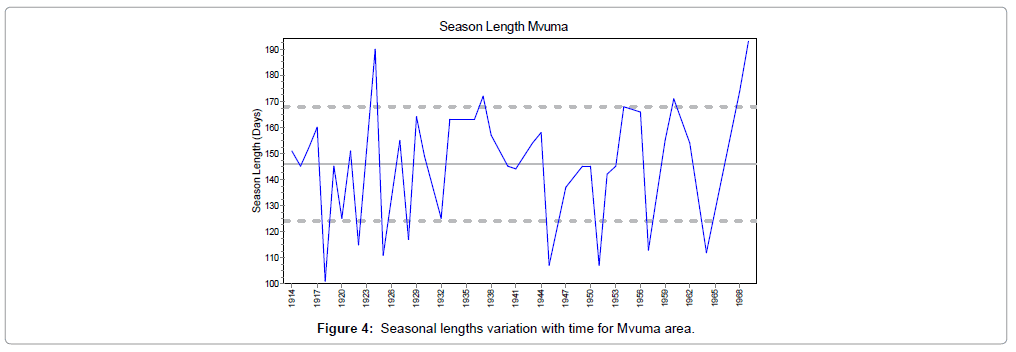
Season length Mvuma: The length of the growing season in Chirumhanzu district averages 146 days. This is important for farmers in selecting crop cultivars that are suitable to their district. Medium to short maturity cultivars provide a greater option in this area as they have greater prospects of reaching maturity than planting crop cultivars which require a longer season. The length of the growing season also ranges from the shortest period of 123 days but may further extend to the longest of about 169 days. The prospect of having a crop reaching maturity gives smallholder farmers an incentive to plant as early as possible. It is also important to note that the season length is not directly related to the amount of rainfall received within a season but can have a relationship with the number of wet days or effective rainfall events. Distribution and reliability of rainfall during the growing season has a stronger influence on the characteristics of the growing season than total rainfall (Figure 4).
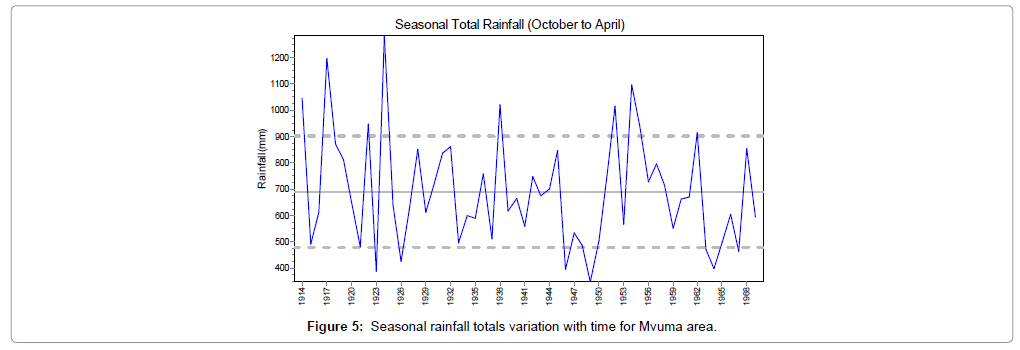
Seasonal rainfall total Mvuma: The mean seasonal total rainfall for Chirumhanzu is 690mm with a possibility of reaching a high total of 900 mm in a good season and a minimum of 480mm in a poor season. However seasonal totals should be taken with caution since they do not reflect distribution and reliability within the season to sustain crop growth (Figure 5).
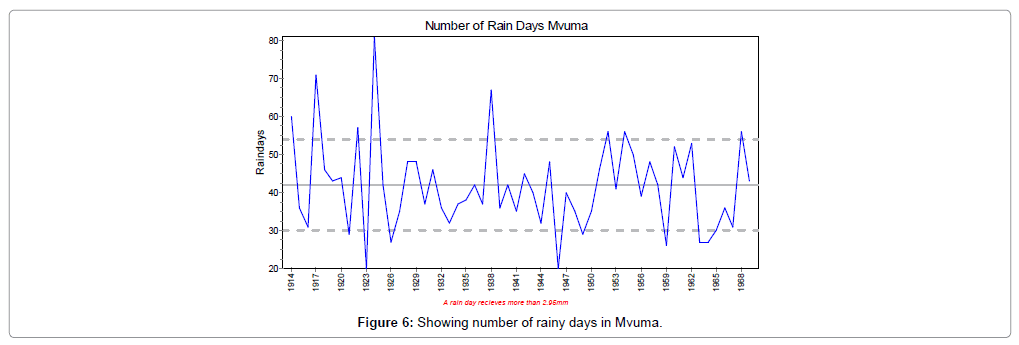
Number of rainy days Mvuma: The mean number of rainy days in Chirumhanzu district is 42 days. It ranges from a lowest of 30 days and a highest of 54 days. The number of rainy days has a direct relationship with the season length and quality for farming activities dependant on rainfall (Figure 6).
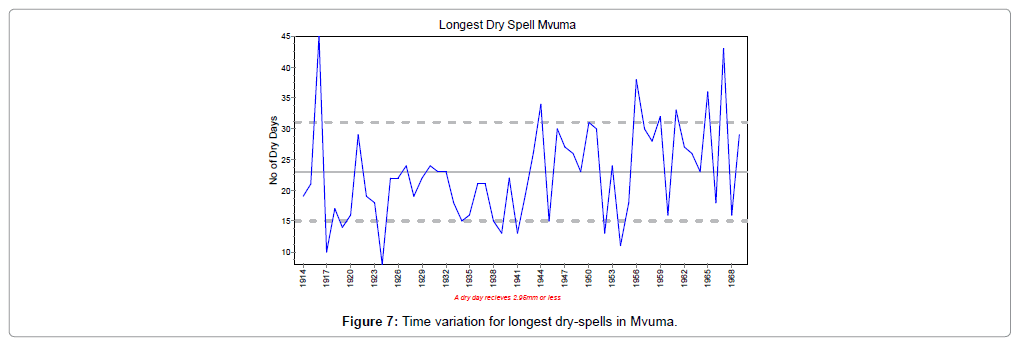
Longest dry spell Mvuma: The longer dry spells generally occur towards the end of the season mainly in March (see graph below on chances of dry spells in Chirumhanzu)The chances of a longer period dry spell increase as the season progresses towards the end, particularly between February and marchThis implies that choice of crops should be informed by the need to avoid coincidence of reproductive stages and occurrence of medium to long period dry spells during the course of the season (Table 1). Chirumhanzu district has a high risk of waterlogging rains in December and February. This implies that when planning their planting and weed management practices farmers should take cognisance of this fact (Figure 7).
| Month | Probability |
|---|---|
| November | 7% |
| December | 36% |
| January | 14% |
| ÃÂ?âÂ?Â?ÃÂ? February | 25% |
| March | 18% |
Table 1: Showing the risk of water logging.
Analysis of Zvishavane climate
Start of season Zvishavane: The mean start of the growing season for Zvishavane district is around the 9th of December. This implies that normally if a farmer plants his crops around this time, there will be greater chances of the crops being established successfully and not get affected by a dry spell within the next 20 days. Planting around this time reduces the risks of replanting due to the dry spells. However, there is also a possibility that the growing season might start earliest around the 16th of November. The implication being that farmers in Zvishavane district should be prepared in terms of land preparation and input procurement around this time. The latest possible start for the growing season in Zvishavane district is the 2nd of January, however it is important to note that this can be attributed to the criteria of start of season of 20 mm of rain in three days. There is also a chance that the growing season will start on the 13th of November, also a probability that four in every ten years the season beginning on the 1st of December. In six out every ten years there is also a chance of the growing season beginning on the 17th of November. There is also a chance that in four out of every five years, the season will begin around the 29th of December (Figure 8).
End of season Zvishavane: On average the growing season in Zvishavane district ends on the 7th of April. Farmers should be aware that for crop planning they should be sure that all crops should mature within the window period. The growing period may also on earliest end around the 21st of March and may extend further than the 7th of April until the 26th of April. This implies that when farmers are planning their cropping programmes they should have in mind these probabilities which inform them on the likelihood of the season ending. From this analysis, it is clear that the greater possibility in Zvishavane of the season ending lies towards the end of April than the season ending towards the end of March (Figure 9).
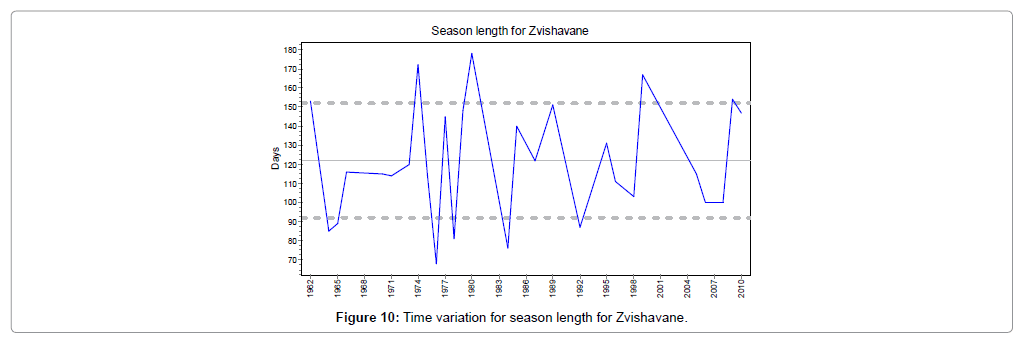
Season Length Zvishavane: The length of the growing season in Zvishavane district averages 121.5 days. This is important for farmers in selecting crop cultivars that are suitable to their district. Medium to short maturity cultivars provide a greater option in this area as they have greater prospects of reaching maturity than planting crop cultivars which require a longer season. It is also important to note that the season length is not directly related to the amount of rainfall received within a season but can have a relationship with the number of wet days or effective rainfall events. Distribution and reliability of rainfall during the growing season has a stronger influence on the characteristics of the growing season than total rainfall. The length of the growing season also ranges from the shortest period of 91 days but may further extend to the longest of about 151 days. However it is important to note exceptional situations, for example in 1975/76 season, Zvishavane experienced about 70 days during the entire growing period. Whilst in 1980/81 the season lengths extend to about 180 days (Figure 10).
Seasonal totals Zvishavane: The mean seasonal total rainfall for Zvishavane is 547 mm with a possibility of reaching a high total of 745 mm in a good season and a minimum of 349 mm in a poor season.
However seasonal totals should be taken with caution since they do not reflect distribution and reliability within the season to sustain crop growth (Figure 11).
Number of rainy days Zvishavane: The mean number of rainy days for Zvishavane is 34 with a possibility of 45 days in good seasons and 23 days in poor seasons. Generally, there is a linear relationship between mean seasonal total and number of rainy days in that season.
This implies that more wet days translate into a longer growing season (Figure 12).
\
Longest dry spell Zvishavane: Title must be more explicative to the analysis and the all the figure must have done by some template (Figure 13).
Risk of 7 day, 14 day and 21 day dry spells: The graph shows the chance of having a dry spell within 30 days from the onset of the growing season.
The risk of experiencing a dry spell is minimal from 9 November to around 9 January implying that this would be the optimal planting window to reduce the risk of crop failure for Zvishavane. The risk of crop failure due to late planting increases after 9 January since there is increasing risk of experiencing 14 and 21 day dry spells
Farmers should take cognisance of the increasing risk of dry spells when planning the planting time (Figure 14).
Risk of replanting Zvishavane: The graph shows the chances of replanting where the green bar show no replanting was done and the blue one show that farmers planted with the first rains received but had to replant due to dry spell soon after planting. Generally, there is a 41% risk of replanting if farmers plant with the first rains received. However, over the period this risk seems to be decreasing. This implies that farmers should take cognisance of the fact that dry planting and planting with the first rains received should be related to the mean start of the season date otherwise there is a risk of crop failure and replanting (Figure 15).
Conclusion
The case study is for two districts in the Midlands province but the concepts generated here can be upscale to other parts of the country. An informed farmer is better prepared than the one without knowledge. A tool guide help to guide decision making, save money, time and in most cases, guarantee a better yield. A good uptake of the recommendations made at household level up to the national level will yield positive results. There are many publications produced meant to guide farmers, but if information is not channelled to them in a systematic manner, there is bound to be resistance. So, if policy makers, extension officers and all the stakeholders involved in crop production engage and adopt recommendations made by researchers and craft a model that promotes buy-in of these ideas, the tool guides will be useful.
References
- Miranda JD, Armas C, Padilla FM, Pugnaire FI (2011) Climatic change and rainfall patterns: Effects of semi-arid plant communities of the Iberian South East. J Arid Environ Vol 75: 1302-1309.
- Smit B, Mc Nabb D, Smithers J (1996) Agricultural adaptation to climatic variation. Climatic Change 33: 7-29.
- Bryant RC, Smit B, Brklacich M, Johnston RT, Smithers J, et al. (2000) Adaptation in Canadian agriculture to climatic variability and change. Climatic Change 45: 181-201.
- Min SK, Zhang X, Zwiers FW, Hegerl GC (2011) Human contribution to more-intense precipitation extremes. Nature 470 : 378-381.
- IPCC Climate Change (2007) The physical science basis. Contribution of Working Group I to the Fourth Assessment Report of the Intergovernmental Panel on Climate Change.
- Jerie S, Ndabaningi T (2011) The impact of rainfall variability on rainfed Tobacco in Manicaland Province of Zimbabwe. J Sustai Deve in Africa.
- Tilya FF, Mhita MS (2007) Frequency of wet and dry spells in Tanzania.
- Gong DY, Shi PJ, Wang JA (2004) Daily precipitation changes in the semi-arid region over northern China. J Arid Environ 59: 771-784
- ZMSD (1996) Meteorological Services. Department of Meteorological Studies, Zimbabwe.
- Unganai L (1996) Historic and future climatic change in Zimbabwe. Climate Research Vol 6: 137-145.
- Mutekwa V (2009) Climate change impacts and adaptation in the agricultural sector: The case of Smallholder farmers in Zimbabwe. J Susta Develop in Africa 11: 237-256.
- Russell J (2008) Zimbabwe: A country at risk of climate change effects.
- Challinor A,Watson J, Lobell DB, Howden SM, Smith DR, et al. (2014) A meta-analysis of crop yield under climate change and adaptation. Nat Clim Chang 4: 287-291.
- Howden SM, Jean-François S, Francesco NT, Chhetri N, Michael D, et al. (2007) Adapting agriculture to climate change. Proc Natl Acad Sci USA 104: 19691-19696.
- Mathugama SG, Peiris TSG (2011) Critical evaluation of dry spell research. Int J Basic Appl Sci 11: 1-8.
- Hurrell JW, Kushnir Y, Ottersen G, Visbeck M (2003) An overview of the North Atlantic Oscillation.
- Anonymous (2012) Empirical results and analysis.
- Rare-Libra (2006) Map of the districts of midlands province of Zimbabwe.
- ZMSD, NACOF (2013) The rainfall outlook for the 2012-2013 season.
Relevant Topics
- Atmosphere
- Atmospheric Chemistry
- Atmospheric inversions
- Biosphere
- Chemical Oceanography
- Climate Modeling
- Crystallography
- Disaster Science
- Earth Science
- Ecology
- Environmental Degradation
- Gemology
- Geochemistry
- Geochronology
- Geomicrobiology
- Geomorphology
- Geosciences
- Geostatistics
- Glaciology
- Microplastic Pollution
- Mineralogy
- Soil Erosion and Land Degradation
Recommended Journals
Article Tools
Article Usage
- Total views: 7701
- [From(publication date):
March-2017 - Apr 03, 2025] - Breakdown by view type
- HTML page views : 6650
- PDF downloads : 1051

