Quantifying SARS-Cov-2 At-Home Using a Lateral Flow Assay and a Smartphone
Received: 04-Oct-2023 / Manuscript No. jabt-23-115610 / Editor assigned: 06-Oct-2023 / PreQC No. jabt-23-115610(PQ) / Reviewed: 20-Oct-2023 / QC No. jabt-23-115610 / Revised: 25-Oct-2023 / Manuscript No. jabt-23-115610(R) / Accepted Date: 26-Oct-2023 / Published Date: 27-Oct-2023 QI No. / jabt-23-115610
Abstract
As of June 1, 2023, the SARS-CoV-2 virus has infected ~700 million people and caused ~7 million deaths worldwide. During the pandemic two types of diagnostic testing were developed in an effort to identify infected people with the goal of limiting the spread of the COVID-19 disease: real-time, quantitative polymerase chain reactions (PCR) that detect the SARS-CoV-2 genome, and lateral flow assays (LFAs) that detect the SARS-CoV-2 nucleocapsid and/or the spike antigens. PCR is used to quantify infection in terms of cycles-to-threshold of detection (Ct) values using saliva or nasopharyngeal samples. Unfortunately, the test employs expensive reagents and instruments and the sample collection-to-result remains 1 to 2 days. In contrast, LFAs are inexpensive, can be used at home and provide yes/no infection information in 15 to 30 minutes. However, the home tests have two limitations: 1) they lack numerical data that indicates the person’s infectious level, and 2) the results are not automatically supplied to agencies that track the number and location of cases. The latter information is crucial to stopping outbreaks. In an effort to provide a product that has the advantages of both methods, we present the development of a smartphone App that correlates the intensities of the test line of at-home LFAs measured by a smartphone camera to their corresponding PCR measured Ct values, with the added capability of sharing results with health agencies. The correlation follows an Avrami equation and covers the Ct value range from 20 to 31. The smartphone App was used to predict the Ct values of 6 purchased samples measured as unknowns with an average Ct difference and standard deviation between predicted and actual values of 0.62±0.21. In use the smartphone App calculated Ct values can be used to categorize the level of infection as not-infected, infected, contagious, and most importantly, highly contagious. As such, the combination lateral flow assay and smartphone is well suited for identifying, quantifying, and slowing the spread of current and future corona and other viruses.
Keywords
COVID-19; SARS-CoV-2; Quantitative polymerase chain reactions (PCR); Lateral flow assays (LFAs)
Introduction
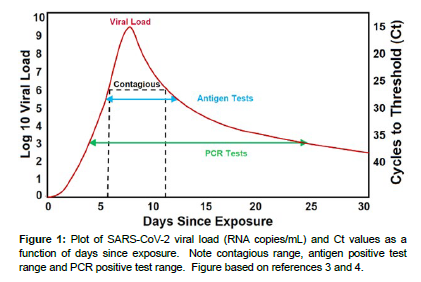
Since the first report of SARS-CoV-2 in December 2019 in Wuhan China [1], over 692 million cases and approximately 6.9 million deaths have been reported worldwide as of October 1, 2023 [2]. The rapid worldwide spread of the disease by inhalation of air and by contact with people and surfaces contaminated with virus-containing droplets, has been facilitated by the ~1 week incubation period, as well as by contagious, asymptomatic people. Since the beginning of the COVID-19 pandemic, numerous methods of diagnostic testing were developed to identify infected people with the goal of treating them, and just as important, isolating them and tracing their location to limit the spread of the disease. Two methods have proven invaluable: realtime, quantitative polymerase chain reaction (PCR) instruments and rapid antigen tests. PCR, the gold standard genetic analysis method, was developed to detect and quantify the SARS-CoV-2 genome. In use a saliva or nasopharyngeal sample is added to a PCR. The PCR employs nucleic acid primers to double the amount of SARS-CoV-2 ribonucleic acid (RNA) in the sample through each temperature cycle. The cycles are repeated until a fluorescent dye attached to the primers increases sufficiently to be detected, otherwise known as the cycles-to-threshold of detection (Ct). The Ct value is an indication of the concentration of the virus in the sample, and a person’s viral load. The fewer cycles needed for detection (lower Ct value), the higher the viral load, and vice a versa. In general, PCR can detect a viral load of 103 to 109.5 RNA copies/mL in a saliva or nasopharyngeal sample expressed as Ct values of 37 to 15, respectively, during the course of a person’s infection from the 3rd to 25th day (Figure 1). 2 Unfortunately, the test employs expensive primers, requires highly trained technicians in a wellequipped laboratory, takes 2-6 hours to perform, and as long as 2 days to provide results. During the delay contagious people may spread the virus to others. Furthermore, a single person’s test may miss the ~6 to 11 day contagious window or report a positive detection for the postcontagious ~12 to 25 days [3].
An alternative method to PCR tests are rapid antigen tests. These tests employ a lateral flow assay (LFA) test strip, in which antibodies are used to bind the SARS-CoV-2 nucleocapsid and/or the spike antigen proteins. In use a nasopharyngeal or saliva (oral fluid) sample is added to a reagent that breaks down the body fluid mucins freeing the SARSCoV- 2 virus antigens, which flows across the LFA when added, and bind to the antibodies at the test line. The antibodies also employ dyes or metal colloids to produce a visible color at the test line confirming the presence of the virus. Once the LFA tests became available, they displaced most of the PCR tests, because people could perform selftests at home, and obtain results in 15 to 30 minutes. Furthermore, the LFAs are inexpensive and often covered by health insurance. Unfortunately, the home LFA tests have two critical limitations: 1) they provide only positive and negative results, lacking numerical data that indicates a positive person’s contagious level, and 2) unlike PCR data, the results are not automatically provided to health agencies, such as the US Centers for Disease Control (CDC), so that the number and location of cases can be tracked. In fact, in the US the number of PCR tests plummeted from a high of ~18 million the first week of January to 6.4 million the last week of February 2022, after free or insurance covered antigen tests became available. Furthermore, only 5% of the antigen tests were self-reported to the CDC. [4]
While the worldwide death rate of the pandemic has dropped considerably as of October 1, 2023, there remains a need for a test that can provide quantitative data like PCR as well as rapid, at-home results like LFAs, along with the ability to provide tracing data for government health agencies. Such data could be used to determine if an outbreak is expanding or waning, based on reported Ct values, i.e. low or high, respectively. The best approach would be to use a smartphone as the measurement device, as they are in widespread use. The idea of using a smartphone to collect and transmit COVID-19 data is not new. Early during the COVID-19 pandemic, China researchers developed a smartphone App to identify subjects as infected or not (red or green displays, respectively) to control access to trains, subways, and buildings [5]. Downloading the App automatically retrieved the smartphone owner’s medical data to produce the display. Similarly, several researchers developed Apps that used smartphone photographs of LFAs, coupled with artificial intelligent, to improve the positive and negative sensitivity and precision statistics. [6] In addition, a broad range of LFA designs, ranging from quantum dots, florescent probes, and imbedded biosensors, were also developed to improve statistics. [7, 8] However, none of these smartphone methods provided quantitative information.
To overcome this limitation we have been developing a highly sensitive LFA in which the test line can be quantified using a smartphone displaying infectious and contagious levels with the ability to report Ct values to government health agencies. Here we present measurements of 19 LFA cassettes covering a range of 16.57 to 31.67 Ct values. To our knowledge, this is the first report of a self-use, at-home test that quantifies the viral load using a smartphone with the ability to categorize infection levels and transmit Ct values.
Materials and Methods
Materials
All reagents, such as non-ionic surfactant, polyvinylpyrrolidone, and tris (hydroxymethyl) aminomethane buffer, were obtained from Sigma-Aldrich (Allentown, PA), while COVID-19 antibodies were obtained from Meridian Bioscience (Cincinnati, OH) and de-identified, pooled saliva samples, with and without the SARS-CoV-2 virus were obtained from Lee Biosolutions (Maryland Heights, MO). Six of these samples with PCR Ct values of 21.07 to 31.67 were measured as unknowns. The virus samples were received in 2 mL plastic vials, and all sample preparations were performed in a Biosafety Level 2 cabinet following standard safety procedures. Non-cotton swabs, 1 mL plastic centrifuge tubes and a manually-set, auto pipetter were used for sample manipulation (all from VWR, Bridgeport, NJ). The LFA cassettes were of standard construction (nanoComposix, San Diego, CA), consisting of 1) a sample pad, 2) a conjugate pad containing probes consisting of synthesized gold nanoparticles coated with a dye and functionalized with mouse monoclonal SARS-CoV-2 nucleocapsid and spike antibodies as capture antibodies, 3) a test line functionalized with mouse monoclonal SARS-CoV-2 nucleocapsid/spike proteins, 4) a control line functionalized with goat anti-mouse IgG antibodies, and 5) a wicking pad, all on 6) a nitrocellulose support, and 7) enclosed in a plastic cassette containing a sample addition port and a viewing section.
Methods
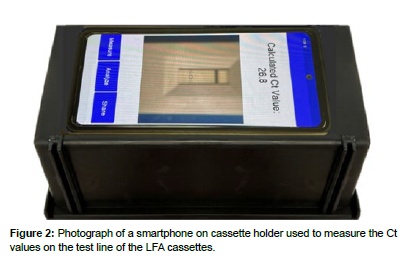
De-identified, pooled saliva Sample 5434 (Lee Biosolutions) with a Ct value of 18.78 was diluted eleven successive times in pooled saliva by 50% to produce a concentration calibration curve. This dilution percent was chosen to mimic the factor of 2 nucleic acid replication achieved from one PCR cycle to the next. Each sample was analyzed as follows: 1) a swab was stirred in one of the saliva samples for 30 seconds, 2) the swab was then inserted into a buffer solution and stirred for 30 seconds, 3) 100 μL of the saliva-buffer solution was added to an LFA sample port by pipette, 4) the cassette was placed in a simple plastic box that aligned the smartphone camera with the cassette test line, and 5) a smartphone App (Real-Time Analysers) was used to measure the reflectance of the LFA test line (Figure 2). The test line for each sample was measured ca. every 2.5 minutes from 0 to 20 minutes, then every 5 minutes from 20 to 30 minutes. Each measurement took less than 5 seconds. In the case of the “unknown” samples, a lab technician was given 5 minutes of instruction on how to prepare the samples, and measure the samples using the smartphone and App. This involved 1) preparing the sample as described above, 2) placing the cassette in the box, 3) launching the App which starts a smartphone 20 minute timer, 4) pressing Measure to read the calculated Ct value after 20 minutes, 5) pressing Analyze to read the infectivity, and 6) pressing Share to send the Ct values through the App to health agencies, and if desired, infectivity level through text or email to selected individuals. For the purpose of this study, the technician simply typed the Ct values into a spreadsheet.
Results
Previously, we developed an LFA to quantify the immunosuppressant drug tacrolimus. [9] The LFA required surface enhanced Raman active probes and a Raman spectrometer to perform the measurements. Based on this success we developed an LFA to quantify the SARSCoV- 2 virus antigens at the test line in terms of Ct values, again using Raman spectroscopy. [10] Unexpectedly, we noticed visible differences at the test line for samples with different Ct values. Based on these differences, an initial series of measurements were performed that suggested that a smartphone could be used to quantify the test line of an LFA in terms of Ct values. [11] This publication is a continuation of that work. Specifically, the following series of reflectance measurements were performed to establish the ability of a smartphone to quantify the test line of an LFA in terms of Ct values: LFA test line repeatability, upper and lower reflectance range with time-dependent stability, measurement time optimization, calibration curve development and unknown sample analysis.
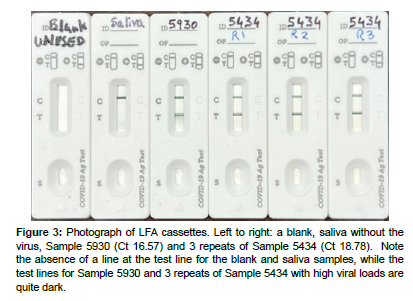
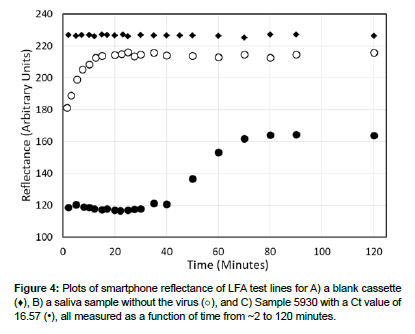
The repeatability of an LFA was determined by measuring the reflectance at the test line 20 times without the addition of a sample. The measurements were very consistant, as expected, with an average reflectance value of 226.7 and a standard deviation of 0.5 (arbitrary units, (Figures 3 and 4). The upper reflectance range and time-dependent stability were established by measuring a saliva sample devoid of the virus, representing a maximum Ct value of 35 or greater. The sample flowed quickly from the cassette port, across the LFA conjugate pad, test and control lines, to the wicking pad in less than 2 minutes. Reflectance measurements were performed for a total of 120 minutes, initially every 2-3 minutes, then 5, 10, and finally 30 minutes after sample addition. Initially, the reflectance increased during the first 20 minutes, and then levelled off at a reflectance of 217 with an average value of 213.5±2.8 for the period of 10 to 30 minutes.
Figure 3: Photograph of LFA cassettes. Left to right: a blank, saliva without the virus, Sample 5930 (Ct 16.57) and 3 repeats of Sample 5434 (Ct 18.78). Note the absence of a line at the test line for the blank and saliva samples, while the test lines for Sample 5930 and 3 repeats of Sample 5434 with high viral loads are quite dark.
The lower reflectance range and test line time-dependent stability were determined by preparing and measuring the lowest Ct sample of 16.57 added to a cassette for a total of 120 minutes at the intervals described above. The reflectance was relatively stable for the first 40 minutes between 117 and 121, after which it increased, presumably due to sample drying, reaching a maximum reflectance of ~165. Since the intent is to measure samples within 30 minutes of adding a sample to the cassette, the average reflectance of 117.5±0.62 between 10 and 30 minutes was determined, as well as the reflectance of 117 at 20 minutes.
Samples 5930, 5434 and 6164 with Ct values of 16.57, 18.78, and 21.07, were purchased to develop a calibration curve with a target lower Ct limit of ~20, since this represents the lower limit of the highly contagious concentration range of ~ 108 DNA copies/mL. Each sample was prepared and measured for a total of 40 minutes in succession as described above. The three samples produced reflectance values of 117.5, 117.5, and 119.8. The measurements of the first two samples indicate that the available antibody sites at the test line were saturated with the conjugate probes, while the latter measurement represents the first non-saturated sample. Consequently, Sample 5434 with a Ct value of 18.78 was used to represent the low end of the quantifiable range for these cassettes and perform repeat and serial dilution measurements.
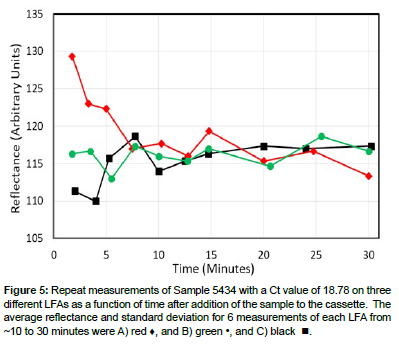
Sample 5434 were added to three cassettes and the reflectances at the test lines for each were recorded every few minutes from ~2 to 30 minutes (Figures 3 and 5). Note that there was considerable scatter in the first 10 minutes, but then the measured reflectance stabilized for the next 20 minutes. In fact the reflectance averages and standard deviations from ~10 to 30 minutes (6 measurements per cassette) were 116.4±4.7, 116.2±2.8, and 116.2±1.6. Furthermore, the reflectance’s for the three cassettes at 20 minutes were similar at 115.3, 114.3, and 117.3 with an average value of 115.8±1.4.
Figure 5: Repeat measurements of Sample 5434 with a Ct value of 18.78 on three different LFAs as a function of time after addition of the sample to the cassette. The average reflectance and standard deviation for 6 measurements of each LFA from ~10 to 30 minutes were A) red ♦, and B) green •, and C) black .
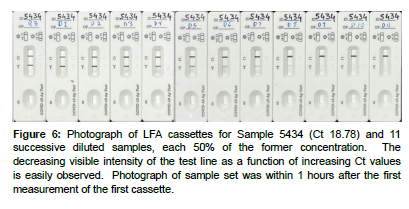
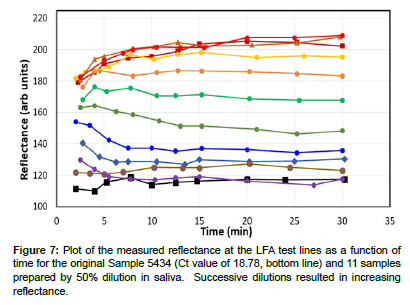
A calibration curve was prepared by diluting Sample 5434 eleven times in saliva by 50% (Figure 6). This dilution percent was chosen to mimic the factor of 2 nucleic acid replication achieved from one PCR cycle to the next. Each sample was prepared as previously described, added to a cassette, and the reflectance measured using the smartphone App from ~2 to 30 minutes. As before the scatter in the initial reflectance measurements stabilized from 10 to 30 minutes (Figure 7).
Figure 6: Photograph of LFA cassettes for Sample 5434 (Ct 18.78) and 11 successive diluted samples, each 50% of the former concentration. The decreasing visible intensity of the test line as a function of increasing Ct values is easily observed. Photograph of sample set was within 1 hours after the first measurement of the first cassette.
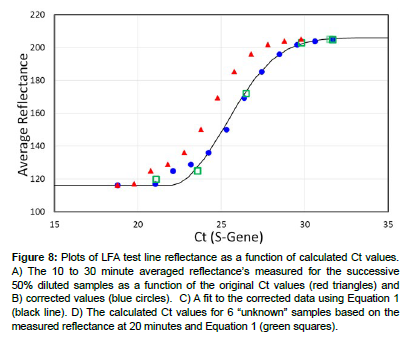
The efficiency of the dilution series was calculated by comparing the reflectance of 205.3 for the final diluted sample to the purchased sample with the lowest concentration, i.e. Sample 5763 with a reflectance of 205. The ratio of the respective Ct values, 29.78/31.67 indicates an average dilution efficiency of 94%. This is attributed to sample loses during the successive sample transfers to produce the dilution series. The Ct values for the dilution series were corrected by multiplying their Ct values by the reciprocal of 0.94. A plot of the 10 to 30 minute average reflectance for the diluted samples as a function of original Ct values and corrected Ct values produced sigmoidal curves (Figure 8), red triangles and blue dots, respectively, (Table 1). The corrected data was fit using the Avrami equation (Equation 1), [12] which has been adapted to many chemical and biological processes [13], including PCR plots of sample fluorescence as a function of Ct values [14]. The equation describes the initial exponential increase in antibody binding at the test line and exponential decrease, when all of the bonding sites at the test line become occupied, viz:
| Dilutions | Sample | Ct (S-gene) | Ct (corrected) | Ref 10-30 Ave |
|---|---|---|---|---|
| 0 | 5434 | 18.78 | 18.78 | 116.3 |
| 1 | 5434 | 19.78 | 21.03 | 117 |
| 2 | 5434 | 20.78 | 22.1 | 124.9 |
| 3 | 5434 | 21.78 | 23.16 | 128.9 |
| 4 | 5434 | 22.78 | 24.22 | 136 |
| 5 | 5434 | 23.78 | 25.29 | 150.2 |
| 6 | 5434 | 24.78 | 26.35 | 169.4 |
| 7 | 5434 | 25.78 | 27.41 | 185.4 |
| 8 | 5434 | 26.78 | 28.48 | 195.9 |
| 9 | 5434 | 27.78 | 29.54 | 201.8 |
| 10 | 5434 | 28.78 | 30.6 | 204.1 |
| 11 | 5434 | 29.78 | 31.67 | 205.3 |
Figure 8: Plots of LFA test line reflectance as a function of calculated Ct values. A) The 10 to 30 minute averaged reflectance’s measured for the successive 50% diluted samples as a function of the original Ct values (red triangles) and B) corrected values (blue circles). C) A fit to the corrected data using Equation 1 (black line). D) The calculated Ct values for 6 “unknown” samples based on the measured reflectance at 20 minutes and Equation 1 (green squares).
Ct = 206-90•(exp[-0.037•(reflectance-21.8)2.15]) Equation…(1)
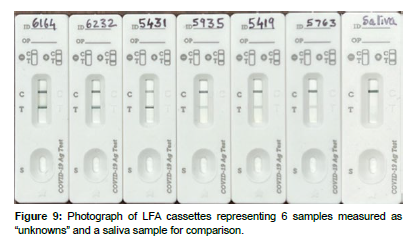
The smartphone App, equipped with Equation 1, was then used to predict the Ct values from the LFA smartphone test line reflectance measurements of the 6 “unknown” samples (Figure 9), ( Table 2). Only a single reflectance measurement was made of each test line at 20 min after addition of the sample to a cassette, as would be the case for an athome measurement. The average error and standard deviation for the calculated 6 “unknown” Ct values were 0.62±0.21.
| Sample | Unknowns | Actual | Calculated | REF at 20 min | Error |
|---|---|---|---|---|---|
| 1 | 6164 | 21.07 | 21.9 | 120 | 0.83 |
| 2 | 6232 | 23.57 | 22.7 | 125 | -0.87 |
| 3 | 5431 | 26.47 | 26.8 | 172 | 0.33 |
| 4 | 5935 | 29.79 | 30.3 | 203 | 0.51 |
| 5 | 5419 | 31.51 | 31 | 205 | -0.51 |
| 6 | 5763 | 31.67 | 31 | 205 | -0.67 |
| Average | 0.62 | ||||
| Std Dev | 0.21 |
Discussion
The relationship presented here between the smartphone measured antigen test line reflectance and Ct values is supported by antigen the >90% correlation between SARS-CoV-2 nucleocapsid antigen and RNA concentrations in nasopharyngeal samples of 140 subjects by quantitative electrochemiluminescence immunoassay and PCR measurements, respectively [15]. Furthermore, the Ct values can be categorized in terms of the level of infection [3].
For the current study, a Ct value less than 21 (reflectance less than 118), indicates in a general sense that a person is highly contagious, Ct values from 21 to 27 (reflectance 120 to 170) indicates contagious, Ct values greater than 27 (171 to 205 reflectance) indicates infected, and no Ct values are provided if the reflectance is greater than 210 and indicates likely not contagious. However, the latter value may represent pre- or post-contagious. A person who has not had any symptoms is likely in the pre-contagious stage, while a person who has had symptoms is likely in the post-contagious stage (Figure 1). Of course some people may not experience symptoms at any time during infection. Currently, the smartphone App provides the user with the above infectious/contagious categories, so they can make a decision regarding self-isolation. Upon downloading the App, the user’s location is requested, such as a zip code in the US, while adding other information is optional, such as age, gender, race, and ethnicity. The user can also share the data with others as desired. Every test, positive or negative, can be automatically forwarded to health departments, such as the CDC, with Ct values to allow monitoring the spread of the virus and potential outbreaks.
It is worth noting that all of the samples tested in this study employed the Delta variant and that the dominant variants in the US and UK as of June 2023 is the Omicron subvariants: XBB.1.5 variant and BQ.1, respectively [16, 17], However, it is known that the use of 3 antibodies, that bind to different sites, the spike protein and 2 nucleocapsid sites, as done here, ensure that equivalent results would be obtained. Meridian Bioscience has confirmed that the SARS-CoV-2 nucleocapsid antibody pair used in our LFA is capable of detecting the conserved nucleoprotein domain of SARS-CoV-2 Omicron variants.
Conclusion
A method to quantify the reflectance of the test line of an LFA in terms of Ct values and severity of SARS-CoV-2 infection using a smartphone was demonstrated. The small scatter in the calculated Ct values demonstrated that the performance of the LFAs were very consistent in terms of probe-to-antigen binding at the conjugate pad, antigen-to-antibody binding at the test line, as well as flow across the LFAs. The consistency and quantitative nature of the data also suggests the LFAs could be used to indicate in a general sense the level of infection as not-infected, infected, contagious, and most importantly, highly contagious (Ct < 21). [18-21] the quantitative upper limit for the LFAs (true positive of infection) was a Ct value of 30. The ability of the smartphone to quantify the level of infection using an at-home antigen LFA test, coupled with the ability to share the data with local and national health departments, specifically the Center for Disease Control, satisfies an important need to control the spread of the virus. This need is ever present, as the number of deaths worldwide is still high, especially in the US and the UK at >58,000 and >45,000 people, respectively, for 2023 through September.2 Finally, the described LFA plus smartphone platform should prove valuable for future pathogen outbreaks.
Acknowledgement
Much of the knowledge used to develop the LFAs was gained by developing LFAs to detect the immunosuppressant drug tacrolimus during a program funded by the Department of Defense, USA Medical Research (W81XWH20-C-0037).
Author Contributions
C.S. developed the probes and designed the LFAs. D.F. developed the App and performed the “unknown” measurements. S.F. performed the dilution and “unknown sample measurements and wrote the manuscript. All authors have read and agreed to the published version of the manuscript.
Data Availability Statement
Not applicable.
Conflicts of Interest
The authors declare no conflicts of interest. The funders had no role in the design of the study, in the collection, analyses, or interpretation of the data; in the writing of the manuscript; or in the design of the published results.
Sample Availability
Not applicable.
References
- N Zhu, D Zhang, W Wang (2020) “A novel coronavirus from patients with pneumonia in China, 2019”, N Engl J Med 382: 727.
- www.worldometers.info/coronavirus/ accessed 1, Oct 2023.
- MJ Mina, R Parker, DB Larremore (2020) “Rethinking Covid-19 test sensitivity-a strategy for containment”, N Engl J Med 383:22.
- MD Ritchey, HG Rosenblum, K Del Guercio (2022) “COVID-19 Self-Test Data: challenges and opportunities -United States”, Morb Mortal Wkly Rep 71: 1005.
- P Mozur, R Zhong, K Aaron (2020) “In coronavirus fight, China gives citizens a color code, with red flags”, The New York Times, March 1
- DA Mendels, L Dortet, C Emeraud, T Naas (2021) “Using artificial intelligence to improve COVID-19 rapid diagnostic test result interpretation”, PNAS 118:e2019893118.
- WW Hsiao, TN Le, DM Pham (2021) “Recent advances in novel lateral flow technologies for detection of COVID-19”, Biosensors 11: 295.
- M Chabi, B Vu, K Brosamer (2023) “Smartphone-read phage lateral flow assay for point-of-care detection of infection ”, Analyst 148: 839
- S Farquharson, C Shende (2022) “Detection of tacrolimus in saliva using a lateral flow assay and surface-enhanced resonance Raman scattering”, J Anal Bioanal Tech, 13:3
- C Shende, D Farquharson, S Farquharson, submitted US Patent Office, June 2023.
- C Shende, D Farquharson, S Farquharson (2023) “Development of a saliva-based lateral flow assay for SARS-Cov-2 with the potential to quantify viral load”, J Anal Bioanal Tech 14: 6
- M Avrami, “Kinetics of phase change. 1 General theory”, J Chem Phys, 1939: 1103.
- Shirzad K, Viney C. (2023) “A critical review on applications of the Avrami equation beyond materials science”. J. R. Soc. Interface 20:1.
- CM Victoriano, ME Pask, NA Malofsky (2022) “Direct PCR with the CDC 2019 SARS-CoV-2 assay: optimization for limited-resource settings” Sci Rep, 12: 11756.
- NR Pollock, TJ Savage, H Wardell, RA Lee, A Mathew, et al. (2021) “Correlation of SARS-CoV-2 nucleocapsid antigen and RNA concentrations in nasopharyngeal samples from children and adults using an ultrasensitive and quantitative antigen assay”, J. Clin Microbio 59: e03077-20.
- “Variant Proportions”, covid.cdc.gov/covid-data-tracker/#variant-proportions, accessed June 2023
- www.gov.uk/government/news/covid-19-variants-identified-in-the-uk-latest-updates, accessed June 2023
- Bayat SA, Mundodan J, Hasnain S (2021) “Can the cycle threshold (Ct) value of RT-PCR test for SARS CoV2 predict infectivity among close contacts?”, J Infect Pub 14: 1201.
- A Singanayagam, M Patel, A Charlett (2020) “Duration of infectiousness and correlation with RT-PCR cycle threshold values in cases of COVID-19, England”, Euro Surveill 25: 13.
- AA Rabaan, R Tirupathi, AA Sule (2021) “Viral dynamics and real-time RT-PCR Ct values correlation with disease severity in COVID-19” Diagnostics 11: 1091.
- TC Jones, G Biele, B Mühlemann (2021) “Estimating infectiousness throughout SARS-CoV-2 infection course.”, Science 373: 6551.
Google Scholar, Crossref, Indexed at
Google Scholar, Crossref, Indexed at
Google Scholar, Crossref, Indexed at
Google Scholar, Crossref, Indexed at
Google Scholar, Crossref, Indexed at
Google Scholar, Crossref, Indexed at
Google Scholar, Crossref, Indexed at
Google Scholar, Crossref, Indexed at
Google Scholar, Crossref, Indexed at
Citation: Shende C, Farquharson D, Farquharson S (2023) Quantifying SARSCov- 2 At-Home Using a Lateral Flow Assay and a Smartphone. J Anal Bioanal Tech 14: 569.
Copyright: © 2023 Shende C, et al. This is an open-access article distributed under the terms of the Creative Commons Attribution License, which permits unrestricted use, distribution, and reproduction in any medium, provided the original author and source are credited.
Share This Article
Open Access Journals
Article Usage
- Total views: 1717
- [From(publication date): 0-2023 - Apr 20, 2025]
- Breakdown by view type
- HTML page views: 1455
- PDF downloads: 262

