Quantifying Induction/Inhibition Effects on Fuzuloparib Using a Physiologically Based Pharmaco-Kinetic (PBPK) model
Received: 26-Aug-2022 / Manuscript No. JCEP-22-72965 / Editor assigned: 30-Aug-2022 / PreQC No. JCEP-22-72965 (PQ) / Reviewed: 13-Sep-2022 / QC No. CEP-22-72965 / Revised: 19-Sep-2022 / Manuscript No. JCEP-22-72965 (R) / Published Date: 26-Sep-2022 DOI: 10.4172/2161-0681-22.12.415
Abstract
Fuzuloparib was approved in China in 2020 for treating ovarian and other solid cancers in patients with germline BRCA (breast cancer gene) receiving second-line or above chemotherapy. It is a Poly Adenosine diphosphate-Ribose Polymerase (PARP) inhibitor developed by Jiangsu Hengrui Medicine Co., Ltd. PARP inhibits DNA repair in cancer cells, induces cell cycle arrest and further inhibits tumour cell proliferation. The main metabolic enzyme involved in fuzuloparib is CYP3A4/5. The purpose of this study is to use the PBPK model to predict and compare the effects of the inducers and inhibitors on the Pharmaco-Kinetics (PK) of fuzuloparib. Based on the in vivo and in vitro data, a PKPB model was developed using B2O simulator (Shanghai Yinghan Pharmaceutical Technology Co., Ltd). The model was verified using the clinical study of fuzuloparib with moderate inhibitor fluconazole and strong inducer rifampicin. After validation, the model was used to predict the effects of the mild inhibitor fluvoxamine and moderate inducer efavirenz on fuzuloparib exposure in vivo. No clinical study has been published to investigate the effects of efavirenz or fluvoxamine on fuzuloparib. The model predicted that the AUC0-t of fuzuloparib under the action of the efavirenz and fluvoxamine were 0.71 and 1.14 times of the original, respectively. It is suggested that efavirenz significantly affects fuzuloparib exposure and should be avoided when used together with fuzuloparib. Fluvoxamine 50 mg has no significant effect on fuzuloparib exposure. Higher doses of fluvoxamine increase the risk and should be used with caution.
Keywords: CYP3A; Inhibitor; Inducer; Fuzuloparib; Pharmacokinetic/Pharmacodynamic model; Drug-drug interact
Introduction
Fuzuloparib is a PARP inhibitor independently developed by Jiangsu Hengrui Medicine Co. Ltd for treating ovarian cancer and other solid cancers in patients with germline BRCA mutation who have undergone second-line or above chemotherapy. Preclinical pharmacological results showed that fuzuloparib could significantly inhibit PARP activity and tumour growth in vivo and in vitro, and have significant anti-tumour effects [1-6]. In the dose-escalation study, fuzuloparib exposure Cmax and AUC0-t generally increased in a dose-proportional manner over the dose range from 10 mg to 200 mg after administering a single dose of fuzuloparib [4]. Food delayed the Tmax absorption from 3 h on an empty stomach to 6 h after a meal, while the effects on exposure to AUC0-t and Cmax were insignificant [7]. In vitro study of fuzuloparib with human liver microsomes cytochrome P450 enzymes (CYP450) indicated that CY3A4/5 is the primary CYP isoform involved in the metabolism of fuzuloparib [6]. It is necessary to study the Drug-Drug Interactions (DDI) between drugs metabolised by CYP3A4/5 and fuzuloparib. For example, enzyme induction by drugs and other xenobiotic chemicals were discovered more than 30 years ago. The induction could increase the metabolism and clearance of a pharmacologically active drug, leading to a reduction in pharmacological activity [8].
This study aims to predict the effects of mild metabolism-inhibitor fluvoxamine and moderate metabolism-inducer efavirenz on fuzuloparib exposure. The PBPK model successfully predicted the impact of fluconazole (a moderate inhibitor) on drug substrates metabolized primarily by CYP2C9 and CYP3A [9]. It is the first time to use this model to predict the induction effect of an inducer on a substrate like fuzuloparib. Dosing guidance was also provided following the modelling studies. In this study, the PBPK model was established based on the mechanism of DDI and the influence of liver blood-drug concentration of inhibitor/inducer on enzyme activity. Blood concentrations of fuzuloparib taken on an empty stomach and after a meal were used to verify the model. The PBPK model was further verified by comparing the DDI of rifampicin and fluconazole with clinical data. Concomitant use of rifampicin can lead to altered metabolism or transport of other drugs that are either metabolised by cytochromes P450 or transported by p-glycoprotein in the gastrointestinal tract and liver [10]. After verification, the model was subsequently used to predict the DDI of moderate inducer efavirenz and mild inhibitor fluvoxamine on fuzuloparib exposure in healthy subjects.
Material and Methods
PBPK models
The PBPK model in B2O simulator has been used to predict the inhibition effect of fluconazole on substrates such as vismodegib, Lemborexant, ospemifene, zafirlukast, flurbiprofen, rivaroxaban, and avatrombopag. The classic two-compartment included the central circulation and tissue distribution, and used the mathematical equations adapted from Kato studies in 2005 and 2008 [11,12]. When evaluating induction effects, the clearance rate of the substrate is,
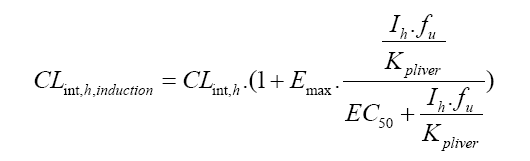
CLint,h is the hepatic clearance rate. Emax is the maximum induction ratio. Ih is the hepatic concentration. fu is the unbound fraction of the drug in the liver. Kpliver is the ratio of liver to plasma concentration. EC50 is the concentration of the inducer at half maximum induction.
The PBPK model was first established and validated using clinical data on the observed effects of food, and then validated using the moderate inhibitor fluconazole and the strong inducer rifampicin, respectively. The same dose and dosage form of the clinical trial studies were used in the fuzuloparib PBPK model. To ensure the feasibility of detection and minimal impact on the healthy subjects, the dose of fuzuloparib in the study was selected as 50 mg/day [6].
In vitro and in vivo parameters were used during modelling. In vitro data described the physicochemical properties and metabolism of the drug. The drug’s absorption, distribution, and elimination parameters, such as Ka, V1, K12, K21, and τ, were derived from in vivo data. Ka is the absorption rate. V1 is the central compartment volume. K12/K21 is the absorption and elimination rate of the tissue compartment in the two-compartment model, and τ is the delay time. When K12/K21=0, a one-compartment model was used in the simulation.
Simulations of DDIs
No clinical studies have been published on the effects of the moderate inducer efavirenz or the mild inhibitor fluvoxamine on fuzuloparib. Based on the dose information published by Jiangsu Hengrui Medicine Co. LTD [4], efavirenz was orally taken 600 mg/day until the plasma concentration reached a steady state, and then fuzuloparib 50 mg was orally taken in combination. For inhibitor, fluvoxamine was orally taken 50 mg/day until the plasma concentration reached a steady state, and then fuzuloparib 20 mg was orally taken in combination. Fifty healthy men were simulated in both studies.
PBPK modelling software
This study used a web-based platform B2O simulator to simulate drug exposure in the presence of DDI. Ratios between exposures with and without DDI perpetrator (inducer or inhibitor) were calculated and compared with clinical studies (if available). With the lower and upper CI% (confidence interval) limits of 2.5%-97.5%, the geometric mean of all Cmax and AUC0-t were calculated. Changes that were ≥ 2 fold were considered significant.
Results
Parameters used in the PBPK model
Parameters were first used to simulate single drug plasma concentrations to evaluate the model’s performance at the beginning of modelling. The parameters were adjusted to fit the single drug model best, and the results are shown in Table 1. The drug is assumed to be completely metabolized by CYP3A4 and fm=1. Kpliver values were calculated by the method introduced by Poulin 2002 [13], and Rodger 2006 [14]. Referring to the physiological parameters and coefficient of variation of healthy people [15,16], the inter-subject coefficient of variation of Ka, V1, CLint, Ka, i, V1, i, CLint, i, Ki, EC50 and Emax were set to 30%.
All parameters are assumed to be normally distributed, and only positive values were selected when the coefficient of variation was increased. When the absorption fraction F a <1 and the coefficient of variation of Fa is 15%, it is assumed that Fa is uniformly distributed, and the value range is (0.85, 1). If Fa =1, the bioavailability of the corresponding drug is 1, and there is no coefficient of variation (Table 1).
Parameter description: Kpliver liver tissue partition coefficient to plasma, Fa absorption fraction, Fg gastrointestinal bioavailability, Ka absorption rate, fu plasma unbound drug fraction, BP whole blood plasma fraction,V1 central compartment volume, CLr renal clearance,CLint inherent liver clearance, K12/K21 absorption and elimination rate of the tissue compartment in the two-compartment model, fm, CYP3A4 metabolic fraction,τ delay time, Ki inhibition constant, Emax inducer maximum effectiveness, EC50 half effective concentration of the inducer.
Fuzuloparib PBPK model and verification
The parameters in Table 1 were used to establish the fuzuloparib model, and the simulation results were verified with the clinical study, in which 16 healthy individuals each took 120 mg of fuzuloparib on an empty stomach [7]. From Figure 1, we can see that the simulated drugtime curve covered the observation results. The predictions of related PK parameters AUC0-t, Cmax, and Tmax were similar to the observed values (Table 2). The observed value of AUC0-t in the clinical trial was 33.0 µg h/ml, and the predicted value (mean) was 28.1 µg h/ml. The observed value of Cmax in clinical trials was 2.76 µg/ml, and the predicted value (mean) was 2.54 µg/ml (Figure 1).
| Drug | Fuzuloparib | Rifampicin | Fluconazole |
|---|---|---|---|
| Category | Substrate | Inducer | Inhibitor |
| Medication time | Fasting | Fasting | After meal |
| Substrate dose (mg) | 120 | 50 | 20 |
| Inducer/inhibitor dose (mg) | / | 600 | 400 |
| Kpliver | 1 | 10.6 | 0.714 |
| Fa | 0.87 | 1 | 0.95 |
| Fg | 1 | 1 | 0.948 |
| Ka(1/h) | 1.56 | 0.51 | 0.861 |
| fu | 0.184 | 0.15 | 0.89 |
| BP | 0.825 | 0.9 | 1 |
| V1 (L) | 30.8 | 23.43 | 60.1 |
| CLr (L/h) | 0.678 | 1.2 | 0.388 |
| CLint, CYP3A4 (L/h) | 15.06 | 41.6 | 0.118 |
| K12 (1/h) | 0 | 0 | 0 |
| K21 (1/h) | 0 | 0 | 0 |
| fm of CYP3A4 | ~1 | / | / |
| τ | 2.65 | / | 0 |
| Ki(µg/L) | / | / | 2910 |
| Emax | / | 12.3 | / |
| EC50 (μg/L) | / | 697.1 | / |
Table 1: Prediction of PK parameters for use in the PBPK model.
| Observations (n=16) | Predicted values (n=50) | |||||
|---|---|---|---|---|---|---|
| Parameter | Cmax (μg/ml) | AUC0-t (h*μg/ml) | Tmax (h) | Cmax (μg/ml) | AUC0-t(h*μg/ml) | Tmax (h) |
| Geometric mean | 2.76 | 33 | 3 | 2.54 | 28.1 | 4.53 |
| Standard Deviation(SD) | 0.8 | 15.1 | 1.5- 6 | 1 | 8.71 | 0.44 |
Note: *Clinical observations used 90% CI (confidence interval).
Table 2: Comparison of PK parameters of clinical observations and PBPK modelling of fuzuloparib.
| Coadministration | Predictions | Observations | |||
|---|---|---|---|---|---|
| AUC0-t R | CmaxR | AUC0-t R* | CmaxR* | ||
| Fluconazole | Geometric mean | 2.49 | 1.16 | 2.05 | 1.32 |
| 95% Lower limit | 1.31 | 1.04 | 1.93 | 1.23 | |
| 95% Upper limit | 3.68 | 1.29 | 2.16 | 1.43 | |
| Rifampin | Geometric mean | 0.15 | 0.56 | 0.1 | 0.32 |
| 95% Lower limit | 0.1 | 0.36 | 0.095 | 0.281 | |
| 95% Upper limit | 0.2 | 0.75 | 0.115 | 0.365 | |
Note: Tmax refers to the median values (minimum-maximum). *Clinical observations used 90% CI (Confidence Interval).
Table 2: Comparison of PK parameters of clinical observations and PBPK modelling of fuzuloparib.

Figure 1: Predictions (lines, n=50) and the mean observed values (points, n=8) of the plasma concentration of fuzuloparib taken on an empty stomach. 
Simulation and verification of fuzuloparib model with moderate inhibitor fluconazole
Based on the clinical study [20], fuzuloparib was administered as a single 20 mg oral dose or co-administered with 400 mg fluconazole in healthy male subjects. The simulation results of fuzuloparib 20 mg alone and with fluconazole 400 mg are shown in Figure 2a and 2b. From the figures, we can see that the simulated drug-time curve covered the observation results well. When fuzuloparib and fluconazole were taken together, the exposure data of fuzuloparib AUC0-t was 2.49 times that of the single oral administration, and Cmax was 1.16 times that of the single oral administration (Table 3). The predicted value matched the observed value, and the predicted results were within two times the observed results (Figure 3), indicating that the model reasonably predicted drug exposure. Fuzuloparib exposure was significantly increased when coadministered with fluconazole, and it is not recommended to be taken together with the moderate inhibitor fluconazole( Figure 4).
| Coadministration | Predictions | Observations | |||
|---|---|---|---|---|---|
| AUC0-t R | CmaxR | AUC0-t R* | CmaxR* | ||
| Fluconazole | Geometric mean | 2.49 | 1.16 | 2.05 | 1.32 |
| 95% Lower limit | 1.31 | 1.04 | 1.93 | 1.23 | |
| 95% Upper limit | 3.68 | 1.29 | 2.16 | 1.43 | |
| Rifampin | Geometric mean | 0.15 | 0.56 | 0.1 | 0.32 |
| 95% Lower limit | 0.1 | 0.36 | 0.095 | 0.281 | |
| 95% Upper limit | 0.2 | 0.75 | 0.115 | 0.365 | |
Note: Tmax refers to the median values (minimum-maximum). *Clinical observations used 90% CI (Confidence Interval).
Table 3: The effects of inducers/inhibitors on the plasma exposure of fuzuloparib.
| Drug | Efavirenz | Fluvoxamine |
|---|---|---|
| Category | Inducer | Mild inhibitor |
| Medication time | Fasting | After meal |
| Substrate dose (mg) | 50 | 20 |
| Inhibitor/inducer dose (mg) | 600 | 50 |
| Kpliver | 1.994 | 5.73 |
| Fa | 0.67 | 0.971 |
| Fg | ~1 | 1 |
| Ka(1/h) | 0.41 | 0.416 |
| fu | 0.029 | 0.23 |
| BP | 0.74 | 1 |
| V1 (L) | 67 | 90.5 |
| CLr (L/h) | 6.8 | 0.0597 |
| CLint (L/h) | 171 | 348 |
| K12 (1/h) | 0.29 | 0 |
| K21 (1/h) | 0.09 | 0 |
| Ki (µg/L) | / | 0.0283 |
| Emax | 6.5 | 0 |
| EC50 (μg/L) | 1.2312 | 0 |
| τ | / | 0 |
Note: AUC0-t R is the ratio of the AUC0-t of fuzuloparib with inducer/inhibitor to the AUC of the fuzuloparib alone; CmaxR is the ratio of the exposure Cmax of fuzuloparib with inducer/inhibitor to the Cmax of the fuzuloparib alone. *Clinical observations used 90% CI (confidence interval).
Table 4: Establishment of PBPK model and prediction of key PK parameters.

Figure 2: (a) Predictions (lines, n=50) and the mean observed values (points, n=20) of the plasma concentration of fuzuloparib 20 mg taken with 400 mg fluconazole after a meal; (b) predictions (lines, n=50) and the mean observed values (points, n=20) of the plasma concentration of fuzuloparib 20 mg taken alone after a meal. 

Figure 3: The effect of fluconazole and inducer rifampicin on the ratio of fuzuloparib exposure AUC0-t. Blue dots: the exposure AUC0-t values of fluconazole and rifampicin; Blue line: predicted values of AUC0-t of fluconazole and rifampicin; red line: the interval of 0.5-2 times difference of the prediction.
Simulation and verification of fuzuloparib model with strong inducer rifampicin
Based on the clinical study [6], in healthy male subjects, fuzuloparib was administered as a single 50 mg oral dose alone or co-administered with 600 mg rifampicin. The simulation results of fuzuloparib observation results well. When fuzuloparib and rifampicin were taken together, the exposure AUC0-t of fuzuloparib was reduced by 85% (AUC0-t R=0.15) compared with single oral administration, and Cmax was reduced by 44% (CmaxR=0.56) compared with single oral administration (Table 3, predictions). The predicted value matched the observed value, and the predicted results were within two times the observed results (Figure 3), indicating that the model reasonably predicted drug exposure. Fuzuloparib exposure was significantly reduced when co-administered with rifampicin.

Figure 4: (a) Predictions (lines, n=50) and the mean observed values (points, n=15) of the plasma concentration of fuzuloparib 50 mg taken with 600 mg rifampicin after a meal; (b) Predictions (lines, n=50) and the mean observed values (points, n=15) of the plasma concentration of fuzuloparib taken alone after a meal. 
Prediction of fuzuloparib with mild inhibitor fluvoxamine
Physiological and in vivo relevant parameters used to predict the fluvoxamine effects on fuzuloparib exposure are listed in Table 4. Parameters were adjusted to fit the single drug model best firstly.
Parameter description: Kpliver the partition coefficient of liver tissue to plasma; Fa the absorption fraction; Fg the gastrointestinal bioavailability; Ka is the absorption rate; fu the plasma unbound drug fraction; BP the whole blood plasma fraction; V1 the central compartment volume; CLr the renal clearance; CLint the inherent liver clearance; K12/K21 the absorption and elimination rate of the tissue compartment in the two-compartment model; τ the delay time; Ki the inhibition constant; Emax inducer maximum effectiveness; EC50 the half effective concentration of the inducer (Figure 5).
The plasma concentrations of fuzuloparib 50 mg alone and with efavirenz 600 mg are shown in Figure 6a and 6b. The ratios of related PK parameters AUC0-t and Cmax of fuzuloparib alone and with inhibitors are shown in Table 5. When fuzuloparib and fluvoxamine were taken together, the exposure AUC0-t of fuzuloparib was 1.14 times that of single oral administration (95% prediction interval 0.97- 1.32), and Cmax was 1.05 times that of single oral administration (95% prediction interval 1.00-1.10). Considering that the corresponding 95% prediction interval was within 80%-125% of the Geometric mean value, it is believed that fluvoxamine 50 mg has no significant effect on fuzuloparib exposure. Because the regular dose of fluvoxamine can be increased to 100-300 mg/day, higher doses were also simulated to predict the effect of high doses on fuzuloparib exposure. From Table 5, we can see that when the dose increased from 50 to 300 mg/day, the ratio of AUC0-t increased from 1.14 to 1.50 (1.01-2.36). This new 95% prediction interval was outside the 80–125% range of the Geometric mean value, indicating that fluvoxamine (300 mg) could significantly affect fuzuloparib exposure.
| Fluvoxamine dose (mg) | Prediction | ||
|---|---|---|---|
| AUC0-tR | CmaxR | ||
| 50 | Geometric mean | 1.14 | 1.05 |
| 95% Lower limit | 0.97 | 1 | |
| 95% Upper limit | 1.32 | 1.1 | |
| 100 | Geometric mean | 1.27 | 1.1 |
| 95% Lower limit | 1.06 | 1.04 | |
| 95% Upper limit | 1.89 | 1.15 | |
| 300 | Geometric mean | 1.5 | 1.15 |
| 95% Lower limit | 1.01 | 1.06 | |
| 95% Upper limit | 2.36 | 1.24 | |
Table 5: The ratio of fuzuloparib plasma exposure when co-administered with inhibitor fluvoxamine.

Figure 5: (a) Predictions (lines, n=50) of the plasma concentration of fuzuloparib 20 mg taken with 50 mg fluvoxamine after a meal; (b) predictions (lines, n=50) of the plasma concentration of fuzuloparib 20 mg taken alone after a meal. 
Prediction of fuzuloparib with moderate inducer efavirenz
Physiological and in vivo relevant parameters used to predict the efavirenz effects on fuzuloparib exposure are listed in Table 6. Parameters were adjusted to fit the single drug model best firstly.
| Efavirenz dose (mg) | Prediction | ||
|---|---|---|---|
| AUC0-tR | CmaxR | ||
| 50 | Geometric mean | 0.71 | 0.92 |
| 95% Lower limit | 0.47 | 0.81 | |
| 95% Upper limit | 0.95 | 1.02 | |
Table 6: The ratio of fuzuloparib plasma exposure when co-administered with inducer efavirenz.
The plasma concentrations of fuzuloparib 50 mg alone and with efavirenz 600 mg are shown in Figure 6a and 6b. The ratios of related PK parameters AUC0-t and Cmax of fuzuloparib alone and inducers are shown in Table 6. When fuzuloparib and efavirenz were taken together, the exposure AUC0-t of fuzuloparib was 0.71 times that of single oral administration (95% prediction interval 0.47-0.95), and Cmax was 0.92 times that of single oral administration (95% prediction interval 0.81- 1.02) (Table 6). Considering that the corresponding 95% prediction interval exceeded the lower limit of the 80%-125% range, it is suggested that efavirenz (600 mg) has a significant effect on fuzuloparib exposure.

Figure 6: (a) Predictions (lines, n=50) of the plasma concentration of fuzuloparib 50 mg taken with 600 mg efavirenz after a meal; (b) predictions (lines, n=50) of the plasma concentration of fuzuloparib taken alone after a meal. 
Discussion
Plasma concentrations of fuzuloparib taken on an empty stomach were used to establish the fuzuloparib PBPK model, and the key parameters were determined. The results were verified with fluconazole and rifampicin. The verification results showed that the inhibitor/ inducer affected the fuzuloparib exposure AUC0-t. The predicted value was within two times the observed value, which proved that the model reasonably predicted the effects of inhibitors/inducers on fuzuloparib exposure AUC0-t.
The simulation results slightly underestimated the effects of rifampicin on drug exposure, with a 5% difference between observed value and predictions. The error is within a reasonable range compared with other simulation studies of rifampicin [16]. Studies showed that rifampicin could induce CYP3A in the liver and gastrointestinal tract [26]. For drugs with a significant first-pass effect in the gastrointestinal tract, such as triazolam and midazolam, the influence of these factors may be increased [27]. In the current model, gastrointestinal metabolism was not considered (Fg=1), which may be one reason for underestimating the induction effect of rifampicin. However, considering the fact that when a drug has a relatively high bioavailability, the contribution of gastrointestinal metabolism to the overall clearance rate is small [27], the model is reasonable and can be used for further prediction.
Being frequently used in the chemotherapy of tuberculosis, rifampicin is an effective antibiotic against Gram-positive bacteria, including mycobacteria [10,28,29]. Rifampicin’s induction effect was recorded 25 years ago. The average elimination half-life of hexobarbital was decreased from 624 to 262 min and that of tolbutamide from 292 to 160 min following rifampicin treatment in patients with cirrhosis or cholestasis [30]. Rifampicin at 600 mg/day caused about a 3-fold increase in pranolol’s clearance [31]. During concurrent treatment with prednisolone, rifampicin increased the plasma clearance of prednisolone by 45% and reduced AUC by 66% [32,33]. Long term therapy with rifampicin is associated with minor, transient elevations in serum aminotransferase levels in 10% to 20% of patients [34]. In the current study, when fuzuloparib (50 mg) and rifampicin (600 mg) were taken together, the model predicted that AUC0-t was reduced by 85% compared with single oral administration of fuzuloparib (50 mg). Fuzuloparib is not recommended to be taken together with strong inducer rifampicin.
Fluconazole is recommended in regulatory guidelines as a moderate CYP3A inhibitor [35]. When co-administered with midazolam, the AUC0-t of midazolam was increased 3.6-fold with fluconazole dose acute (400 mg) and steady-state (200 mg once daily) [36]. A 3.9-fold increase in oral midazolam AUC0-t was observed when midazolam was administered 2 hours following a single 200 mg dose of fluconazole [37]. Coadministration of midazolam with a single 400 mg dose of fluconazole resulted in mean midazolam AUC0-t about 3.7-fold higher than that following midazolam administration alone [37,38]. Use of oral midazolam with fluconazole should be avoided. In the study reported by Malhotra 201 [39], concomitant administration of fesoterodine with fluconazole increased AUC0-t of 5-HMT (the active moiety of fesoterodine) by approximately 27% (~1.27 times). Fesoterodine 8 mg single dose was well tolerated when administered alone or with fluconazole [39]. In the current study, when fuzuloparib (20 mg) and fluconazole (400 mg) were taken together, the model predicted that the AUC0-t was 2.49 times that of single-drug oral administration. Fuzuloparib is not recommended to be taken together with moderate inhibitor fluconazole.
Efavirenz is an inducer of CYP3A4 and CYP2B6 in vivo [40-42]. When co-administered with substrate maraviroc (100 mg twice daily), the AUC0-t of maraviroc with and without efavirenz gave a geometric mean ratio of 0.49 (0.4-0.57) for the observed clinical data [42]. A dose adjustment was required to compensate for this reduction. Efavirenz is also associated with a low rate of serum enzyme elevations during therapy and although it is uncommon, it is the well-established cause of clinically acute liver injury [43]. In the current study, when fuzuloparib (20 mg) and efavirenz (50 mg) were taken together, the exposure AUC0-t of fuzuloparib was 0.71 (0.47–0.95) times that of single oral administration. It is suggested that efavirenz significantly affects fuzuloparib exposure and may need to be avoided to be used together.
Fluvoxamine inhibits oxidative drug metabolising enzymes such as CYP1A2 and CYP3A4 [44]. It inhibits drug reactions metabolised by CYP1A2 such as caffeine, theophylline, imipramine, tacrine and clozapine [45]. It has been reported that increased CYP1A2 activity may be associated with increased risk of breast cancer [46], so fluvoxamine may be an option in the treatment of breast cancer with fuzuloparib due to its inhibitory effect. As a mild inhibitor, when the dose of fluvoxamine increased from 50 mg to 100 and 300 mg, the inhibition effect of coadministration on fuzuloparib (AUCR) changed from 1.14 to 1.59. Coadministration should be used with caution.
Conclusion
All of the predicted results were within two times the observed values. The established PBPK model can reasonably simulate the effects of inducer or inhibitor on fuzuloparib. It is suggested that strong inducer efavirenz significantly affects fuzuloparib exposure and should be avoided when used together with fuzuloparib. Inhibitor fluvoxamine (50 mg/day) has no significant effect on fuzuloparib exposure. A higher dose of fluvoxamine (100-300 mg/day) increases the risk and should be used cautiously.
Acknowledgements
We would like to thank Jiangsu Hengrui Medicine Co. Ltd for providing financial and technical support for this work.
Author Contributions
Conceptualization, Bo Liu; Data curation, Jingxi Li; Formal analysis, Keheng Wu; Investigation, Sihui Long; Methodology, Keheng Wu; Project administration, Bo Liu; Software, Keheng Wu and Youni Zhao; Validation, Jingxi Li; Writing-original draft, Jingxi Li; Writingreview & editing, Xue Li, Zhou Zhou, Ranran Jia, Pingping Song and Jack Liu.
Declaration of Conflicting Interests
K.W., X.L., Z.Z., R.J., Y. Z., J.L. were employees of Yinghan Pharmaceutical Technology (Shanghai) at the time of study conduct.
Data Availability Statement
The data supporting this study’s findings are available from the corresponding author upon reasonable request.
References
- Zhang L, Fanlu M, Zhong D. (2022) DNA Damage Repair System and Antineoplastic Agents in Lung Cancer. Zhongguo Fei Ai Za Zhi 25:434-442.
- Wang L, Yang C, Xie C, Jiang J, Gao M, et al. (2019) Pharmacologic characterization of fluzoparib, a novel poly (ADP‐ribose) polymerase inhibitor undergoing clinical trials. Cancer Sci 110:1064-1075.
- Li N, Wu L, Zhang Y, Liu J, Zhou Q, et al. (2019) Efficacy and safety of oral poly (ADP-ribose) polymerase inhibitor fluzoparib in patients with BRCA1/2 mutations and platinum sensitive recurrent ovarian cancer. An Oncol 30:v408.
- Li HLR, Shao B, Ran R, Song G, Wang K, et al. (2020) Phase I dose-escalation and expansion study of PARP inhibitor, fluzoparib (SHR3162), in patients with advanced solid tumors. Chin J Cancer Res 32:370-382.
- Li N, Bu H, Liu J, Zhu J, Zhou Q, et al. (2021) An Open-label, Multicenter, Single-arm, Phase II Study of Fluzoparib in Patients with Germline BRCA1/2 Mutation and Platinum-sensitive Recurrent Ovarian CancerFluzoparib for BRCA1/2-mutated Recurrent Ovarian Cancer. Clin Cancer Res 27:2452-2458.
- Zhang Q, Kai J, Zhai Y, Xu N, Shentu J, et al. (2022) The impact of rifampicin on the pharmacokinetics of fuzuloparib in healthy Chinese male volunteers. Br J Clin Pharmacol 88:84-90.
- Wu M, Li X, Sun J, Chen H, Ding Y. (2021) A phase I study of fluzoparib tablet formulation, an oral PARP inhibitor: effect of food on the pharmacokinetics and metabolism after oral dosing in healthy Chinese volunteers. Expert Opin Drug Metab Toxicol 17:503-508.
- Worboys PD, Carlile D J. (2001) Implications and consequences of enzyme induction on preclinical and clinical drug development. Xenobiotica 31:539-556.
- Li X, Wu K, Zhou Z, Jia R, Zhao Y, et al. (2022) Predicting fluconazole drug-drug interactions using a physiologically-based pharmacokinetic (PBPK) model. J Infect Dis Ther 10:1-8.
- Chen J, Raymond K. (2006) Roles of rifampicin in drug-drug interactions: underlying molecular mechanisms involving the nuclear pregnane X receptor. Ann Clin Microbiol 5:3.
- Kato M, Chiba K, Horikawa M, Sugiyama Y. (2005) The quantitative prediction of in vivo enzyme-induction caused by drug exposure from in vitro information on human hepatocytes . Drug Metab Pharmacokinet 20:236-243.
- Kato M, Shitara Y, Sato H, Yoshisue K, Hirano M, et al. (2008) The quantitative prediction of CYP-mediated drug interaction by physiologically based pharmacokinetic modeling. Pharm Res 25:1891-1901.
- Poulin P, Theil FP. (2002) Prediction of pharmacokinetics prior to in vivo studies. 1. Mechanism-based prediction of volume of distribution. J Pharm Sci 91:129-56.
- Rodgers T, Rowland M. (2006) Physiologically based pharmacokinetic modelling 2: Predicting the tissue distribution of acids, very weak bases, neutrals and zwitterions. J Pharm Sci 95:1238-1257.
- Brown RP, Delp MD, Lindstedt SL, Rhomberg LR, Beliles RP. (1997) Physiological parameter values for physiologically based pharmacokinetic models. Toxicol Ind Health 13:407-484.
[Cross Ref][Google Scholar](All Versions)[PubMed]
- Jones HM, Rowland‐Yeo K. (2013) Basic concepts in physiologically based pharmacokinetic modelling in drug discovery and development. CPT Pharmacometrics Syst Pharmacol. 2:e63.
- Yamashita F, Sasa Y, Yoshida S, Hisaka A, Asai Y, et al. (2013) Modeling of rifampicin-induced CYP3A4 activation dynamics for the prediction of clinical drug-drug interactions from in vitro data. PloS One 8:e70330.
- Almond LM, Mukadam S, Gardner I, Okialda K, Wong S, et al. (2016) Prediction of drug-drug interactions arising from CYP3A induction using a physiologically based dynamic model. Drug Metab Dispos 44:821-832.
- Sakamoto A, Matsumaru T, Yamamura N, Suzuki S, Uchida Y, et al. (2015) Drug transporter protein quantification of immortalized human lung cell lines derived from tracheobronchial epithelial cells (Calu-3 and BEAS2-B), bronchiolar–alveolar cells (NCI-H292 and NCI-H441), and alveolar type II-like cells (A549) by liquid chromatography–tandem mass spectrometry. J Pharm Sci 104:3029-3038.
- Chen X, Yang F, Zhao J, Tang Q, Heng J, et al. (2022) Effect of fluconazole on the pharmacokinetics of fuzuloparib: an open-label, crossover study in Chinese healthy male volunteers. Cancer Chemother Pharmacol 89:141-148.
- Chen Y, Mao J, Hop, CE. (2015) Physiologically based pharmacokinetic modeling to predict drug-drug interactions involving inhibitory metabolite: A case study of amiodarone. Drug Metabo Disposit 43:182-189.
[Cross Ref][Google Scholar](All Versions)
- DrugBank. Building the foundation for better health outcomes. (2022).
- DNA Damage Repair System and Antineoplastic Agents in Lung Cancer
- Ward BA, Gorski JC, Jones DR, Hall SD, Flockhart DA, et al. (2003) The cytochrome P450 2B6 (CYP2B6) is the main catalyst of efavirenz primary and secondary metabolism: Implication for HIV/AIDS therapy and utility of efavirenz as a substrate marker of CYP2B6 catalytic activity. J Pharmacol Exp Ther 306:287-300.
- Siccardi M, Marzolini C, Seden K, Almond L, Kirov A, et al. (2013) Prediction of drug-drug interactions between various antidepressants and efavirenz or boosted protease inhibitors using a physiologically based pharmacokinetic modelling approach. Clin Pharmacokinet 52:583-592.
- Greiner B, Eichelbaum M, Fritz P, Kreichgauer HP, Von Richter O, et al. (1999) The role of intestinal P-glycoprotein in the interaction of digoxin and rifampin. J Clin Invest 104:147-153.
- Kato M, Chiba K, Hisaka A, Ishigami M, Kayama M, et al. (2003) The intestinal first-pass metabolism of substrates of CYP3A4 and P-glycoprotein-quantitative analysis based on information from the literature. Drug metab Pharmacokinet 18:365-372.
- Davies PD, Yew WW. (2003) Recent developments in the treatment of tuberculosis. Expert Opinion Invest Drugs 12:1297-1312.
- Mitchison DA. (2005) The diagnosis and therapy of tuberculosis during the past 100 years. Am J Respir Crit Care Med 171:699-706.
- Zilly W, Breimer DD, Richter E. (1977) Stimulation of drug metabolism by rifampicin in patients with cirrhosis or cholestasis measured by increased hexobarbital and tolbutamide clearance. Eur J Clin Pharmacol 11:287-293.
- Herman RJ, Nakamura K, Wilkinson GR, Wood AJ. (1983) Induction of propranolol metabolism by rifampicin. Br J Clin Pharmacol 16:565-569.
- Finch CK, Chrisman CR, Baciewicz AM, Self TH. (2002) Rifampin and rifabutin drug interactions: An update. Arch Intern Med 162:985-992.
- McAllister WA, Thompson PJ, Al-Habet SM, Rogers HJ. (1983) Rifampicin reduces effectiveness and bioavailability of prednisolone. Br Med J (Clin Res Ed) 286:923-925.
- National Institutes of Health. (2017) LiverTox: clinical and research information on drug-induced liver injury.
[PubMed]
- Huang SM, Temple R, Throckmorton DC, Lesko LJ. (2007) Drug interaction studies: Study design, data analysis, and implications for dosing and labeling. Clin Pharmacol Ther 81:298-304.
- Olkkola KT, Ahonen J, Neuvonen PJ. (1996) The effect of the systemic antimycotics, itraconazole and fluconazole, on the pharmacokinetics and pharmacodynamics of intravenous and oral midazolam. Anesth Analg 82:511-516.
- Kharasch ED, Walker A, Hoffer C, Sheffels P. (2005) Sensitivity of intravenous and oral alfentanil and pupillary miosis as minimally invasive and noninvasive probes for hepatic and first‐pass CYP3A activity. J Clin Pharmacol 45:1187-1197.
- Ahonen J, Olkkola KT, Neuvonen PJ. (1997) Effect of route of administration of fluconazole on the interaction between fluconazole and midazolam. Eur J Clin Pharmacol 51:415-419.
- Malhotra B, Dickins M, Alvey C, Jumadilova Z, Li X, et al. (2011) Effects of the moderate CYP3A4 inhibitor, fluconazole, on the pharmacokinetics of fesoterodine in healthy subjects. Br J Clin Pharmacol 72:263-269.
- Robertson SM, Maldarelli F, Natarajan V, Formentini E, Alfaro RM, et al. (2008) Efavirenz induces CYP2B6-mediated hydroxylation of bupropion in healthy subjects. J Acquir Immune Defic Syndr 49:513.
- Mouly S, Lown KS, Kornhauser D, Joseph JL, Fiske WD, et al. (2002) Hepatic but not intestinal CYP3A4 displays dose‐dependent induction by efavirenz in humans. Clin Pharmacol Ther 72:1-9.
- Abel S, Jenkins TM, Whitlock LA, Ridgway CE, Muirhead GJ. (2008) Effects of CYP3A4 inducers with and without CYP3A4 inhibitors on the pharmacokinetics of maraviroc in healthy volunteers. Br J Clin Pharmacol 65:38-46.
- (2012) LiverTox: Clinical and Research Information on Drug-Induced Liver Injury [Internet].
[PubMed]
- van Harten J. (1995) Overview of the pharmacokinetics of fluvoxamine. Clin Pharmacokinet 29:1-9.
- Rasmussen BB, Nielsen TL, Brøsen K. (1998) Fluvoxamine is a potent inhibitor of the metabolism of caffeine in vitro. Pharmacol Toxicol 83:240-245.
- Hong CC, Tang BK, Hammond GL, Tritchler D. (2004) Cytochrome P450 1A2 (CYP1A2) activity and risk factors for breast cancer: A cross-sectional study. Breast Cancer Res 6:1-14.
Citation: Li J, Wu K, Li X, Long S, Zhou Z, et al. (2022) Quantifying Induction/ Inhibition Effects on Fuzuloparib Using a Physiologically Based Pharmaco-Kinetic (PBPK) model. J Clin Exp Pathol 12: 415. DOI: 10.4172/2161-0681-22.12.415
Copyright: © 2022 Li J, et al. This is an open-access article distributed under the terms of the Creative Commons Attribution License, which permits unrestricted use, distribution, and reproduction in any medium, provided the original author and source are credited.
Share This Article
Recommended Journals
Open Access Journals
Article Tools
Article Usage
- Total views: 2533
- [From(publication date): 0-2022 - Apr 02, 2025]
- Breakdown by view type
- HTML page views: 2122
- PDF downloads: 411