Quantification of Pharmacologically Active Marker Gallic Acid and Ellagic Acid from Leaf and Stem of Pergularia daemia Forsk. by HPTLC Method
Received: 19-Oct-2015 / Accepted Date: 09-Dec-2015 / Published Date: 09-Dec-2015 DOI: 10.4172/2155-9872.1000291
Abstract
TLC densitometry method for quantification of gallic acid and ellagic acid using HPTLC is developed. This is the first report of quantification of these two biologically active compounds as gallic acid and ellagic acid using HPTLC from this plant. Quantification of gallic acid and ellagic acid was carried out from the methanol extract by using solvent system of Toluene: Ethyl acetate: Formic acid (6:4:0.8 v/v/v). The Rf value of Gallic acid and ellagic acid are 0.43 and 0.38 respectively. The linearity ranges of gallic acid (100 to 600 ng) and ellagic acid (100 to 600 ng) with correlation coefficient (r- values) of 0.9994 and 0.9997 respectively. The amount of gallic acid and ellagic acid was 3.01 and 11.09 μg/ml in leaf and 4.97 and 18.30 μg/ml in stem respectively. Quantification of gallic acid and ellagic acid showed good separation and resolution from other constituent of extract. Its main advantages are its simplicity, accuracy and selectivity. This method can also be used for estimation of these compounds in other herbal preparation and may be useful for standardization purposes.
Keywords: Pergularia daemia Forsk.; HPTLC; Gallic acid; Ellagic acid
301934Introduction
Herbs contain various pharmacologically active phytochemical constituents which exerts their therapeutic effect on human being [1]. Among the various Phytochemical constituent’s triterpenoids and
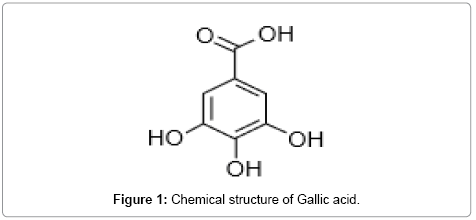
flavonoids are widely distributed in plants. Flavonoid is phenol compounds, which occurs in a free states as well as in glycosides. These are the largest group of naturally occurring phenols. They are form from three acetate units and phenyl propane units [2]. Gallic acid is phenyl propenoid (Figure 1), chemically 3,4,5-Trihydroxy benzoic acid and possess astringent activity.
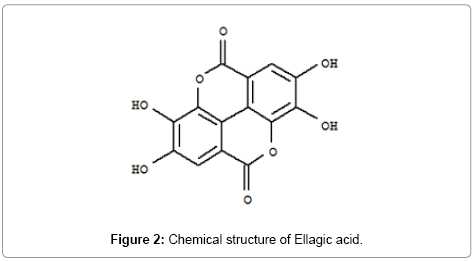
Ellagic acid is a natural phenol antioxidant found in numerous fruits and vegetables. The anti-proliferative and antioxidant properties of ellagic acid have prompted research into its potential health benefits. It has been fraudulently marketed as having the ability to prevent and treat a number of human maladies, including cancer, but such claims have not been proven [3,4]. The roots of Pergularia daemia exhibited antioxidant activity which may be attributed to the presence of polyphenol and other phytochemical compound [5]. The plant is pungent, cooling, anthelmintic, laxative, antipyretic, cures biliousness, “kapha”, asthma, “tridosha”, ulcers, useful in eye troubles, urinary discharges, leucoderma, strangury, uterine complaints, inflammations, facilitates parturition. In Western India the plant has general reputation as expectorant and emetics [6], plant extract given for uterine and menstrual troubles [7], emmenagogue, metropathy, vitiated condition of vata, amenorrhea, dysmenorrheal [8,9]. Aerial part of this plant reported for various activity like hepatoprotective, anti-fertility, anti-diabetic, analgesic, stem part is used as remedy for cold and fever [10,11] (Figure 2).
Phytochemical evaluation is one of the important tools for the assessment of quality which includes preliminary phytochemical screening, chemical profile and marker compound analysis using modern analytical technique. HPTLC is suitable method for estimation of chemical constituent present in plant material. Pergularia daemia Forsk contain gallic acid and ellagic acids are important active constituents which are estimated by HPTLC.
Materials and Methods
Reagent and material
The leaf and stem of Pergularia daemia were collected from the area near to railway station Yeola, Dist Nashik. Leaf and stem were shade dried and powdered to coarse particle size. Standard gallic acid and ellagic acid were purchase from Eucca Enterprises; Mumbai. Alumium plates are precoated with silica gel (GF254) of 0.2 mm thickness (E. Merck, Darmstadt, Germany) was used without pretreatment. All chemicals and solvents used were of analytical grade and HPLC grade (E. Merck Mumbai, India).
Preparation of extract
The powder of Pergularia daemia Forsk. stem was extracted by using continuous hot extraction method. The stem powder of Pergularia daemia Forsk. was charged in to thimble of Soxlet apparatus and extracted by using petroleum ether as a solvent by maintaining a temp [30-40°C] extraction was continue till a color-less solvent appears from siphon tube. Then the extract was concentrated and the percentage yield was calculated. The marc was air dried and subjected to further extraction by continuous hot extraction using methanol as a solvent. Temperature was maintained at [40-60°C], extraction was continue till a color less solvent will appear from siphon tube. The extract was then concentrated and percentage yield was calculated. These extracts were stored in a refrigerator below 10°C by naming petroleum ether extract and methanol extract.
Preparation of standard solution and stock solution
Standard stock solution of gallic acid: A stock solution of gallic acid was prepared by dissolving 10 mg of gallic acid in methanol and making up the volume up to 10 ml with methanol. From this solution 1 ml was pipette out and diluted to 10 ml by using methanol to get the final concentration of 100 μg/ml.
Standard stock solution of ellagic acid: A stock solution of ellagic acid was prepared by dissolving 10 mg of accurately weigh ellagic acid in methanol and making up the volume to 10 ml with methanol. Then from this solution 1 ml was pipette out and diluted to 10 ml by using methanol to get the final concentration of 100 μg/ml.
Preparation of sample solution for gallic acid and ellagic acid
Sample solution of leaf and stem extract were prepared by dissolving 10 mg of methanol extract in methanol and making up the volume to 10 ml to get the concentration of 1000 μg/ml. the solution was filtered through whatman filter paper no. 41 and used for further chromatographic analysis.
Development of HPTLC Technique
Chromatographic conditions
Inert gas was used as a spray gas whereas methanol was used as a solvent at dosage speed of 150 nl/s. A syringe with a capacity of 100 μl, a pre-dosage volume of 0.2 μl was applied on TLC plate. The numbers of tracks are 06; application position at Y axis 8.0 mm having band length 8.0 mm, solvent front position was of about 80.0 mm.
Instrument
Position of first track X 18.5 mm, Distance between tracks 15.4 mm, Scan start pos. Y 5.0 mm, Scan end pos. Y 85.0 mm, Slit dimensions 6.00 × 0.45 mm, Micro Optimize optical system Light Scanning speed: 20 mm/s Data resolution: 100 μm/step. The methanol extract was applied in the form of bands of width 8.0 mm with a camag microlitre syringe on pre coated silica gel aluminium plate GF254 (20 cm × 10 cm with 0.2 mm thickness; E. Merck, Darmstadt, Germany, supplied by Anchrom Technologists, Mumbai) using a camag Linomat V (Switzerland). The methanol extract sample Volume applied was 250 μl for recording on each plate. A constant application rate of 1.0 μl/s was employed and space between two bands was 5 mm. The slit dimension was kept at 6.0 mm × 0.45 mm and 10 mm/s scanning speed was employed. The slit bandwidth was set at 20 nm, each track was scanned thrice and baseline correction was used. The mobile phase for gallic acid consisted of Toluene: Ethyl acetate: Formic acid in the volume ratio of (6:4:0.8 v/v) for estimation of gallic acid and ellagic acid Linear ascending development was carried out in 20 cm × 10 cm twin trough glass chamber (Camag, Muttenz, Switzerland) saturated with filter paper Whatman No 1 in the mobile phase. The optimized chamber saturation time for mobile phase was 20 min at room temperature (25°C ± 2) at relative humidity of (60% ± 5). The length of chromatogram run was 8.0 cm. Subsequent to the scanning, TLC plates were dried in a current of air with the help of an air dryer. Densitometry scanning was performed with Camag TLC scanner IV in the reflectance absorbance mode at 254 and 280 nm and operated by Win CATS software (1.4.6 Camag) with the help of tungsten lamp. Subsequent to the development; TLC plate was dried in oven at 110°C. Concentrations of the compound chromatographed were determined from the intensity of diffusely reflected light. Evaluation was carried out by comparing peak areas of linear regression with the samples, were spotted in the forms of bands with Camag microlitre syringe on a precoated silica gel GF254 plates using camag linomat V. automatic sample spotter of band width 8 mm. the plates were developed in a solvent system in CAMAG glass twin trough chamber previously saturated with the solvent for 30 min. The distance was 8 cm subsequent to the scanning. TLC plates were air dried and scanning was performed on CAMAG TLC scanner in absorbance at 254 nm and 280 nm operated by Wincats software 4.03 version.
Specificity
The specificity of method was ascertained by analyzing standards, blank and sample extract by simultaneously applying on the same TLC plate. The spot of gallic acid and ellagic acid in the sample extract were confirmed by comparing the Rf value and spectra of the spots with those of respective standards. The peak purity was accessed. The peak purity was assessed by comparing the spectra at three different levels that is peak start, peak apex and peak end.
Calibration curve
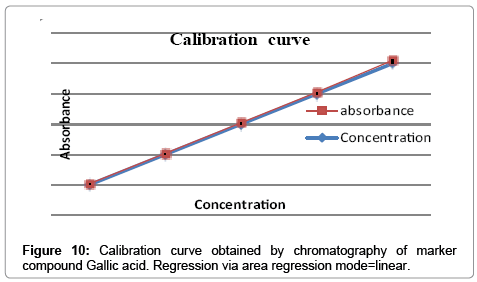
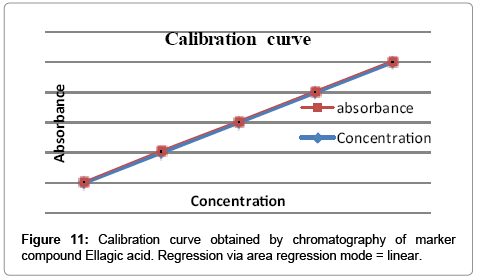
Calibration curve for gallic acid (100 μg/ml) and ellagic acid (100 μg/ml) in different volume were located on the different TLC plate for the preparation of calibration curve (1-6 μl of gallic acid and ellagic acid) checked for reproducibility. The calibration curve was prepared by plotting concentration of standards vs. average peak area after scanning at 254 nm and 280 nm.
Quantification of gallic acid and ellagic acid
Estimation of gallic acid and ellagic acid from methanolic extract of leaf and stem of Pergularia daemia Forsk.
Stationary phase: Silica gel GF254 plates.
Mobile phase: Toluene: Ethyl acetate: Formic acid (6:4:0.8).
Standards: Gallic acid (100 μg/ml), ellagic acid (100 μg/ml).
Sample: Methanol extract of Pergularia daemia Fork leaf (1000 μg/ ml) and stem (1000 μg/ml).
Migration distance: 8 cm.
Scanning wavelength: 254 nm and 280 nm.
Mode of scanning: Absorption (deuterium).
Results and Discussion
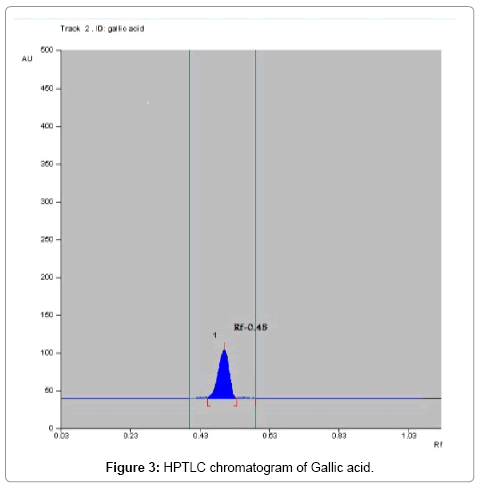
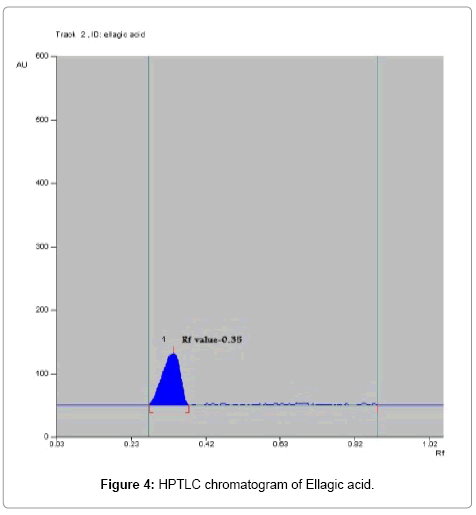
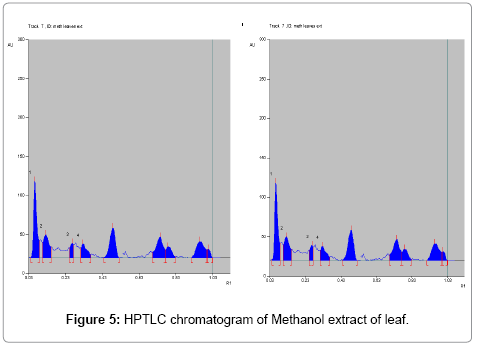
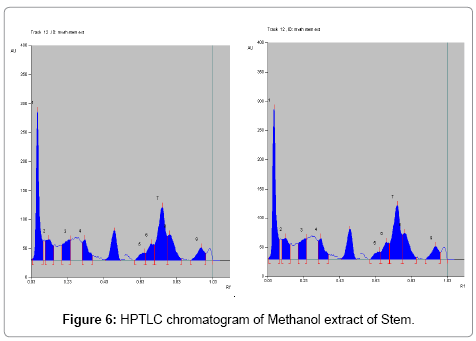
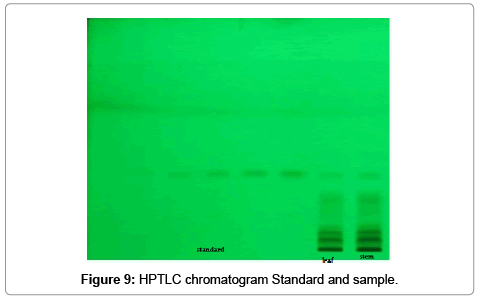
Toluene: Ethyl acetate: Formic acid (6:4:0.8) was selected which gives best resolution of gallic acid and ellagic acid (Rf=0.43 and 0.38). The identity of band of gallic acid and ellagic acid in the plant extract was confirmed by overlay in UV absorption spectra with those of standard gallic acid and ellagic acid using CAMAG TLC scanner. The purity of bands of gallic acid and ellagic acid in the plant extract was confirmed by overlaying the absorption spectra at the start, middle and end position of band (Table 1; Figures 3-6).
| Method validation data for HPTLC quantification of Gallic acid and Ellagic acid in methanol extract of leaf stem of PergulariadaemiaForsk. | |
| Method property | Value |
| Linearity for Gallic acid (ng/spot) | 100-600 |
| Linearity for Ellagic acid (ng/spot) | 100-600 |
| Correlation coefficient for Gallic acid (r) | 0.9994 |
| Correlation coefficient for Ellagic acid (r) | 0.9997 |
| Intraday precision (RSD % n=6) on different days for Gallic acid | 1.08 |
| Intraday precision (RSD % n=6) on different days for Ellagic acid | 1.04 |
| Interlay precision (RSD % n=6) on same day Gallic acid | 1.13 |
| Interlay precision (RSD % n=6) on same day Ellagic acid | 1.09 |
| Limit of quantitation of Gallic acid (ng/μl) | 0.0667 |
| Limit of quantitation of Ellagic acid (ng/μl) | 0.0789 |
| Limit of detection of Gallic acid (ng/μl) | 0.045 |
| Limit of detection of Ellagic acid (ng/μl) | 0.072 |
| Specificity | Specific |
Table 1: Summary of Validation parameter.
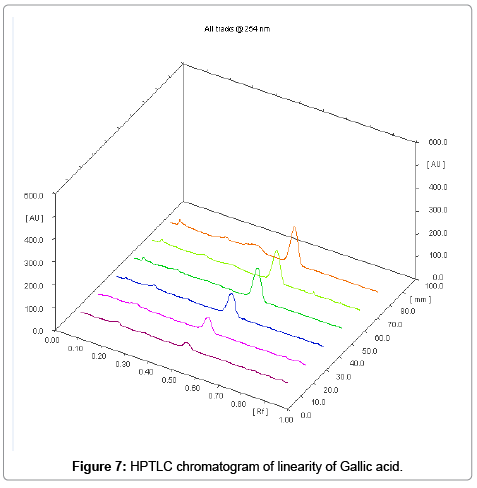
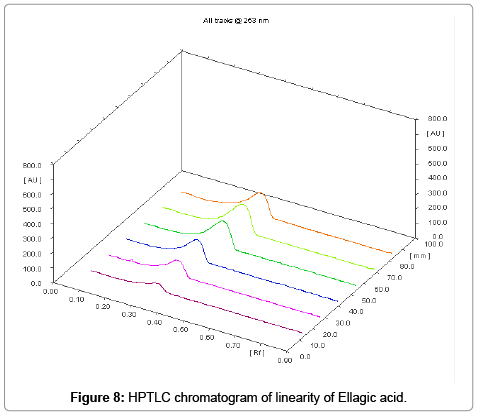
The linearity ranges of gallic acid and ellagic acid (100 to 600 ng/ spot) with correlation coefficient (r value) 0.9994 and 0.9997 respectively (Figures 7-11). The amount of gallic acid and ellagic acid was 3.01 and 11.09 μg/ml in leaf and 4.97 and 18.30 μg/ml in stem respectively.
Conclusion
The HPTLC method has been developed with some modification and it can be used for quantitative determination of gallic acid and ellagic acid in Methanol extract of leaf and stem of Pergularia daemia Forsk. The main advantage of this method is simplicity, accuracy and selectivity. This method can also be used for estimation of these compounds in other several herbal preparations and may be used for standardization purpose.
Acknowledgements
Thankful to our management for providing facilities, thanks to Mr. Musmade DS, Mr. Ware AL and Mrs. Patil PP for helping in evaluation HPTLC data and also thankful to Prof Arote SR.
References
- Dhawal K, Shinde VM, Mahadik KR, Namdeo AG (2007) Rapid densitometric method for simultenious analysis of Umbelliferon, PsoralenandEugenol in herbal raw material using HPTLC.J Sep Sci 30:2053-2058.
- Harbone AJ (2007) Phytochemical methods A Guide to modern techniques of Plant analysis.3rd edn. Springer Private Ltd., Delhi, India.
- (2015) US Food and Drug Administration. 187 Fake Cancer 'Cures' Consumers Should Avoid.
- Jalalpure SS, Habbu PV, Patil MB (2002) Analgesic and antipyretic activity of Pergularia extensain rats. Indian Journal of Pharmaceutical Sciences 64: 493-495.
- Kirtikar KR, Basu BD (2005) Indian Medicinal Plant.2ndedn. Oriental Enterprises, Uttaranchal, India.
- Siddhu AS (2000) The Useful Plant of India Publication and information direct. CSRI, New Delhi, India. p: 440.
- Vaidyaratnam PS (2010) Indian Medicinal Plant-Compendium 500 species. Arya Vaidyashala, Kottakal, India. p:236.
- Chopra RN, Nayar SL, Chopra IG (1956) Glossary of Indian Medicinal Plant. CSIR, New Delhi,India. p:188.
- Bhaskar VH, Balkrishnan N (2009) Veliparuthi (Pergularia daemia (Forsk) Chiov.) - As a phytomedicine: A review. International Journal of PharmTech Research1:1305-1313.
- Leela V, Saraswathy A (2013) Quantification of Pharmacologically active markers Gallic acid, Quarcetin and Lupeol from Acacia leucophloea Wild Flowers by HPTLC method. Analytical and Bioanalytical Technique 4:160.
Citation: Sutar NG, Pal SC (2015) Quantification of Pharmacologically Active Marker Gallic Acid and Ellagic Acid from Leaf and Stem of Pergularia daemia Forsk. by HPTLC Method. J Anal Bioanal Tech 7:291. DOI: 10.4172/2155-9872.1000291
Copyright: © 2015 Sutar NG, et al. This is an open-access article distributed under the terms of the Creative Commons Attribution License, which permits unrestricted use, distribution, and reproduction in any medium, provided the original author and source are credited.
Share This Article
Open Access Journals
Article Tools
Article Usage
- Total views: 12341
- [From(publication date): 2-2016 - Apr 04, 2025]
- Breakdown by view type
- HTML page views: 11168
- PDF downloads: 1173

