Research Article Open Access
Public Health Co-Benefits of the Diffusion of Innovative Greenhouse Gas Mitigation Technologies in Abu Dhabi
William Dougherty1*, David Yates2 and Paul Kucera21Climate Change Research Group, Walpole, MA, USA
2National Center for Atmospheric Research, Boulder, Colorado, USA
- *Corresponding Author:
- William Dougherty
Climate Change Research Group
Walpole, MA, USA
Tel: +5086680980
E-mail: billd@ccr-group.org
Received date: October 11, 2017; Accepted date: October 13, 2017; Published date: October 20, 2017
Citation: Dougherty W, Yates D, Kucera P (2017) Public Health Co-Benefits of the Diffusion of Innovative Greenhouse Gas Mitigation Technologies in Abu Dhabi. Innov Ener Res S1:002. doi: 10.4172/2576-1463.S1-002
Copyright: © 2017 Dougherty W, et al. This is an open-access article distributed under the terms of the Creative Commons Attribution License, which permits unrestricted use, distribution, and reproduction in any medium, provided the original author and source are credited.
Visit for more related articles at Innovative Energy & Research
Abstract
The emirate of Abu Dhabi has been active in the implementation of innovative technologies to reduce its carbon footprint from energy consuming activities in the power supply and transport sectors. While the reduction in GreenHouse Gas (GHG) emissions from these technologies has been quantified, to date, there has not been a comprehensive assessment of the positive impacts that such measures could have on public health. These are considered a “co-benefit” of GHG mitigation, namely the simultaneous improvement in air quality and public health associated with the dissemination of technologies that reduce GHG emissions. Public health co-benefits include reductions in the incidence of, for example, respiratory illnesses, cardiovascular disease, and allergies. A scenario-based, integrated damage model was developed to integrate local meteorology and air quality conditions, innovative technology performance characteristics in power supply and transport, demographic features/trends, and epidemiological dose-response functions. The results of the study indicate that future efforts in the Abu Dhabi Emirate to expand and intensify GHG-reducing activities using innovative technologies - particularly in the energy and transport sectors where the majority of potential GHG reductions exist - will lead to substantial public health co-benefits.
Keywords
Health co-benefits; Greenhouse gas emissions; Air quality
Introduction
GreenHouse Gas (GHG) emissions are associated with modernday human activities that involve the burning of fossil fuels, industrial processes, waste management, agricultural production, and land use change. There are strong linkages between GHGs that contribute to global climate change and air pollution that contributes to adverse local public health impacts [1-4]. Air pollution is a byproduct of GHG emissions and is highly influenced by climatic factors.
"Co-benefits” are collateral benefits associated with greenhouse gas mitigation policies additional to the direct emission reduction benefits from such policies [5]. Supply and demand side energy efficiency and renewable energy technologies imply a diverse range of co-benefits, including improved regional air-quality, energy-supply security (by increased energy diversity), technological innovation, reduced fuel costs, job creation and market transformation. This is particularly true regarding the urban public health co-benefits associated with GHG mitigation. There can be sharp reductions in morbidity and premature mortality risks associated with the introduction of innovative technologies in cities, particularly with the supply and demand for energy in the power, transport, and built environment sectors [6,7].
Much of the discussion of co-benefits from GHG mitigation has focused on the energy sector. Specifically, there are strong links between air quality and technological alternatives to the current way energy is produced, transmitted and consumed (e.g., energy efficiency, energy conservation, renewable energy). Notably, while reducing energyrelated GHG emissions yields a global impact, air quality and public health co-benefits are experienced at the local and regional level. For most countries, GHG emissions from the energy represent the largest share of their annual GHG emissions.
The public health co-benefits of GHG mitigation were quantified relative to the GHG mitigation actions underway in the emirate of Abu Dhabi in the United Arab Emirates. The draft Abu Dhabi Climate Change Strategy report [8] advances specific measures in energy efficiency, and renewable energy that, if implemented, will lead to sharp reductions in both greenhouse gas emissions and to air pollutants that harm human health. The magnitude of public health co-benefits within the Abu Dhabi Metropolitan Area (ADMA) from reduced outdoor air pollution - specifically avoided premature death and avoided hospital visits - have been quantified for seventeen (17) policies within the Climate Change Strategy. The quantification of public health co-benefits built upon the results of an Environmental Burden of Disease Assessment for Abu Dhabi that examined the links between concentrations of ozone (O3) and Particulate Matter (PM), and rates of mortality and hospital admissions related to respiratory and cardiovascular diseases [9].
Approach
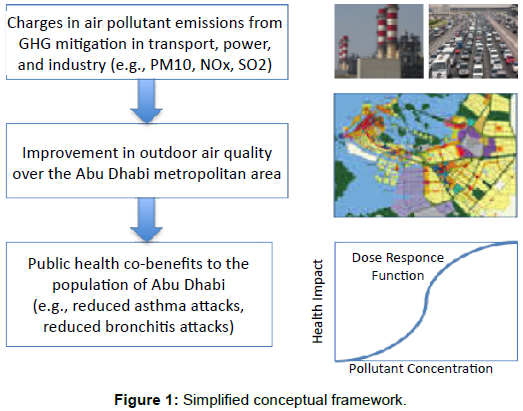
A “bottom-up” approach was used to estimate public health cobenefits of GHG mitigation activities in Abu Dhabi. The key elements of this approach are illustrated in Figure 1. It first involved characterizing the air pollutant emissions with and without the implementation of GHG mitigation policies. Changes in air quality within ADMA were then calculated as the difference in ambient air pollutant concentrations with and without the GHG mitigation policies. Finally, these changes were translated into public health co-benefits through the application of a series of dose-response functions that were developed in the Abu Dhabi Environmental Burden of Disease Assessment. Public health implications of GHG mitigation activities were quantified at both the metropolitan and individual precinct level.
The core research question was: are there significant public health co-benefits in the greater Abu Dhabi City metropolitan area associated with the Emirate's Climate Change Strategy? That is, can a reliable estimate be made regarding the number of avoided premature deaths and the number of avoided excess health-care facility visits due to the implementation of the Abu Dhabi Climate Change strategy, in part or in whole? Addressing these questions involved access to local data and focused on several interlinked issues such as regional climate change modeling, air pollutant emission inventory development, air quality modeling, demographics, and epidemiological research. It also involved a quantification of the public health response with and without GHG mitigation initiatives, as well as understanding the public health response under changing climatic conditions. The study focused on the technology penetration and climatic conditions of year 2035 and compared to conditions observed in the base year of 2007.
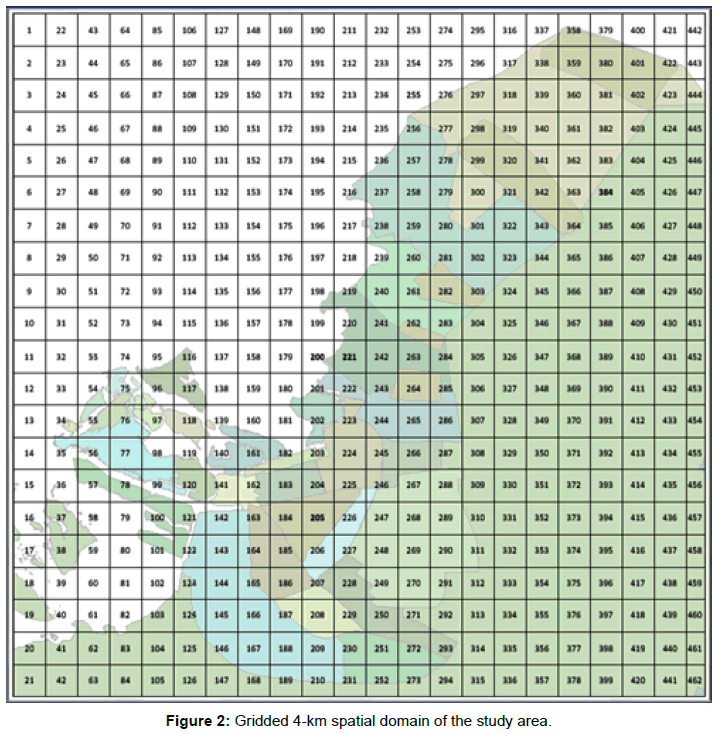
The greater Abu Dhabi Metropolitan Area was the spatial focus of the assessment. This is a region of approximately 3,800 square kilometers, and is shown in Figure 2. The area includes current high population density areas of about 1,030 people/km2 within Abu Dhabi Island. It also includes surrounding areas where urban expansion plans call for significant future residential and industrial zones to the south and east. These are the very areas that are expected to bear the brunt of increased air pollution under a Business-as-usual scenario and which would benefit the most from the implementation of Abu Dhabi’s Climate Change Strategy. A total of 462 grid cells make up the metropolitan plus offshore area, each sized 4 km by 4 km to coincide with the grid spacing used in regional climate change modeling.
Certain elements of the Abu Dhabi Climate Change Strategy were used as the policy framework for which public health co-benefits were estimated. These elements are focused on several key GHG-emitting sectors, namely power supply, transport, and industry. Specifically, 17 specific strategies were chosen for public health co-benefit analysis, as indicated in Table 1. Six pollutants were modeled: Particulate matter (PM10 and PM2.5), Volatile organic compounds (VOC), Nitrogen oxides (NOx), Ground-level Ozone (O3), Carbon monoxide (CO), and Sulfur dioxide (SO2).
| Priority | Sector | Policy | Technologies | |
|---|---|---|---|---|
| No | Description | |||
| Clean Energy and Climate Action | Power and water supply | Nuclear power | 1 | Nuclear power generation |
| Promote renewable energy electricity generation | 2 | Renewable energy power plants | ||
| 3 | One renewable energy water desalination pilot project | |||
| 4 | Renewable energy water desalination plants | |||
| 5 | Waste-to-energy power plants | |||
| 6 | Feed in tariff to sell power to the grid | |||
| 7 | Solar roofs | |||
| Increase power plant efficiency | 8 | Supply side energy efficiency strategy for electricity and water production | ||
| Green Life Styles and Sustainable Use of Resources | Power and water demand | Energy efficiency | 9 | Demand side management strategies for electricity and water production |
| Green buildings | 10 | Current Estidama initiative | ||
| 11 | More stringent building codes for energy conservation | |||
| 12 | Energy efficiency standardization and labeling programme | |||
| Transport | Sustainable transport | 13 | Transportation demand strategies | |
| 14 | Encourage purchase of high efficiency vehicles | |||
| Industry | Energy and industrial efficiency | 15 | Gas flaring reduction in oil and gas industry | |
| 16 | Energy efficiency at industrial cogeneration facilities | |||
| 17 | Energy efficiency in aluminum production | |||
Table 1: Policies and technologies considered in assessing public health co-benefits in the Abu Dhabi Metropolitan Area.
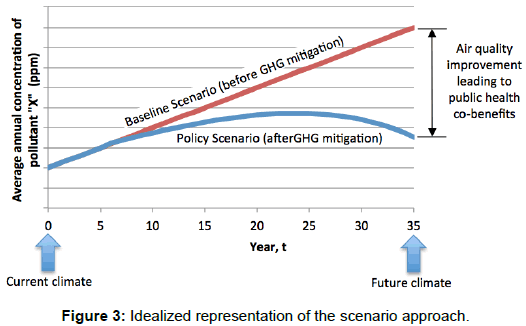
A scenario framework was developed to estimate the impact of GHG mitigation policies. A scenario is simply an assumed representation of a plausible future under certain conditions. It is not a prediction of the future, but rather a narrative concerning a potential future given certain assumptions. Specifically, two scenarios were considered; a “Baseline Scenario”, corresponding to a future where Abu Dhabi’s Climate Change Strategy is not implemented and a “Policy Scenario” corresponding to a future where Abu Dhabi’s Climate Change Strategy is implemented, in part or in whole (Figure 3). Absent any initiatives to reduce greenhouse gas or air pollutant emissions, the concentration of air pollutants in the Abu Dhabi Metropolitan Area are projected to increase over the planning period (red line in Figure 3). With the implementation of greenhouse gas mitigation initiatives, the concentration of air pollutants in the Abu Dhabi Metropolitan Area is projected to decrease over the planning period, a direct co-benefit of those initiatives (blue line in Figure 3).
The sequence of calculations from GHG emission reductions to health co-benefits required the development of a comprehensive modeling framework. An idealized representation of the key components and analytical flow sequence appears in Figure 4. A brief description is offered in the bullets below.
• Air pollutant emission levels: Three source emission models for the power supply, transport, and industrial sectors were developed to estimate stationary and mobile air pollutant emissions (i.e., total annual pollutant emissions to the atmosphere in units of tonnes per year) over the period 2007 through 2035 for the Abu Dhabi Metropolitan Area.
• Regional climate modeling: Version 3.5.1 of the Weather Research and Forecasting (WRF) model was run to establish current and future climate-changed meteorological conditions in the Abu Dhabi Metropolitan Area [10]. WRF was employed to dynamically downscale climate fields from a comparatively coarse-scale gridded global domain to a comparatively fine-scale regional domain that is relevant for assessing climate change impacts at regional-to-local scales. Climatic conditions (i.e., temperature, rainfall, humidity, wind speed/direction) were projected for the period 2007-2035 period under Representative Concentration Pathway 8.5 (RCP8.5) forced by the boundary conditions of NCAR Community Earth System Model [11] . The grid spacing of 4 km resolution, as shown previously in Figure 2, was used.
• Parameterized air quality modeling: A parameterized approach was developed to process the source emissions and quantify the impact on air quality (i.e., concentrations of pollutants in the atmosphere in units of μg/m3). This approach relies indirectly on a number of input models including the WRF model, and outputs from the Community Multi-scale Air Quality model (CMAQ) model for Abu Dhabi [12].
• Health impacts: The Environmental Burden of Disease Model was used to evaluate premature avoided deaths avoided and excess health-care visits avoided by the introduction on one or more of the policies in Abu Dhabi’s Climate Change Strategy. This is the model developed for the UAE that translates air pollutant concentrations from the previous steps into public health impacts from the inhalation of outdoor particulate matter and ground-level ozone [9].
Source emissions modeling
Annual air emissions in the Abu Dhabi Metropolitan Area were estimated through the application of the power supply, transport, and industrial models. Each of these models were developed as independent analysis modules that can be run individually to analyze one or more sector-specific policies, or as part of an integrated modeling system to analyze one or more policies across one or more sectors. The modularity of this approach offers the flexibility for each emissions model to be capable of policy-specific analysis of air emission reductions.
The power supply model aimed to represent the capacity planning and dispatching of electricity within the Abu Dhabi Emirate. It included all capacity, generation, and electricity transmission components that together comprise Abu Dhabi Water and Electricity Authority operations. Power generation takes place in high-efficiency cogeneration stations where desalinated water is co-produced. Power plant performance characteristics such as combustion efficiency, installed air pollution control equipment, and fuel type used for both existing and new generating technologies were used in combination with projected electricity demand to estimate annual emissions of air pollutants and GHGs. The model was able to capture changes in power supply system characteristics under Baseline (i.e., business-asusual) conditions as well as under conditions of individual or collective implementation of GHG mitigation strategies.
The transport model aimed to represent current and future travel conditions within the Abu Dhabi Metropolitan Area. It codified and integrated assumptions embedded in the travel demand model developed by the Department of Transportation for Abu Dhabi's Surface Transportation Master Plan [13,14]. These assumptions applied to certain transport modes (i.e., on-road vehicles), travel demand characteristics (e.g., trip patterns, growth in vehicle kilometers travelled), infrastructure conditions (e.g., public transport, roads, land use) and other parameters. Transport sector emissions associated with private, commercial and public on-road vehicles (i.e., cars, light trucks, heavy trucks, buses) or their displacement by electric-powered transport alternatives were accounted for in the model. All other modes - air, marine, recreational boating, military vehicles - were not addressed by the model. The model captured changes in vehicle stock under Business-as-usual (i.e., the STMP) conditions as well as under conditions of individual or collective implementation of GHG mitigation strategies.
The industrial model aimed to represent current and future productive activities within key sub-sectors in the Abu Dhabi Metropolitan Area. Both onshore and offshore industrial facilities were considered. As a simplifying assumption, the focus of the industrial model was on four distinct activities at these facilities. For onshore facilities, the focus was on process heat and power generation aluminum production, and oil refining. For offshore facilities, the focus was on oil and gas operations. Together, these four activities represent a large share of air emissions associated with industrial activities. The industrial model was the crudest of the three emission models in terms of its internal algorithms. This is primarily due to the nature of the data received which was relatively high-order (e.g., total annual emissions per facility) and generally sparse regarding activity (e.g., tonnes of steam per facility) or growth data (private sector growth plans).
Air quality modeling
Air quality modeling for the Abu Dhabi Metropolitan Area was carried out using a parameterized approach, based on results from an air quality modeling study using CMAQ conducted for the UAE in for 2007/2008. This modeling effort was undertaken by researchers at the University of North Carolina as part of the Environmental Burden of Disease Assessment [9]. The inputs, assumptions, and modeling results for CMAQ modeling in the UAE - including emissions inputs using the Sparse Matric Operator Kernel Emissions [15] pre-processing model - were extracted from the UNC study. In brief, previous CMAQ modeling used a grid resolution of 12 km and temporal resolution of one hour, with pollutant concentrations modeled for two periods: 1 May 2007 – 30 July 2007 and 15 December 2007 – 28 March 2008. These two periods were able to capture most of the annual variability and were assumed to provide a representative dataset for the development of average annual pollutant concentrations.
The starting point for the air quality parameterization process was the CMAQ pollutant concentrations dataset, which was post-processed to create the background pollutant concentrations centered over the Abu Dhabi Metropolitan Area for the 2007-2008 Base Year. Broadly, this involved extracting CMAQ pollutant concentration outputs data at a 12 km resolution and downscaling these outputs to the 4 km spatial resolution, as shown in Figure 2. It was assumed that the background pollutant concentrations were the same for 2035 and the change in pollutant concentration were due to local emission sources. For 2035, pollutant concentrations from stationary sources in 2035 involved several steps. These steps aimed at accounting for the lateral dispersion and vertical mixing of the projected pollutant emissions over the Abu Dhabi Metropolitan Area. Pollutant concentrations in 2035 were estimated for emissions from the 21 power plants and industrial facility sites that are operational across the Abu Dhabi emirate.
The development of pollutant concentrations from mobile sources in 2035 involved several steps. These steps also aimed at accounting for the lateral dispersion (horizontal wind flow) and vertical mixing (atmospheric instability in the atmosphere) of the projected pollutant emissions over the Abu Dhabi Metropolitan Area. Mobile sources refer to seven (7) types of on-road vehicles in the Abu Dhabi Metropolitan area. The steps involved 1) accessing mobile source emission inventories; 2) developing gridded pollutant dispersion estimates; 3) developing vertical pollutant dispersion estimates; and 4) developing pollutant concentration estimates.
One challenge in this analysis methodology was the estimation in the distribution of ozone. The total concentration of ozone near the surface is dependent on the amount of emissions such as NOX and to a lesser degree VOC observed in the boundary layer. CMAQ outputs provided estimates of the background ozone emissions. For the 2007 base year, ozone emissions were estimated using the observations from available air quality monitoring stations located around Abu Dhabi. The distribution of ozone was then estimated by using the spatial distribution pattern of the NOXand scaled to the distribution of ozone observed at the air quality monitoring stations for the 2007 Base Year. For 2035, the NOX change fields for the Baseline and Policy Scenarios were used to adjust the level of ozone from 2007 baseline levels. The spatial distribution of ozone was then mapped to the spatial distribution of NOX for 2035.
Public health co-benefit modeling
Public health co-benefit modeling relied exclusively on the algorithms in the health model developed as part of the Environmental Burden of Disease Assessment for outdoor air pollution. This model was developed using UAE-specific health and population data for the year 2008. Such data were used in combination with a set of concentration-response coefficients obtained from a duly referenced set of epidemiological study references MacDonald Gibson, et al., 2013. No other concentration-response coefficients were used to derive estimates of public health co-benefits.
The structure of the EBDA health model consists of separate submodules devoted to PM10, PM2.5 and O3 within the “Outdoor Air Pollution Global Module”. Each of these submodules was comprised of the same structure consisting of individual nodes that represent entry points for the range of required data and assumptions. Within the EBDA, health endpoints are defined as the outcome of the impact of pollution on human health. Specifically, two health endpoints are modeled: premature deaths and excess health-care visits. The former refers to mortality in adults over 30 years of age and children under 5 years of age that can be directly attributed to outdoor air pollutant after background pollution from natural and transboundary pollution contributions have been removed from the total pollutions estimates. The latter refers to morbidity effects that can be directly attributed to outdoor air pollutant after background pollution from natural and transboundary pollution sources have been removed from the total pollution estimates.
The above epidemiological assumptions were codified into algorithms embedded into a software tool called the “Health Cobenefits Inspector”. This tool was used compute the magnitude of premature deaths avoided and excess health-care facility visits avoided relative to the penetration of GHG mitigation technology, either individually or in combination. Co-benefits are generated as pollutant concentrations decrease throughout the Abu Dhabi Metropolitan Area due to the implementation of the GHG mitigation policies. For 2035, the difference in average annual pollutant concentrations was calculated directly on the basis of modelgenerated ambient air pollutant concentrations. For intervening years, linear scaling and interpolation techniques will be applied to determine the change in ambient air pollutant concentrations from the start year of policy implementation through to the end of the assessment period.
The magnitude of health co-benefits is a function of the kinds of policies implemented and the nature of their implementation. That is, some policies affect emissions from point sources while other policies affect emissions from mobile sources. The kind of policy has a large impact on how pollution is dispersed (i.e., large quantities from a few tall stacks versus small quantities from many ground-level sources). In addition, some policies apply targets that can have a large impact on the particular sector while other policies apply targets that produce a more modest impact.
Technology Diffusion Targets
As much as possible, technology diffusion targets were established consistent with information provided in the Climate Change Strategy [8], where such information was available. For those policies where targets are in the process of being developed and hence unavailable, placeholder assumptions were made. These assumptions were typically on the aggressive side, as a way of illustrating the public health potential. They should not be understood as a prediction of the eventual target, but simply a placeholder until such targets are finalized. The numbers below summarize the target assumptions.
1. Nuclear power generation: 4 units each with a net capacity of 1,345 MWe, coming only in 2017, 2018, 2019, and 2020.
2. Renewable energy power plants: Start year for the policy in 2020, with 10% of all generation comes from non GHGemitting renewable sources by 2035.
3. One renewable energy water desalination pilot project: Start year for the policy is 2020 for a 100 MW solar PV station.
4. Renewable energy water desalination plants: Start year for the policy is 2020 for a 100 MW concentrating solar power stations (Shams 1) and a 10 MW concentrating solar power stations (Masdar).
5. Waste-to-energy power plants: Start year for the policy is 2020 for a 50 MW waste-to-energy plant.
6. Feed in tariff to sell power to the grid: Start year for the policy in 2020, with the feed-in tariff leading to an incremental 10% of all generation comes from non GHG: emitting renewable sources by 2035.
7. Solar roofs: Start year for the policy in 2020, resulting in 10% of all generation coming from distributed generation in solar roofs by 2035.
8. Supply side energy efficiency strategy for electricity and water production: Start year for the policy in 2020, resulting in 1.0%/year improvement through 2035 in the heat rate (i.e., combustion efficiency) of the following power stations: Taweelah New Extension, Taweelah A2, Shuweih S1, and Sas Al Nakhi.
9. Demand side management strategies for electricity and water production: Start year for the policy in 2020, resulting in 10% demand side savings in new residential construction by 2035.
10. Current Estidama initiative: Start year for the policy in 2020, with 10% electricity savings of new commercial buildings by 2035.
11. More stringent building codes for energy conservation: Start year for the policy in 2020, with 10% of new home floor space included in the Progamme by 2035.
12. Energy efficiency standardization and labeling programme: Start year for the policy in 2020, with 10% electricity savings in the residential sector by 2035.
13. Transportation demand strategies: Start year for the policy in 2020, with passenger car and passenger light vehicle kilometer growth rates half of what they were in the Baseline Scenario.
14. Encourage purchase of high efficiency vehicles: Start year for the policy in 2020, with all passenger vehicles a 50%-50% mix of plug-in hybrid and electric vehicles by 2035 and all other vehicle sales being 100% high efficient vehicles by 2035.
15. Gas flaring reduction in oil and gas industry: Start year for the policy in 2020, with flaring growth rates half of what they were in the Baseline Scenario.
16. Energy efficiency at industrial cogeneration facilities: Start year for the policy in 2020, resulting in 1.0%/year improvement through 2035 in the heat rate of the following facilities: Asab Agd II, Ruwais refinery, Habshan, Bu Hasa Adgas, Al Wagan, Sheikh Khalifa hospital, Mussafeah Industrial City.
17. Energy efficiency in aluminum production: Start year for the policy in 2020, resulting in 1.0%/year improvement through 2035 in the heat rate of the Taweelah aluminum smelter.
GHG mitigation co-benefits
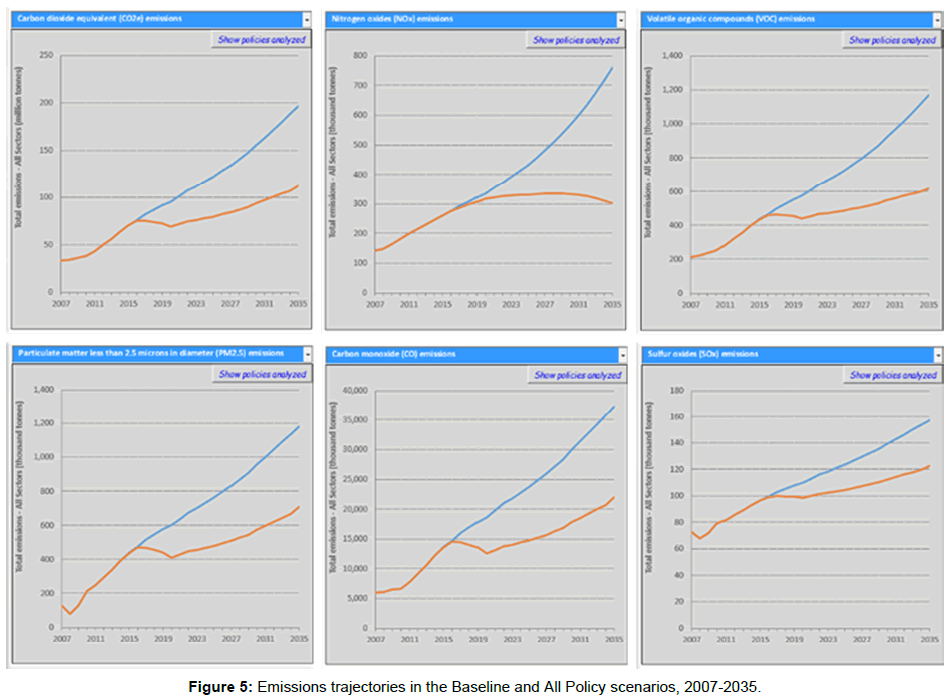
The emissions trajectories associated with the implementation of all policies in shown in Figure 5. As shown in the Figure, the collective impact of the Climate Change Strategy is significant, resulting in a sharp decrease in the average annual rate of growth in emissions. Relative to Baseline Scenario emissions in 2035, the reductions achieved by the policies range from 40% for PM2.5 to 60% for NOX. The sharp discontinuity in the charts for all but NOx reflect the impact of the nuclear station coming online and the emission factor assumptions that were used to compute total emissions.
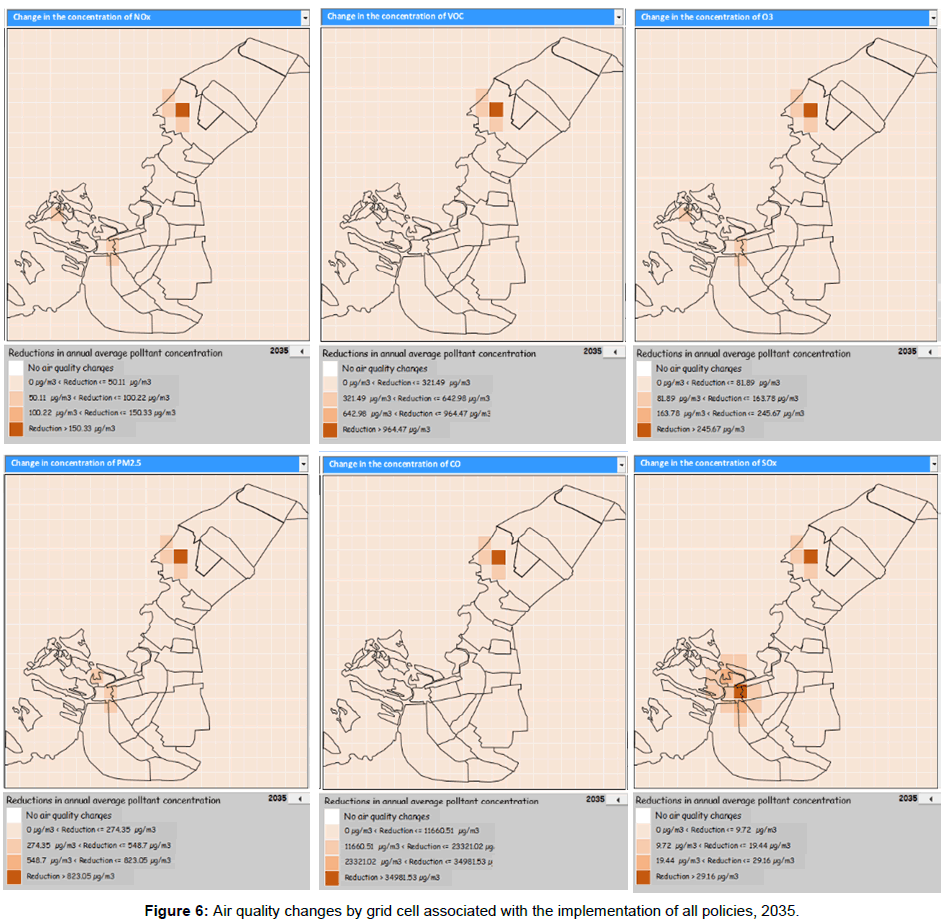
The air quality changes in 2035 associated with the implementation of all policies in shown in the maps in Figure 6. As shown in the Figure, the collective impact of the Climate Change Strategy is significant, resulting in improvements in air quality, especially around the location of stationary sources of pollution. Though not reported here, air quality changes are also estimated for the intervening years of 2020, 2025, and 2030. It is important to note that only changes in PM2.5 and O3 concentrations are used to estimate public health co-benefits. For PM2.5, most of the Abu Dhabi Metropolitan Area (i.e., 332 out of 462 grid cells, or 72%) experiences improvements in air quality of at least 30 μg/m3. For those areas close to large stationary sources of pollution, air quality changes can be many times higher. For ozone, the situation is similar. Most of the Abu Dhabi Metropolitan Area (i.e., 430 out of 462 grid cells, or 93%) experiences improvements in air quality of at least 30 μg/m3.
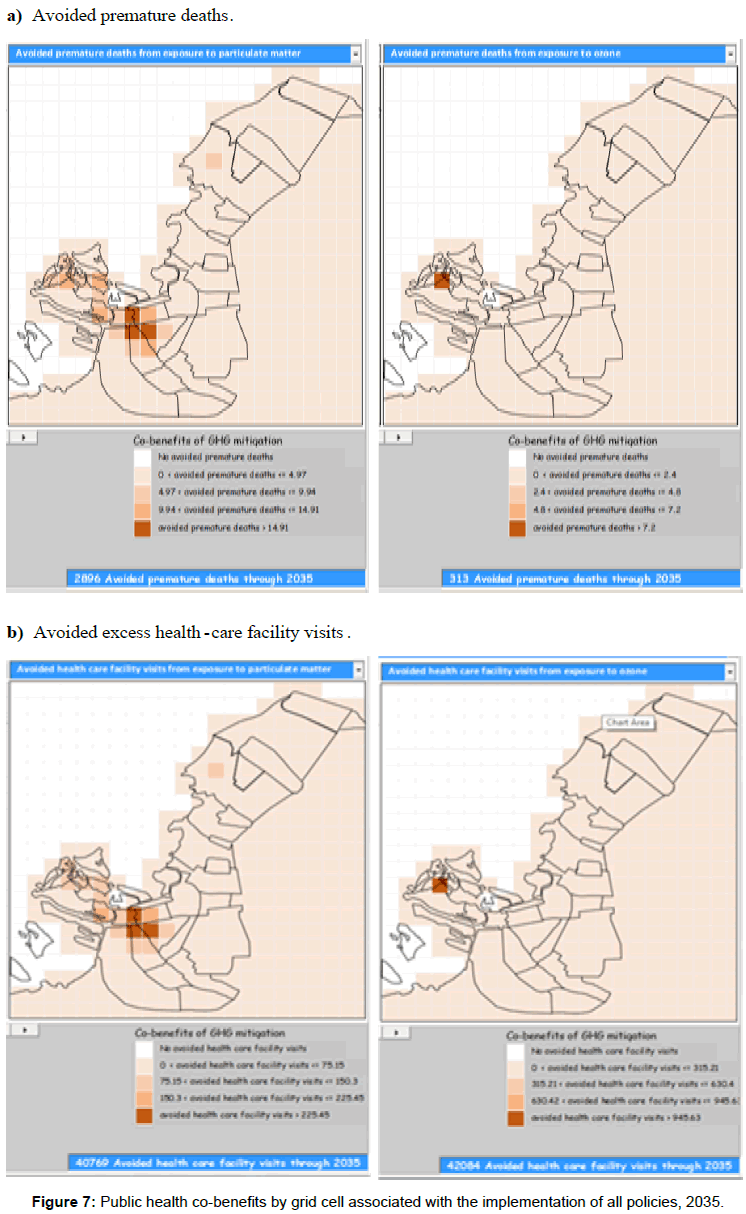
The annual premature deaths avoided in 2035 and cumulative premature deaths avoided through 2035 due to the implementation of all policies in shown in the maps in Figure 7a. As shown in the Figure, the collective benefits to public health in the Abu Dhabi Metropolitan Area from the implementation of the Climate Change Strategy is significant, resulting in 2,896 cumulative avoided premature deaths from particulate matter and 313 cumulative avoided premature deaths from ground-level ozone. In total, 3,219 premature deaths are estimated to be avoided by the implementation of the Climate Change Strategy. For particulate matter, the areas showing the highest benefits from implementation of the policies are located near Abu Dhabi Island and the Capital District. For ozone, the areas showing the highest benefits from implementation of the policies are located near Abu Dhabi Island. Though not reported here, premature death avoided are also estimated for the intervening years of 2020, 2025 and 2030.
The annual excess health-care visits avoided in 2035 and cumulative excess health-care visits avoided through 2035 due to the implementation of all policies in shown in the maps in Figure 7b. As shown in the Figure, the collective benefits to public health in the Abu Dhabi Metropolitan Area from the implementation of the Climate Change Strategy is significant, resulting in 40,769 cumulative avoided excess health-care facility visits due to exposure to particulate matter and another 42,084 cumulative avoided excess health-care facility visits due to exposure to ground-level ozone. In total, 82,853 avoided excess health-care facility visits are estimated to be avoided by the implementation of the Climate Change Strategy. For particulate matter, the areas showing the highest benefits from implementation of the policies are located near the Capital District. For ozone, the areas showing the highest benefits from implementation of the policies are located near Abu Dhabi Island. Though not reported here, excess health-care facility visits avoided are also estimated for the intervening years of 2020, 2025, and 2030.
Conclusion
Until now, the public health co-benefits associated with strategies to reduce GHG emissions in Abu Dhabi has not been well understood. While there are several notable initiatives to reduce the carbon footprint of energy consuming activities in Abu Dhabi, there has not been a comprehensive assessment of the positive impacts that such measures have on public health. These positive impacts now quantified in this study, are important co-benefits of GHG mitigation measures. The results of this study paint a more comprehensive picture of the benefits of GHG mitigation in the Abu Dhabi Metropolitan Area - namely that the continued diffusion of energy efficient and renewable technologies, particularly in the power and transport sectors can avoid thousands of premature deaths and visits to health care facilities. Future application of the modeling framework and tool developed in this study can be used to account for health co-benefits of alternative technologies or technology diffusion targets. With continued progress in the Abu Dhabi emirate to expand and intensify GHG-reducing technologies, these public health co-benefits will likewise increase. An improved understanding the public health benefits of current measures can help to build support for continued investments in GHG mitigation measures, while also promoting public awareness of the benefits of sustainable development practices.
Acknowledgements
This research was supported and managed by the Abu Dhabi Global Environmental Data Initiative (AGEDI) as part of the Local, National, Regional Climate Change Programme consisting of twelve projects across five different thematic areas. Special thanks are extended to Jane Glavan and Marco Vinaccia and the multiple key stakeholders across the Abu Dhabi emirate who provided invaluable feedback.
References
- Haines A, McMichael A, Smith K, Roberts I, Woodcock J, et al. (2009) Public health benefits of strategies to reduce greenhouse-gas emissions: overview and implications for policy makers. Lancet 374: 2104-2114.
- West J, Smith S, Silva R, Naik V, Zhang Y, et al. (2013) Co-benefits of mitigating global greenhouse gas emissions for future air quality and human health. Nat Clim Change 3: 885-889.
- IPCC (2015) Climate Change 2014: Synthesis Report. Contribution of Working Groups I, II and III to the Fifth Assessment Report of the Intergovernmental Panel on Climate Change. IPCC, Geneva, Switzerland. pp: 151.
- Bollen J, Guay B, Jamet S, Corfee-Morlot J (2009) Co-benefits of Climate Change Mitigation Policies. OECD Economics Department Working Papers 693: 46.
- Harlan S, Ruddell D (2011) Climate change and health in cities: impacts of heat and air pollution and potential co-benefits from mitigation and adaptation. Environ Sustain 3: 126-134.
- Jack D, Kinney P (2010) Health co-benefits of climate mitigation in urban areas. Environmental Sustainability 2: 172-177.
- Government of Abu Dhabi (GoAD) (2014) Climate Change Strategy for the Emirate of Abu Dhabi (2015-2019): A High Level Strategy and Action Plan to Mitigate Climate Change and Adapt to its Impacts.
- MacDonald JG, Brammer A, Davidson C, Folley T, Launay F, et al. (2013) Environmental Burden of Disease Assessment - A case study in the United Arab Emirates. Environ Sci Technol Libr 24: 489.
- Department of Transportation of Abu Dhabi (DoT) (2013) Updates to the Surface Transportation Master Plan.
- Department of Transportation of Abu Dhabi (DoT) (2009) Surface Transportation Master Plan.
- Jr Coats CJ, Houyoux MR (1996) Fast Emissions Modeling with the Sparse Matrix Operator Kernel Emissions (SMOKE) Modeling System. In United States: Air and Waste Management Association, Pittsburgh, Pennsylvania, United States.
Relevant Topics
- Advanced Photovoiltoic Cells
- Advanced Photovoiltoic Panels
- Advanced Photovoiltoic Systems
- Advanced Photovoiltoic Technologies
- Alternative Energy
- Biomass Energy
- Coal Energy
- Energy Management
- Environmental Policy
- Green Energy
- Hydro Electric Energy
- Hydrogen Energy
- Hydropower Energy
- Photovoltoics
- Renewable Energy and Research
- Renewable Geothermal Energy
Recommended Journals
Article Tools
Article Usage
- Total views: 2475
- [From(publication date):
specialissue-2017 - Mar 28, 2025] - Breakdown by view type
- HTML page views : 1683
- PDF downloads : 792
