Properties Elucidations of Mn-doped Ba0.7Sr0.3Ti1-xMnxO3 Ceramics
Received: 04-Apr-2023 / Manuscript No. JMSN-23-94248 / Editor assigned: 07-Apr-2023 / PreQC No. JMSN-23-94248 (PQ) / Reviewed: 21-Apr-2023 / QC No. JMSN-23-94248 / Revised: 05-Jun-2023 / Manuscript No. JMSN-23-94248 (R) / Published Date: 12-Jun-2023
Abstract
Ba0.7Sr0.3Ti1-xMnxO3 ceramic with fixed doping of Sr at Ba site and Mn doping with various concentrations at the Ti site has been carefully prepared with conventional solid state reaction technique. As the behavior of materials with the variation of frequency, electric field, and temperature is a focus of interest for technological advantage in the field of microelectronics, telecommunication and spintronics, we have evaluated different characteristics of the synthesized samples. X-ray diffraction and Scanning Electron Microscopy (SEM) were employed to measure structural and morphological properties of the prepared samples. XRD analysis confirm the tetragonality of the crystal and the volume of the unit cell is observed slightly different except for x=0.3, with the increase of Mn content. SEM images confirm increasing grain size with Mn doping. Dielectric constant and AC conductivity assessed the dielectric properties of Ba0.7Sr0.3Ti1-xMnxO3 in a wide frequency range from kHz to GHz region. This result reveals that with the concentration of Mn the dielectric constant also increases, most importantly for 30% Mn substance with Ti. The results also showed that there is a high dielectric constant at the KHz region for the sample which decreases with the upward frequency. Magnetic permeability was observed to increase with 10% and 30% Mn substitution. VSM data indicated that samples exhibit ferromagnetic properties with feeble coercive field and with the increase of Mn ion concentration ferromagnetic order also found to increase. The multiferroic materials that we have developed can be used in spintronic devices like memory devices, spin transistors, spin diodes, sensors.
Keywords
Perovskite structure; Barium titanate ceramics; Dielectric constant; Permeability; Ferromagnetism
Introduction
Recently, BaTiO3 is one of the focuses of interest for the researcher due to its vastly used ferroelectric properties [1]. Within its 60 years period, wide research investigations were performed on BaTiO3. Although materials dielectric property enhancement led to the invention of BaTiO3, the invention was important due to its ferroelectric properties. It was the first material that proved ferroelectricity could exist in simple oxide materials [2]. It is familiar that the BaTiO3 perovskite is expressed with ABO3 structure. The A site is Barium, the B site is Ti and O is Oxygen. Perovskite materials make themselves one of the most attractive materials due to their multifunctional properties. These properties made a great contribution to the field of electro ceramics and microelectronics [3]. In the large octahedral site of Barium (Ba) ion, the titanium ions can promptly move. The size of the octahedral site is reduced and restricts the motion of the Ti ion if the Ba ion is substituted by the smaller ion. Various dopants such as Sr, Nb, La, Mg, etc. have been incorporated in BaTiO3, and characterization was performed to evaluate the effects [4,5]. Perovskite materials make themselves one of the most attractive materials as it has multifunctional properties which made a great contribution to the field of electro-ceramics and microelectronics [6]. After all, a series of discoveries were performed by BaTiO3 [7]. Ferroelectric properties often depend on the ferroelectric domain based on ionic spacing and crystal lattice, which are depend on additives and crystal structure. Ferroelectric properties often depend on the ferroelectric domain resulting from ionic spacing and crystal lattice. Thus ferroelectric properties can be modified by additive dopant’s crystal structure. Doped BaTiO3 has been widely investigated as it showed dramatic changes in properties like electrical properties, magnetic properties, and phase transition. Rare earth doped BaTiO3 showed changes in electrical properties and phase transition temperature i.e. Curie temperature Tc. Therefore, doping in BaTiO3 introduced some excellent applications such as capacitor, Multilayer Capacitor (MLC), energy storage device, piezoelectric resonator, gate dielectric, ultrasonic transducer, etc. [8]. Besides that, Ag, Ni, Fe, Gd, Ca, Eu, Ta, ZnO, Nitrobenzene, and many other impurities have been partially substituted to check the structural, morphological, dielectric and magnetic properties of BaTiO3. Most of the research reviews showed individual properties for individual doping [9]. Research on doped BaTiO3 reveals that different doping element performs different specific characteristics which can be used in a different application. BaTiO3 doped in different samples enhances the superconducting property of these samples [10]. For example, dielectric and magnetic properties can be improved with doping of V, MgO, B2O3, Zr [11]. Fe, Ca, Bi, Mn, Co was used to investigate the magnetic properties of BaTiO3 [12]. Although characteristics of BaTiO3 were examined with different impurity doping, more investigation is required for excessive loss of the dielectric and leakage current, poor magnetic response, lattice strain, and high curie temperature [13].
From the literature review, it is known that Sr (Strontium) plays a crucial effect in improving the dielectric property and reducing dielectric loss [14]. Besides this, Mn has a multi valence state and it is also a paramagnetic material. We hope that the doping of Mn at the B site would change the dielectric property of BST significantly; therefore, it is used for developing the electrical conduction in the system. In this research experiment, we doped Sr (Strontium) on A site cation i.e. in Ba and Mn (Manganese) on B site i.e. Ti, expressed by the chemical structure Ba0.7Sr0.3Ti1-xMnxO3 to investigate morphological, electric, and magnetic properties and characterize how material changes its properties with change of doping concentration under different frequency. We prepared the sample via the traditional solid state reaction technique. We hope that the result of the project will improve the multiferroic properties and develop instrumental ability in the microelectronic and telecommunication field or it will surely provide effective information for further research on doped BaTiO3.
Materials and Methods
XRD pattern analysis
To investigate the crystal structure of the prepared samples, XRD patterns were studied by Philips PAN alytical XPERT-PRO X-ray diffractometer with CuKα radiation (λ=1.541Å) at room temperature. The scanning was done with a scanning speed of 1˚/min and the whole scanning range was within 20℃ to 60℃. X-ray diffraction statistics were used to calculate the lattice parameters of all the compositions [15]. XRD patterns of these ceramic compositions were compared with the standard JCPDS files of fcc phase of BST (Barium Strontium Titanate) crystal for the different constituting phases.
Density measurement
The theoretical density (ρₓ) was measured by the equation,

Where; n=Number of atoms in a unit cell. MA=Molar mass of the sample. NA=Avogadro’s number. V=Volume of the unit cell.
The bulk density (ρᵦ) of each sample was calculated using the formula.
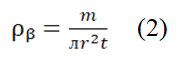
Where; m=Mass. r=Radius. t=Thickness of the sample.
Scanning electron microscopy
To examine the microstructure of a solid object, scanning electron microscopy is the most versatile instrument. The grain size of each sample was calculated from the SEM image using the linear intercept method [16].
Electrical characteristics
To investigate the dielectric properties of the prepared ceramic samples, it is necessary to coat conducting silver paint on both sides of the electrode which will ensure good electrical contacts [17]. An impedance analyzer was used to measure dielectric properties at room temperature within the frequency range of 1 kHz-10 MHz. The dielectric constant (ε´) was calculated from the capacitance using the following formula:
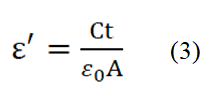
Where; C=Capacitance of the pellet. A=Cross-sectional area of the electrode. ε0=(8.85 × 10⁻¹² F m) is the permittivity in free space.
The imaginary part of the dielectric constant that is the energy loss from an AC signal as it passes through the dielectric is represented by the following equation.
Imaginary part of permeability.
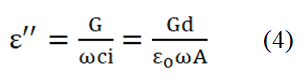
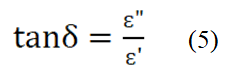
Where; G=Conductance. ω=2πf=Angular frequency. The loss factor is given by the equation,
The relative quality factor is,
Magnetic characteristics
A Vibrating Sample Magnetometer (VSM) (micro sense, EV9) was used to observe the Magnetic Hysteresis (M-H) loops. The real part (μiʹ) and imaginary part (μi″) of the complex initial permeability (μi *) were measured as a function of frequency within the range of 10 kHz to 100 MHz using a Wayne Kerr 6500 B impedance analyzer [18]. The values of μiʹ and μi″ were calculated using the relations:
Where, LS=Self-inductance of the sample core. L0= Inductance of the winding of the coil without the sample. tan δ=Magnetic loss. L0=Derived from the geometrical relations.
Where, μ0=Permeability in vacuum. N=Number of turns of the coil (N=5). S=Cross-sectional area. d=(d1+d2)/2 is the mean diameter of the toroid shaped sample. d1 and d2=Inner and outer diameter of the toroid shaped sample, respectively.
Sample preparation
Conventional solid state reaction technique has been used as a preparation method for Ba0.7Sr0.3Ti1-xMnxO3 ceramics where x=0, 0.1, 0.2, 0.3. BaCO3, SrO, MnCO3 TiO2 used as raw materials for the preparation of ceramic samples. All raw materials are almost 99.9% pure. Every raw sample is mixed according to the stoichiometric formula. Milling is carried out to reduce the particle size of the powders to the micron range for the ease of solid phase reactions to occur by atomic diffusion. Mortar and pestle were used for milling operations. Each sample was milled for 6 hours [19]. In hand milling, the particle size is reduced by the action of the pestle and friction of the pestle with the powder. Then mixed powder was calcined in ambient air at 750℃ (below the melting point of the reactants) to obtain the perovskite phase through the diffusion controlled reaction for 4 hours. For the next step, the calcined powder was ground thoroughly and performed hand milling for 2 hours again to obtain a homogenous mixture. After that powders were mixed with 10%Polyvinyl Alcohol (PVA) for granulation binder. We make 4 shapes of pellet for each sample of Ba0.7Sr0.3Ti1-xMnxO3 of concentration that is three 0.3 g, 0.6 g, 1 g disk shape pellet, and a 1g ring shape pellet by applying a uniaxial pressure of 45 MPa. Later, the prepared sample Ba0.7Sr0.3Ti1-xMnxO3 (where, x=0, 0.1, 0.2, 0.3) were sintered at 1250℃ for 3 hour [20].
Results and Discussion
Structural properties
Figure 1a (i) illustrates the XRD patterns of the standard JCPDS file of fcc phase of BST crystal. Figure 1a (ii, iii, iv, and v) shows the XRD patterns of Ba0.7Sr0.3Ti1-xMnxO3 ceramics for x=0, 0.1, 0.2, and 0.3, sintered at 1250℃ for 3 hours and the unit cell volume of the prepared samples. Tetragonality of the XRD patterns of Ba0.7Sr0.3Ti1-xMnxO3 ceramics matched well with the earlier reported result. XRD pattern of a composite material may show signatures of different materials which are sometimes termed as impurity peaks or secondary phases. Such impurity peaks or secondary phases were observed of the XRD patterns of Ba0.7Sr0.3Ti1-xMnxO3 ceramics as compared to the XRD patterns of the standard JCPDS file of fcc phase of BST crystal whicha re shown in Figure 1a. These impurity peaks are observed due to the presence of BaCO3 or SrO. The existence of such impurity peaks has been reported earlier by several authors.

Figure 1: a) X-ray diffraction patterns of i) the standard JCPDS file of fcc phase of BST crystal; ii) 0%; iii) 10%; iv) 20%; and v) 30% Mn-doped Ba0.7Sr0.3TiO3 powder samples treated at annealing temperatures 1250℃ for 3 h, the peaks of tetragonal (top) are labeled with Miller indices (hkl). b) Variation of unit cell volume with the increase of Mn contents for Ba0.7Sr0.3TiO3 perovskites.
The intensity of the XRD peaks decreases and peaks broadening occurs with the increasing Mn concentration. XRD pattern of doped BaTiO3 slightly shift compared with barium strontium titanate indicates the presence of the tetragonal perovskite (P4 mm) and confirms the homogeneity. The Un doped Ba0.7Sr0.3TiO3 reference sample shows an XRD pattern for comparative advantage. Based on the measured XRD patterns we have determined the unit cell parameters of the samples by the equation for the tetragonal structure. The variation of bulk density (ρβ) X-ray density (ρx), porosity (P), Ba0.7Sr0.3Ti1-xMnxO3 (x=0.0-0.3) with different Mn content (x) sintered at 1250℃ are summarized in Table 1. We observed that the c unit cell parameter slightly increased and decreased with Mn-doping of samples Ba0.7Sr0.3TiO3 compared to the un-doped BaTiO3 sample. Therefore, the cell volume slightly changed with Mn concentration for x=0, 0.1 and 0.2. However, there is a sharp increase in cell volume for x-0.3, this may be due to the presence of oxygen vacancy or represents the presence of impurities. A certain amount oafr ibum carbonate was found to be always present in the samples indicated by the XRD pattern although different precautions were taken to minimize the contamination, impurities are hard to eliminate with this method of synthesis. It has been seen from Figure 2a that bulk density decreases with the increase in Mn substances and X-ray density remain almost the same. The density decreases due to the lower atomic weight of BST as well as the Mn. Moreover, there is a variation in bonding among the element and there is a change in the interatomic distance which in turn contributes to the expansion of the unit cell and leads to a decrease in the density. It is also seen that the bulk density is lower than the Xray density, this may be due to the presence of some pores in the bulk samples which are formed and developed during the preparation of samples or the sintering process. The porosity of ceramics samples develops from two sources: Inter granular porosity and intra granular porosity. But the major obstacles are inter granular porosity and bulk density decreases may be due to inter granular porosity. Porosity P follows the opposite trend of bulk density, shown in Figure 2b.
| Sample | Lattice parameter, a (Å) | Lattice parameter, c (Å) | Bulk density, ρB g/cc | X-ray density, ρX g/cc | P (%) |
|---|---|---|---|---|---|
| Ba0.7Sr0.3TiO3 | 4.13 | 3.585 | 3.31 | 5.93 | 35.91 |
| Ba0.7Sr0.3Ti0.9Mn0.1O3 | 4.135 | 3.598 | 3.18 | 5.9 | 38.12 |
| Ba0.7Sr0.3Ti0.8Mn0.2O3 | 4.131 | 3.581 | 2.84 | 5.98 | 48.55 |
| Ba0.7Sr0.3Ti0.7Mn0.3O3 | 4.132 | 3.581 | 2.66 | 5.9 | 49.26 |
Table 1: Lattice parameter, density, and porosity for different samples.

Figure 2: a) Variation of density with the increase of Mn content for Ba0.7Sr0.3TiO3 perovskites (x=0.0-0.3) perovskites; b) Variation of porosity with the increase of Mn content for Ba0.7Sr0.3TiO3 perovskites.
Morphological properties
Figure 3 shows the SEM micrograph of Mn doped barium strontium titanate annealed at 1250℃ for 3 hours. It is believed that the material's multiferroic microstructure makes an influence on materials' electric and magnetic properties. Here, in our experiments, the average grain size is estimated with SEM. Here, microstructure showed that all composition consists of grains with a variation in orientation and they are distributed non-uniformly. This type of grain growth behavior presents the existence of the competition of force due to grain boundary movement and pores. The average grain size of various Ba0.7Sr0.3Ti1-xMnxO3 (x=0-0.30) perovskite with the variation of Mn content is estimated in the range of 0.760 μm to 1.550 μm after sintering. The variation of Mn content shows a strong dependence on grain size. The average grain diameter goes on increasing with the Mn content from x=0 to x=0.2 then show a sharp decrease in grain diameter. The grain growth happens due to recrystallization occurrence in which grains grow rapidly using smaller grains. However, the decline in grain size occurs with 30% Mn, which may cause a variation in the diffusion process of grain growth mechanism and changes the grain size. We have seen from the SEM images that with the concentration varying as 0% Figure 3A, 10% Figure 3B, 20% Figure 3C, and 30% Figure 3D of Mn substances the particle shapes changed from spherical to less spherical with some irregular structures.

Figure 3: SEM micrographs of Ba0.7Sr0.3Ti1-x MnxO3, A) for 0%; B) for 10%; C) for 20%; and D) for 30% Mn doped BST powder samples treated at annealing temperatures of 1250℃ for 3 h.
Complex initial permeability
The real and imaginary part of the magnetic permeability controls the mechanism of the dynamic properties of the materials and their adaptability in the high frequency application. The overall permeability i.e. complex permeability of materials can be represented by the equation, μ̽ =μʹ-μʺ, where, μʹ is the real part and μʺ is the imaginary part of magnetic permeability. The real part represents the energy that is stored in the system and represents the component of magnetic induction B in phase with the alternating magnetic field. And the imaginary part represents the energy dissipation, expressing the magnetic induction B out of phase with the applied alternating magnetic field. The investigated results of the variation of real permeability, μʹ and their magnetic loss (tanδ=μʺ/μʹ) with the applied frequency of Ba0.7Sr0.3Ti1-xMnxO3 perovskites of different compositions, sintered at 1250℃, are illustrated in Figure 4 (a,b). From Figure 4, it is noticed that with the increase of frequency the real permeability decreases. Ba0.7Sr0.3Ti1-xMnxO3 for x=0.2 has a lower permeability than others. Ba0.7Sr0.3Ti1-xMnxO3 for x=0, 0.1, 0.3 has almost same real permeability. Although x=0.2 has low permeability, a stable condition of permeability value was found for x=0.2. This frequency stability is attributed since the arrangement of the magnetic moment can follow the variation of the applied magnetic field for a longer time during the magnetization. This frequency stability is useful for various applications like a broadband transformer and wideband read-write head for video recording. The real permeability, μiʹ=1+χspin+χdw, where, χspin and χdw denote the magnetic susceptibility of spin and domain wall motion, respectively. χdw and χspin can be expressed as χdw=(3πMS2/K) and χspin=(2πMS2/K), where, γ is the domain wall energy. The value of real permeability decreases with frequency because at higher frequency pinning points originates at the surface of the samples due to the impurity of grains and intra-granular pores. This hinders the turn of the motion of the domain wall and decreases the permeability (Table 2).

Figure 4: Variation of a) Real permeability, μʹ and; b) Magnetic loss factor, tan δ with frequency for various Ba0.7Sr0.3Ti1-xMnxO3 ceramics sintered at 1250℃ for 3 h.
| Sample | Average grain size (mm) |
|---|---|
| Ba0.7Sr0.3TiO3 | 0.76 |
| Ba0.7Sr0.3Ti0.9Mn0.1O3 | 1.11 |
| Ba0.7Sr0.3Ti0.8Mn0.2O3 | 1.55 |
| Ba0.7Sr0.3Ti0.7Mn0.3O3 | 0.81 |
Table 2: Average grain size for various samples.
Dielectric properties
Figure 5a,b,c illustrates the variation of dielectric constant, imaginary permittivity and AC conductivity of Ba0.7Sr0.3Ti1-xMnxO3 perovskites as a function of frequency. From the Figure 5, it is observed that the dielectric constant decreases with the increasing frequency. As the dielectric properties of BST samples depend on different factors as a function of frequency, hereby doping Sr and Mn at A site, and B site respectively, the unit cell, crystalline phase, amount of crystallinity, and grain size changes which make a significant influence at material dielectric properties. The Debye equation for the variation of dielectric constant with the frequency written as follows:
Where; τ=Relaxation time. εo =Dielectric constant at a very low frequency. ε∞=Dielectric constant at a very high frequency, respectively.
From the Debye equation, it is clear that when frequency increases the value of ε′ decreases which agrees with the behavior of ε′ as shown in Figure 5a for the present compositions.
The polarization of samples also plays an important role in the variation of dielectric constant with frequency. Three types of polarization are dipolar, ionic, and electronic. However, another type of polarization for polycrystalline compounds is interfacial or space charge polarization that may originate in the materials under investigation from the point defects during sintering. From Figure 5 a it is seen that the dielectric constant decreases with the increasing frequency as there is weak orientational and space charge polarization at the high frequency range. It is also decreased by the depolarization of dipoles that exists at weakly bounded interfaces and particle boundary region. However, the existence of the interfacial barrier at the electrodes introduces parasitic capacitances and resistances at the system that causes a decrease in dielectric constant with the increasing frequency of various oxide materials. Another behavior is also seen in Figure 5a that the dielectric constant increases with the increasing concentration of Mn up to 20% and then decreases by 30% concentration of Mn. The dielectric constant for 20% Mn concentrations shows higher dielectric property than other concentrations. It is also found that there is a sharp increase in dielectric constant at MHz frequency region after a stable dielectric constant which may be caused by the space charge polarization. As both Sr and Mn can be replaceable by Ba and Ti we saw a stable graph for each characteristic.
It is known that the imaginary permittivity is one type of loss which is occurred by the energy loss when the AC signal passes through the sample. It may be due to heat loss or any other form. From Figure 5 b we see that at first higher imaginary permittivity for 10% and 20% Mn concentration and slightly small imaginary permittivity for 30% Mn concentration. However, this situation changes with the increase of frequency where we can see that this parameter decreases with the increase of frequency at 10% and 20% Mn concentration and the opposite scenario was found at 30% Mn concentration. There is an observation of low and stable imaginary permittivity for Mn free BST.

Figure 5: Variation of a) Dielectric constant, ɛʹ and; b) Imaginary permittivity, ɛʹˊ; c) AC conductivity with frequency for various Ba0.7Sr0.3Ti1-xMnxO3 ceramics sintered at 1250℃ for 3 h.
In Figure 5 (c), the reciprocal of resistivity i.e. AC conductivity versus frequency is shown. Here, in the Figure, AC conductivity changes independently with the changes in frequency. The Figure 5 illustrates that barium strontium titanate, the parent sample (x=0.0) has the highest conductivity and conductivity changes with the variation of Mn content on titanium sight. For x=0.3, the samples show the lowest AC conductivity with increasing frequency. However, for x=0.1 and x=0.2, the AC conductivity shows slight variation in value. Initially, x=0.2 has the 2nd highest value and x=0.1 has the 3rd. However, at 2.5MHz, x=0.1 cross x=0.2. It is seen that x=0.2 has a long stable condition with the increasing frequency with a mild increase in AC conductivity. We found the highest dielectric constant for x=0.2, the AC conductivity represents that it has a low loss than other samples. At a low-frequency run (1 kHz-0.5 MHz) the conductivity remains relatively independent of frequency while at a higher range (after 0.5 MHz) the conductivity increases strongly. This conduct can be clarified by both Joncher's capacity law and the polaron bouncing method. In the small polaron model, the σAC increases with increasing frequency, and in the large polaron hopping mechanism the σAC decreases with increasing frequency. We have frequency dependent AC conductivity, σac (ω)=σdc+Aωn, where, σdc is dc conductivity, A is the temperature and material dependent preexponential factor and 0 <n <1, from power law of Jonscher. Here, n is the exponent of frequency which is also dependent on both material and temperature and it indicates the interaction between the lattices and the mobile ions. The lower frequency region corresponds to DC conductivity (σDC) and the conductivity (σAC) remains consistent in this area. It is because as per the double layer model of Maxwell- Wanger for dielectrics the resistive grain limits at low frequency are more dynamic. Along these lines in this area, transportation happens through the penetration process. Conflictingly, in the high-frequency region (hopping area), σAC increments all of a sudden in light of the increased hopping by upgraded number of charge transporters (because of the more dynamic grain limits) produced from the substitution component. Therefore, it is clear that the change that has been seen in this sample concurs with Jonscher's capacity law. The relative quality factor represents the low loss and high dielectric constant of a material. From Figure 6 we have seen that a higher relative quality factor is obtained for Mn free BST at the middle range of frequency where 20% Mn concentration materials show greater value at the primary range frequency. We also observed that BST for 10% and 30% Mn concentration, there is a stable condition of a relative quality factor.

Figure 6: Relative quality factor with frequency for various Ba0.7Sr0.3Ti1-x MnxO3 ceramics sintered at 1250℃ for 3 h.
Vibrating Sample Magnetometer (VSM)
Ba0.7Sr0.3Ti1-xMnxO3 ceramic’s magnetic measurement (hysteresis loop) was performed by Vibrating Sample Magnetometer (VSM) sintered at temperature 1250℃ in the range of magnetic field H=-10KOe to 10KOe. From the graph, we see that the magnetic properties increase with the Mn substitution. From the VSM measurements, magnetization versus magnetic field (M-H) curves are plotted for all samples as shown in Figure 7a. It was observed that magnetization of the prepared compositions sharply increased at the start of the applied magnetic field and saturated after a while. The formulated data from the M-H curve of Ba0.7Sr0.3Ti1-xMnxO3 ceramics are given in the tabular form in Table 3. Here, saturation magnetization, coercive field are calculated. The saturation magnetization, Ms were identified from the M-H curves of Ba0.7Sr0.3Ti1-xMnxO3 perovskites. The saturation magnetization is defined as the maximum possible magnetization of a material. The Ms increases from 0.085 emu/g to 7.25 emu/g with the increase in manganese content from 0.0 to 0.1 then decreasing up to 0.358 emu/g for Mn content of 0.2. The strengthening of AB exchange interactions since different types of exchange interactions between the unpaired electrons of two ions lying in A and B sites are available may increase the saturation magnetization. We know that A-B interaction heavily predominates over A-A and B-B interactions. The net magnetic moment of the overall lattice is the difference between the moments of B and A sub lattice i.e. M=MB-MA, where MA and MB are the magnetic moments of the A and B sites, respectively. A very strong field at which the domain switch their direction until the domains in one direction balance the domains in the opposite direction results in zero net polarization is called the magnetic coercive field. Figure 7 (b) illustrates the coercive field for Mn substitution. The coercive field is firstly increases with the Mn substitution then decreases. The higher coercive field is obtained for a 10% Mn concentration of 108.8 Oe. The lowest value is obtained for the parent sample.

Figure 7: a) Hysteresis of Ba0.7Sr0.3Ti1-xMnxO3 ceramics sintered at 1250℃ for 3 h and; b) Variation coercive field with Mn content.
| Sample | Saturation magnetization Ms (emu/g) | Coercive field, Hc (Oe) |
|---|---|---|
| Ba0.7Sr0.3TiO3 | 0.085 | 15 |
| Ba0.7Sr0.3Ti0.9 Mn0.1O3 | 0.725 | 108 |
| Ba0.7Sr0.3Ti0.8 Mn0.2O3 | 0.63 | 103 |
| Ba0.7Sr0.3Ti0.7 Mn0.3O3 | 0.358 | 56 |
Table 3: Variation of magnetic saturation, Ms and coercive field, Hc with Mn content.
Conclusion
Doping of Mn on barium strontium titanate expressed by the chemical formula Ba0.7Sr0.3Ti1-xMnxO3 where x=0.0-0.3 perovskites have been successfully prepared by conventional solid state reaction method. The samples were calcined at 750℃ and sintered at 1250℃ for structural, morphological, electrical and magnetic characterization. The XRD patterns and refinement results of the samples indicate that they crystallized as a tetragonal phase with the P4 mm space group. Xray density, bulk density, porosity, and lattice constant have been calculated from the XRD data. SEM data were used to determine average grain size which completely agreed with conductivity and dielectric behavior. Mn doped barium strontium titanate causes a significant change of the materials dielectric properties and indicates that 20% of Mn doping exhibit the highest dielectric constant with the stable condition at the high frequency range, however, the loss is also increased. The permeability result indicates that with the increase in Mn content the permeability is found to be increased. Consequently, it is suggested that 20% of Mn concentrated Ba0.7Sr0.3Ti1-xMnxO3 shows overall better electrical and magnetic properties than other samples.
Acknowledgements
This work is supported by the project offered by research and publication cell, university of Chittagong (No. 333/2021). The authors are thankful to the materials science division, atomic energy center, Dhaka 1000, Bangladesh, for extending their experimental facilities. The authors would also like to give thanks to the Bangladesh University of Engineering and Technology (BUET) for allowing us to use the Field Emission Scanning Electron Microscope (FESEM) facility.
References
- Vijatovic MM, Bobic JD, Stojanovic BD (2008) History and challenges of barium titanate: Part I. Sci Sinter 40: 155–165.
- Lu DY, Toda M, Sugano M (2006) High permittivity double rare earth doped barium titanate ceramics with diffuse phase transition. J Am Ceram Soc 89: 3112-3123.
- Dey SK, Majhi P, Horwitz JS, Kirchoefer SW, Kim WJ (2005) Microstructure evolution of pulsed laser deposited (Ba, Sr) TiO3 films on MgO for microwave applications. Int J Appl Ceram 2: 59-63.
- Lee T, Aksay IA (2001) Hierarchical structure-ferroelectricity relationships of barium titanate particles. Cryst Growth Des 1: 401-419.
- Zhu XN, Zhang W, Chen XM (2018) Enhanced dielectric and ferroelectric characteristics in Ca modified BaTiO3 ceramics. Aip Adv 3: 82125.
- Ismail FA, Osman RA, Idris MS (2016) Review on dielectric properties of rare earth doped barium titanate. AIP Publishing LLC. 1756: 090005
- Hao S, Fu D, Li J, Wang W, Shen B (2012) Preparation and characterization of Ag doped BaTiO3 conductive powders. Int J Inorg Chem 2011: 1-4.
- Kadira L, Elmesbahi A, Sayouri S (2016) Dielectric study of calcium doped barium titanate Ba1-xCaxTiO3 ceramics. Int J Phys Sci 11: 71-79.
- Lara JPH, Labra MP, Hernandez FR, Serrano JAR, Davila EOA, et al. (2017) Structural evolution and electrical properties of BaTiO3 doped with Gd 3+. Mater Res 20: 538-542.
- Das SK, Mishra RN, Roul BK (2014) Magnetic and ferroelectric properties of Ni doped BaTiO3. Solid State Commun 191: 19-24.
- Garcia-Hernandez M, Garcia-Murillo A, de J Carrillo-Romo F, Jaramillo-Vigueras D, Chadeyron G, et al. (2009) Eu-doped BaTiO3 powder and film from sol-gel process with polyvinylpyrrolidone additive. Int J Mol Sci 10: 4088-4101.
- Mishra A, Mishra N (2012) Iron-doped BaTiO3: Influence of iron on physical properties. Int J Mater Sci Appl 1: 14-21.
- Mahbub R, Fakhrul T, Islam MF (2013) Enhanced dielectric properties of tantalum oxide doped barium titanate based ceramic materials. Procedia Eng 56: 760-765.
- Mahbub R, Hossain MS, Islam MF (2013) Structural characteristics and dielectric properties of tantalum oxide doped barium titanate based materials. Mater Eng Inzinierstvo 20: 45-53.
- Srilakshmi C, Rao GM, Saraf R (2015) Effect of the nature of a transition metal dopant in BaTiO3 perovskite on the catalytic reduction of nitrobenzene. RSC Advances 5: 45965-45973.
- Jain A, Panwar AK, Jha AK (2017) Effect of ZnO doping on structural, dielectric, ferroelectric and piezoelectric properties of BaZrO1TiO9O3 ceramics. Ceram Int 43: 1948-1955.
- Wang HY, Ding FZ, Gu HW, Zhang HL, Dong ZB (2017) Microstructure and superconducting properties of (BaTiO3, Y2O3)-doped YBCO films under different firing temperatures. Rare Met 36: 37-41.
- Shingai Y, Abe T, Mukaida M, Kita R, Yoshida Y, et al. (2006) Improvement of superconducting properties by BaTiO3 doping into ErBa2Cu3O7-δ films. Phys C: Supercond Appl 445: 841-844.
- Zhang HL, Ding FZ, Gu HW, Dong ZB, Qu F, et al. (2016) Effect of Ba/Y molar ratio on superconducting properties of BaTiO3-doped YBa2Cu3 O 7-δ films. J Supercond Nov Magn 29: 1227-1232.
- Fernandez JF, Duran P, Moure C (1992) Microstructure and dielectric properties of BaTiO3 doped with niobium and cobalt. Ferroelectrics 127: 53-58.
Citation: Ahamed JU, Ahasan R, Abida F, Khan M (2023) Properties Elucidations of Mn-doped Ba0.7Sr0.3Ti1-xMnxO3 Ceramics. J Mater Sci Nanomater 7: 100.
Copyright: © 2023 Ahamed JU, et al. This is an open-access article distributed under the terms of the Creative Commons Attribution License, which permits unrestricted use, distribution and reproduction in any medium, provided the original author and source are credited.
Share This Article
Recommended Journals
Open Access Journals
Article Usage
- Total views: 989
- [From(publication date): 0-2023 - Apr 02, 2025]
- Breakdown by view type
- HTML page views: 773
- PDF downloads: 216