Research Article Open Access
Production, Purification and In-silico Characterization of Azoreductase Enzyme Azor1 KF803342 from Pluralibacter gergoviae Involved in Dye Degradation
| Megha K Purohit and Piyush V Desai* | |
| Department of Biosciences, Veer Narmad South Gujarat University, Surat, India | |
| Corresponding Author : | Piyush V Desai Department of Biosciences Veer Narmad South Gujarat University Gujarat, India Tel: +91 281-2586419 E-mail: piyushdesairj@yahoo.com/ meghapurohit@gmail.com |
| Received January 02, 2014; Accepted February 21, 2014; Published February 26, 2014 | |
| Citation: Purohit MK, Desai PV (2014) Production, Purification and In-silico Characterization of Azoreductase Enzyme Azor1 KF803342 from Pluralibacter gergoviae Involved in Dye Degradation. J Bioremed Biodeg 5:217. doi:10.4172/2155-6199.1000217 | |
| Copyright: © 2014 Purohit MK, et al. This is an open-a ccess article distributed under the terms of the Creative Commons Attribution License, which permits unrestricted use, distribution, and reproduction in any medium, provided the original author and source are credited. | |
Related article at Pubmed Pubmed  Scholar Google Scholar Google |
|
Visit for more related articles at Journal of Bioremediation & Biodegradation
Abstract
Azo dyes are a wide spread class of poorly biodegradable industrial pollutants.The process of optimization of degradative potential is certainly a challenging task for its industrial applicability. In our current studies; we tried to understand whether azoreductases enzyme plays a significant role in textile dye degradation process.
Optimization of media for maximum degradation by response surface methodologywould certainly boost cleanup of dye pollutants. Further, getting insight into the azoreductase enzyme properties of the enzyme by purification and insilico approaches would allow us to know the structural and functional properties of enzyme. The azoreductase gene isolated from Pluralibacter gergoviae was amplified and sequenced; it showed partial homology to an azoreductase identified in Cronobacter sp. The identity of the enzyme was confirmed by sequencing of azoreductase gene. The nucleotide sequence of enzyme was submitted to Gene bank, accession number-KF803342. The structure of azoreductase was modeled having four FMN binding site. This research provides insight into the use of response surface methodology to rapidly optimize dye biodegradation parameters.
| Keywords |
| Dye; Degradation; Methyl red; Azoreductase; RSM; Purification; In-silico |
| Introduction |
| Synthetic dyes are widely used in several industries such as textile, paper, printing, cosmetics, pharmaceuticals, color photographyand as an additive in petroleum industry [1-3]. Dyes are classified either on the basis of its structural characteristics, dyeing process or application [4]. The discharged textile effluent wastewater contains dyes and other toxic pollutants [4]. Industrial units involved in manufacturing and processing of dye products are the major cause of pollution resulting in serious health and environmental problems [3,5]. Many potentially hazardous organic compounds are continuously introduced with an exponential increase into various components of the environment [5]. On the basis of statistical data, it is observed that there are approx. 200+ major and several smaller scale textiles processing unit engaged in dyeing, printing and processing of garments in the proposed research area [6]. |
| Azo dyes are widely used in the textile processes because of their ease and cost effectiveness in synthesis compared to other dyes; they are toxic, carcinogenic, and mutagenic characterized by the presence of one or more azo group (-N=N-) [7]. It has become inevitable to develop novel bioremediation technologies in order to dilute the impact of pollution. They have become a great concern in effluent treatment due to their aesthetic and recalcitrant nature, potential toxicity to animals and humans [8]. |
| Optimization of degradative potential is a challenging task for its industrial applicability. The major conventional strategy used for optimal operating condition of a parameter is optimized by changing one parameter at a time and keeping the others at a constant level [6]. This method often does not yield reliable results, is laborious, time consuming and impractical. In this regard, RSM is a useful model for studying the effect of several factors by varying them simultaneously and carrying out a limited number of experiments [9,10]. |
| Among the enzymes used for degradation process, azoreductase has acquired good attention as they are favorable for the development of biodegradation systems and catalyze reductive cleavage of azo groups (-N=N-) under mild conditions [11]. Identification, purification and characterization of azoreductase constitute a straightforward approach for the development of azo dye biodegradation systems [12-14]. |
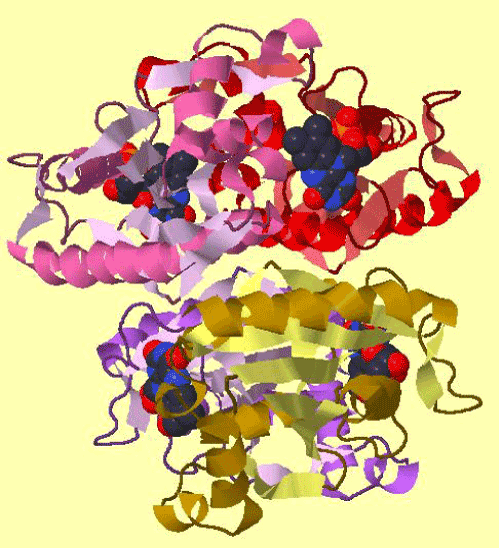
| We considered methyl red as a model for studying the degradative potential of Pluralibacter gergoviae, further process optimization for optimum degradation by RSM approach. Enzyme was purified to its homogeneity within a single step by phenyl sepharose 6FF. The nucleotide sequence showed partial homology with those of other azoreductase of biological origin. Further, amino acids were deduced and physiochemical attributes of azoreductases was predicted by in-silico analysis. Nucleotide sequence of azoreductase gene is submitted as CDS region of azoreductase gene-AzoR1 KF803342 spanning from sequence 22 to 562 positions. The structure of azoreductase was modeled having four FMN binding sites. |
| Materials and Methods |
| Sample collection |
| Highly colored textile effluent from a dye in gun it, GIDC, Surat, India, was collected for isolation of dye decolorizing bacteria and stored in sterile plastic bags and bottles at -4°C. Some physico-chemical parameters of effluent were measured viz., pH, color and temperature at the sample collection site. Further, chemical and biological properties of water were measured according the guideline of APHA [15]. |
| Dyes |
| Methyl Red (Sigma Aldrich) Molecular Formula: C15H15N3O2 with a molecular weight of 269.30 gm/mole; Density: 0.79 gm/cm3 was used for studies. Detailed information on this chemical entity is available on KEGG database- KEGG-C19459. Solutions of dyes had been prepared by dissolving each dye at the concentration of 100 mg/l in double D/W. |
| Bacterial strain |
| Dye degrading bacterial strain was previously isolated and screened in our lab under set conditions using Bushnell Haas (BH) agar medium (Hi Media, India) containing methyl dye at 200 mg l-1 concentration and incubated at 37°C. Isolate was identified by 16S rRNA as Pluralibacter gergoviae [6]. |
| Degradation analysis |
| P. gergoviae strain was analyzed for decolorization efficiency by inoculating in media supplemented with dye and medium without dye was used as a blank. At regular intervals of time, sample was withdrawn and absorbance was measured at 535 nm. Percent decolorization was calculated according to the formula given below. This procedure was carried out for 7 days, % Dye Decolorization= Initial Absorbance- Observed Absorbance× 100/ Observed Absorbance. Standardization and confirmation of degradation analysis was previously well studied by Butani [6]. |
| Response surface methodology (RSM) |
| This methodology consists of the Plackett -Burman design as the first optimization step, central composite design as a second step to optimize the factors that have significant effects, and response surface analysis. We selected Plackett-Burman design for the study on the interactions of different variables; concentrations of pH, agitation, incubation time and glucose were chosen as the critical variables and dye decolorization experiments were carried out [9,10]. |
| Plackett–Burman design |
| The medium components were screened for eleven variables at two levels; maximum and minimum using Plackett-Burman design. |
| The design and levels of each variable |
| The medium was formulated as per the design and the flask culture experiments on dye decolorization were assayed and the response was calculated as the rate of dye decolorization and expressed in percent. The effect of each variable was calculated using the following equation; E is the effect of tested variable, M+ and M- are responses (dye decolorization media optimization) of trials at which the parameter was at its higher and lower levels respectively and N is the number of experiments carried out. The standard error (SE) of the variables was the square root of variance and the significance level (p-value) of each variable was calculated by using Student’s t- test (E xi is the effect of the tested variable) [10]. |
| Optimization of concentrations of the selected variables using RSM |
| RSM approach was used to identify the optimum conditions for a multivariable system, and it can predict the combined effect of some variables. The screened medium components affecting dye decolorization were optimized using Central Composite Design (CCD) [11]. The statistical model was validated with respect to dye decolorization under the conditions predicted by the model in flask conditions. Samples were withdrawn at the desired intervals and dye decolorization was determined as described above. |
| Azoreductase Enzyme |
| Preparation of cell free extract |
| Pluralibacter gergoviae cells were grown and harvested by centrifugation at 10,000 rpm (4°C) for 15 min. Due to intracellular nature of enzyme, the cell pellet was resuspended in 10 ml of lysis buffer (10 mM Tris-HCl-pH 8, 1 mM EDTA, 10% Glycerol, 0.5% N-lauroyl sarcosine, 0.02 mg/ml RNAse A, and 0.25 mg/ml proteinase K) and subjected to sonication at output of 70% amplitude for 8 cycles, each cycle of 30 sec and similar time interval was kept between each cycle at 4°C. |
| Enzyme and protein determination |
| Azoreductase activity was assayed by measuring the decrease in optical density at 535 nm (Shimadzu,UK). The reaction mixture (2 ml) contained 25 mM potassium phosphate buffer (pH 7.5), 25 μM azo dye, 1 mM NADPH and a suitable amount of enzyme [16]. The reaction was initiated by addition of the enzyme. Further, role of different co-factors were analyzed to determine the optimum enzyme activity; co-factors used were NADH, NADPH, NADPH+riboflavin, NADPH+NAD. One unit (U) of enzyme activity was defined as the amount of enzyme required to degrade one mmol azo dye per minute. Proteins were quantified by Bradford method (1976), using BSA (10 μg/ml) as a standard (4-20 μg/ml). |
| Purification and Characterization |
| One-step purification by hydrophobic interaction chromatography |
| Purification was achieved by a single step purification method using hydrophobic interaction chromatography; phenyl sepharose 6 FF column (1 cm × 6.5 cm), equilibrated with 0.1 M sodium phosphate buffer (pH 7.5) containing 1 M ammonium sulfate. The crude azoreductase preparation (20.0 ml in 1M ammonium sulfate) was loaded onto this column and the bound enzyme was eluted by 0.1 M sodium phosphate buffer, pH 7.5 containing decreasing ammonium sulfate (1M, 0.5M, 0.2M and 0.1M). Fractions at a flow rate of 0.7 ml min−1 were collected by fraction collector (BIO-RAD, California, USA) and analyzed for azoreductase activity. The protein and enzyme content were measured according to the method as described earlier. The purity of the enzyme was judged on SDS-PAGE. The active fractions were pooled and used for further characterization. |
| SDS-Polyacrylamide gel electrophoresis |
| SDS-PAGE was carried out according to the method of Laemmli using 12% cross linked polyacrylamide gel. The status of purity and molecular weight was determined with reference to molecular weight marker (Broad Range Marker, Merck Life sciences). |
| Amplification of azoreductase gene |
| To amplify the azoreductase gene, genomic DNA was isolated from P. gergoviae cells by enzymatic method and used as template. A set of the forward, AzoF-5’-ATGAAACTAGTCGTTATTAAC-3’ and reverse, AzoR- 5’ TCACTCCACTCCTAGTTGTTT-3’ (Xcleris Life Science, India), primers were designed on the basis of the conserved sequences of the azoreductases enzyme. PCR was performed in a gradient thermocycler (Eppendorf) with he conditions: [95°C×5 mins]×1, [95°C×1 mins/50°C×45s/and 72°Cx1 min]×30,[72°C×1 min]× 5 min] × 1, [95°C × 1 min/50°C × 45 s/and 72°C × 1 min] ×30, [72°C × 1 min] × 1, using 100 ng of DNA as the template, 25 pmol of forward and reverse oligonucleotides primer, 25 μl of 2× Red Mix Plus (Merk, Life Sciences). Sequencing of amplicon was done by using azo reductase specific primer using Sanger sequencing (Xcleris Life Science, India). Sequenced was identified and phylogentically align by Mega 5.2 [17]. |
| In-silco analysis |
| Primary and secondary structural properties of enzyme were studied by using Expasy and NCBI tools. The secondary structure configuration of amino acid sequence was predicted by JPred [18]. A phylogenetic tree was constructed by N-J method clustering strategy in Mega 5.2. |
| Homology modeling |
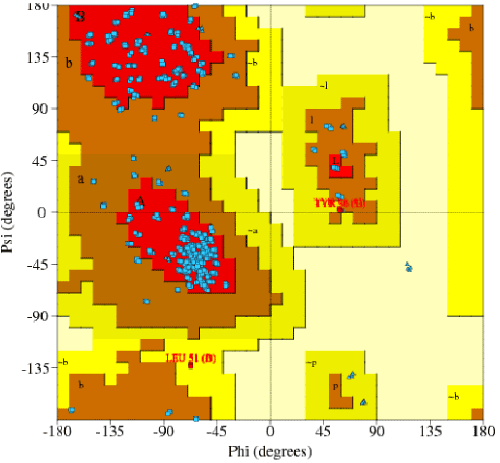
| Amino acid sequence without signal peptide was used for homology modeling. SWISS MODEL workspace server was used to identify the template and model building (http://swissmodel.expasy.org/workspace). Py MOL software was used for analyzing the model (http://www.expasy.ch/swissmod/SWISSMODEL.html).The stability of in-silico structures were predicted by Ramachandran plot-PRO CHECK [19]. |
| Prediction of azoreductase accessory proteins |
| The sequence of the azoreductase enzyme were retrieved from National Centre for Biotechnology Information protein database at http://www.ncbi.nlm.nih.gov/protein from Pluralibacter sp. Confidence interval map of azoreductase accessory proteins with undefined function and structure were analyzed from STRING 9.1 http://stringdb.org/ [20]. |
| Result and Discussion |
| Isolation and screening studies for degradation analysis |
| Bacterial strain was isolated from textile industrial effluent site (21.17oN, 72.83oE). Isolate was screened and maintained on Busnell and Haas agar medium (Hi Media, India) without the addition of any carbon and nitrogen sources. They showed the ability to grow after 24 h of incubation at 37°C. Dye was added as sole source of carbon and nitrogen to BH medium at concentration of 200 mg l-1. Screening results for decolorization was done under two different conditions, aerobic and facultative anaerobic conditions. The results indicate that the strain is capable of decolorizing the dye up to 93% in 7 days. On the basis of 16S rRNA analysis, the phylogenetic tree was constructed by MEGA5.2 displaying most closely relatedness to E. gergoviae. Further, according to taxonomic evaluation of the genus Enterobacter based on the basis of multilocus sequence analysis it is designated as P. gergoviae [21]. |
| RSM approach |
| Optimization of bioprocess variables using RSM and factorial design for effective degradation: Plackett-Burman design, an efficient way to optimize bioprocess variable. Dye decolorization was investigated in 12 runs (Table 1). They were identified and selected for further optimization on the basis of preliminary studies. With reference to the selected variables, the corresponding response for dye decolorization was highly variable. The number of positive and negative signs per trial was (k+1)/2 and (k– 2)/2, respectively. Plackett-Burman design was constructed to determine the nutritional requirements. Among the variables screened, the most influencing factors for decolorization with high significance level were seven parameters (A -G) namely pH, temperature(°C), agitation (rpm), incubation time (hrs), dye concentration (%), glucose and peptone (%).In the present study, statistical analysis demonstrates that the model F value of 0.75 is significant. The values of p < 0.05 indicate model terms are significant. The results and first order polynomial equation was derived representing dye decolorization (Methyl Red) as a function of the independent variables, its magnitude indicates the level of significance of the variable on decolorization of methyl red (Table 2). Consequently, statistically significant variables with positive effect were further investigated to find the optimal range of these variables. |
| Central composite design (CCD) |
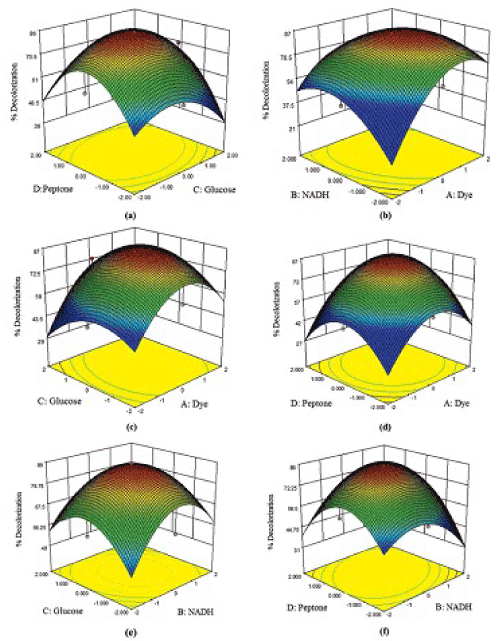
| The results of 30 run CCD in four variables; pH, agitation, incubation time and glucose, chosen for optimization of dye decolorization process by P. gergoviae. Decolorization varied markedly with the conditions tested, in the range of 0-99.8%. Lowest decolorization was observed when agitation was high with low pH value (run 4, 14 and 20). Decolorization value of 99.8% was observed at pH 6, agitation of 50 rpm, incubation time of 36 h and glucose of 1.0 g/L (run 29). The experimental results suggest that these variables strongly affect the decolorization process. The results obtained were subjected to analysis of variance with the regression model given as: Y = 95.62 + 2.09 A -4.43 B -3.77 C -4.82 D + 3.25 AB + 2.19 AC -6.42 A D -0.36 BC + 1.88 B D + 4.06C D -31.15 A2 -14.40 B2 -6.75 C2 -7.74 D2; where, Y is the response value (% decolorization) and A, B, C and D are the coded levels of pH, agitation, incubation time and glucose concentration, respectively. Interaction effects and optimal levels of the variables were determined by plotting the response surface contour plots (Figure 1) which showed the behavior of response (% decolorization) with respect to simultaneous change in two variables. |
| Response surface three-dimensional (3D) plots of the influencing variables that influence the dye decolorization activity are given in Figure 1a–1f. The interaction between the variables on dye decolorization has been observed form the 3D plots (Figure 2). Maximal decolorization was achieved at the coded value of 1.0, 0.15, 0.14, and 0.22 for the variables dye, NADH, glucose, and peptone concentrations respectively. |
| Enzymatic studies |
| Effect of co-factors on enzyme activity: In present study, azo reductase assay was initially standardized using different co-factors. Activity of crude enzyme preparation was checked in presence of NADH; presence of NADPH. Further effect of FMN and FAD was checked on NADH and NADPH. NADPH was of independent nature and activity of enzyme was either maintained or partially enhanced in the presence of FMN/FAD. |
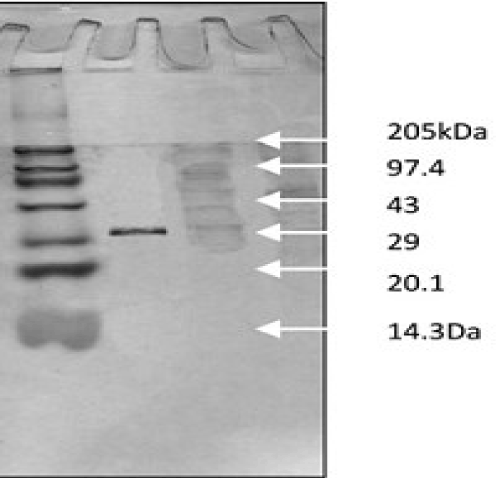
| Purification of azo reductase by one-step method: Hydrophobic interaction chromatography has been a successful technique for the purification of many degradative/hydrolytic enzymes [22]. The purification led to 23.75 fold purification with a yield of 29% for azo reductase enzyme. The purification was achieved with specific activities of 24600 (U/mg) by single step on phenyl sepharose 6 FF affinity column (Table 3 and Figure 2). |
| In-silico analysis |
| The amplification and sequencing of azoreductase gene confirmed of 1195 bp and submitted to gene bank with accession number KF803342 Azoreductase enzyme’s protein similarity and phylogenetic analysis was carried out by using n BLAST p (prediction of protein sequence by submitting nucleotide sequence as a query) to identify the protein (Figure 3). The complete ORF of the azoreductase gene commenced with the start codon AUG and concluded with a stop codon TAA at the respective termini. Predicted N-terminal sequence of P. gergoviae is MKLVVINGTPRKFGRT. A 100% homology of the sequences was found with known azoreductase gene of Cronobacter sp. Estimated theoretical PI is 5. The instability index (II) was computed as 29.30. Other properties, as aliphatic index and grand average of hydropathicity (GRAVY) were 60.60 and 0.011. Further,total numbers of negatively and positively charged residues were ~30 and ~40 respectively. The calculated mass of the enzymes were approximately 29-–30 kDa (Figure 2). On the basis of the Ramachandran analysis, as majority of sequences lies in the core region, we can predict that structure of enzyme is quite stable, a fact also reflected by structural determination (Figure 4). The presence of the secretion signals were analyzed using Predi Si Signal peptide prediction tool. A specific distribution of the α-helix and β-sheets in the secondary structure of enzyme was predicted by using J pred. As a model, we analyzed the distribution of the amino acids and position of the N and C- terminal by using Py Mol; four binding pockets for FMN cofactor are marked on 3D structure (Figure 5). |
| Identification of accessory proteins |
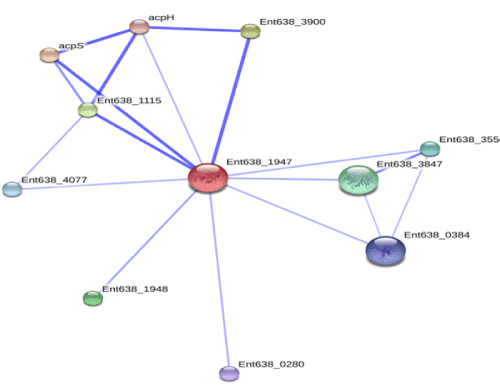
| Knowledge of important accessory proteins in degradation pathways enables identification of appropriate targets and co-targets. Further, predicting the docking output can propose transcription regulator and other important proteins involved in substrate specification and xenobiotics degradation which can be considered for targeting azo dye degradation pathway (Figure 6). The accessory proteins were studied from Enterobacter 638 azoreductase, which interacts with other proteins that contribute to its functional attributes. The enzyme is interacting with accessory proteins; acyl carrier protein synthase, acpS 4'-phosphopantetheinyl transferase; transfers -2 subunits the 4'-phosphopantetheine moiety from coenzyme, ATP-dependent RNA helicase HrpA, glycoside hydrolase, clan GH-D, abundant cell division factor, fusaric acid resistance protein region, flavodoxin FldB, enterobactin exporter EntS, diguanylate cyclase (Figure 6). The complete profile of degradation pathway on the basis of current studies could be further inferred by KEGG pathway. Several, accessory proteins required for expression of azoreductase enzyme were determined and specific pattern of its interaction within them could also be studied. Overall, this identification is based on various criteria; co-localization in one or more genomes, co-occurrence across genomes (phylogenetic profiling), and, could also be further correlated with expression data and / or literature citations. |
| Prediction of relatedness among different known azoreductase enzyme |
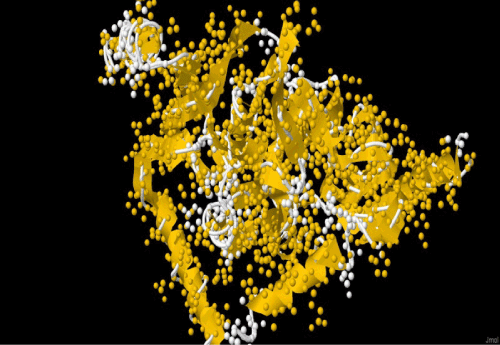
| The comparison of super imposed tertiary structures (3D) of azoreductase genes of P. gergoviae and azo reductase of Enterobacter 638 shows close relationship and a high degree of similarity between the azo reductases (Figure 7). Further, azoR1 gene was phylogenetically aligned with other known azo-reductases from different species (Pseudomonas, Xanthomonas, Acideovorax, Novaspingovbium, Caulobacter, Salmonella, Klebiesella, Mycoplasm and Bacillus) by neighbor joining (NJ) method, using Mega 5.2. The enzyme sequences were quite diverse in its sequence similarity; they were more closely related to azoreductase sequences of Coronobacter sp. and Klebsiella sp. (Figure 3). |
| On the basis of our studies on azoreductase enzyme; we were able to understand that enzyme plays a significant role in degradation of methyl red. Optimization of media for maximum degradation by RSM could certainly boost the bioremediation process. |
| Furthermore, gaining insight into the enzymatic properties by purification and characterization could allow us to know the structural and functional properties of the enzyme [23]. The survival kits that they use could be of great significance to us in developing new catalytic potential for degrading non-degradable pollutants. Implementation of efficacious bioremediation strategies relies heavily on innate microbial community dynamics, structure and function. |
| Acknowledgements |
| Dr. Megha Purohit is a recipient of Research Associate ship (RA) awarded by the Department of Biotechnology (DBT), New Delhi, India and coordinated by Department of Biochemistry, IISc, Bangalore, India. She is thankful to Veer Narmad South Gujarat University for supporting her scientific endeavors as a host institute. Authors are thankful to Dr. Butani for providing preliminary results supporting her work. |
References
|
Tables and Figures at a glance
| Table 1 | Table 2 | Table 3 |
Figures at a glance
 |
 |
 |
 |
| Figure 1 | Figure 2 | Figure 3 | Figure 4 |
 |
 |
 |
| Figure 5 | Figure 6 | Figure 7 |
Relevant Topics
- Anaerobic Biodegradation
- Biodegradable Balloons
- Biodegradable Confetti
- Biodegradable Diapers
- Biodegradable Plastics
- Biodegradable Sunscreen
- Biodegradation
- Bioremediation Bacteria
- Bioremediation Oil Spills
- Bioremediation Plants
- Bioremediation Products
- Ex Situ Bioremediation
- Heavy Metal Bioremediation
- In Situ Bioremediation
- Mycoremediation
- Non Biodegradable
- Phytoremediation
- Sewage Water Treatment
- Soil Bioremediation
- Types of Upwelling
- Waste Degredation
- Xenobiotics
Recommended Journals
Article Tools
Article Usage
- Total views: 15127
- [From(publication date):
February-2014 - Apr 04, 2025] - Breakdown by view type
- HTML page views : 10374
- PDF downloads : 4753
