Production Expansion and Comparative Advantage of Upland Rice Production and its Effect on the Local Farming Systems: The Case of Guraferda District, Southwest Ethiopia
Received: 07-Jul-2018 / Accepted Date: 04-Sep-2018 / Published Date: 15-Sep-2018 DOI: 10.4172/2329-8863.1000395
Keywords: Cost benefit analysis; Farm households; Rice production; Rural livelihood
Introduction
Ethiopian economy is mainly based on agriculture from which nearly 46% of GDP, 83% of employment, and nearly 80% of foreign export earnings was obtained. The country’s agricultural sector is characterized by small-scale production and 90-95% of agricultural output comes from 14.2 small-scale subsistence household owning, on average, about 0.89 ha of land [1].
Rice is produced worldwide and is the primary staple crop for more than half of the world’s population and its farming is about 10,000 years old. It has fed more people for longer and extended time than has any other crop done. It is being produced in a wide range of locations and under a variety of climatic conditions on more than 144 million farms worldwide in. Rice is cultivated on every continent except Antarctica [2]. Although rice has been grown in many East and Southern African countries for more than 500 years, it has only been in the last two decades that consumption has increased significantly.
In Ethiopia, potential/suitable rice growing area is estimated to be about thirty million hectares and it remains as a minor crop in Ethiopian Agriculture [3]. According to Dawit [4], in Ethiopia, rice is predominantly grown in West central highlands of Amhara Region, North West lowland areas of Amhara and Benshangul Regions, Gameblla regional state, South and South West Lowlands of SNNPR (Southern Nations Nationalities and Peoples Region), Somali Region and, South Western Highlands of Oromia Region.
Despite the country’s immense potential for rice crop, its production, productivity and expansion has been challenged by lack of improved varieties, lack of recommended crop management practices, lack of pre and post-harvest management technologies and lack of awareness on its utilization [5,6]. As a result, its yield remains progressively low with average national productivity of 28 qt ha-1 [7], which is very much lower than the average yield of rice in the world that accounts 45 qt ha-1. Following this rice expansion and lack of improved technologies, the demand for improved rice technologies is increasing from time to time from different stakeholders [3]. The government of Ethiopia considered rice as the most strategic food security crop that has got special attention in promotion of agricultural production and productivity improvement as it is named as the “millennium crop” expected to contribute in ensuring food security in a country [8].
Guraferda district (SNNPR) has a well-suited agroecology for production of major crops like rice, maize, sorghum, coffee, sesame, ground nut and livestock husbandry. In the district, rice production was started 17 years ago, and currently more than 5500 ha of land is covered by the crop annually in a production season [9]. As a result, it is being considered as a major cash crop and sustaining food security for farmer households. However, increasing production and productivity have been hampered by several problems. Therefore, in order to identify problems, major intervention areas for the future and to get competitive advantage from the development commodity, clear picture of production trend, comparative advantage and its impact on local farming system should be known. Since no study had been undertaken in the area, there was lack of profound assessment works on the gaps of the crop. Therefore, the study was executed with the objectives of assessing rice production expansion, its effect on local farming systems and its comparative advantage over other competent and complementary crops.
Methodology
Description of the study area
The study was undertaken in Guraferda district of Bench Maji zone, south west Ethiopia. Agriculture forms the major lifeline in the district. Crops growing in the area include rice, sorghum, maize, sesame, coffee, ground nut, spices like, pepper and ginger. Furthermore, fruits such as orange, mango, papaya, and vegetables like banana, potato, cabbages are among agricultural products. Rice, sorghum, maize and coffee are grown in a larger extent. The climate is very conducive for crop production. The temperature does rise up to 30°C. Annually the area receives 2,725 mm rainfall that spread over six months in a year mostly from south-west monsoon. However, it is supplemented by the cyclonic rains during November and December. The district is blessed with topographic and climatic conditions suitable for rice and another crop production [9].
Sampling techniques and sample size determination
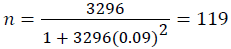
Two-stage sampling was employed to determine appropriate sample size. In the first stage four Kebeles were selected randomly as they represent the district. In the second stage by taking the list of rice producing household heads in the district, representative sample size was determined using the formula which was developed by Yamane [10].
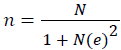
Where, n is sample size; N is target population, and e is level of precision. Based on this formula, by assuming level of precision 9%, and given number of total rice producer households in the district, sample size was estimated to be about 119.
Representative sample size from each kebele/villages were determined based on probability proportion to size of rice producer households in each kebele/villages.
Data sources and methods of collection
In this study, both primary and secondary data sources were used to gather necessary data regarding the demographic and socio-economic profile of smallholder rice producers and situations of rice production system. Structured questionnaire was used to generate the primary data from the selected sample smallholder rice producers. The primary data was collected from the selected sample respondents and focus group discussions (FGDs) and key informants interview also used to gather necessary information to supplement data collected from selected respondents. Secondary data was obtained from published and unpublished documents of different organizations including district Office of Agriculture, Non-Governmental Organizations (NGOs) and Central Statistical Authority (CSA).
Data analysis
The sample respondents’ demographic and socio-economic conditions as well as rice and other major crops production and marketing situations analyzed using descriptive statistics like mean, standard deviations, frequency and percentage by using Statistical Package for Social Science (SPSS). Cost benefit analysis for major crops grown in the area was carried out for doing comparative advantage of rice production analysis as specified below.

Where, GR=Gross revenue from crop production, TC=Total cost of crop production, P=Price of crop produce, Q=Quantity of crop produced, Pi=Price of ith input and Qi=quantity of ith input used for crop production.
Results and Discussion
Household characteristics
Sex, marital status and education level: The result reveals that, 87.4% of the respondents were male headed and 12.6% were female headed. 86.6% of the respondents were married, 7.5% were divorced and 6.7% were widowed. From the respondents 58% of were unable to read and write (illiterate), 15% were able to read and write having learned up to grade fourth, 16% attained primary education level and only 10.9% achieved junior education level (Table 1).
| Variables | Frequency | Percent | |
|---|---|---|---|
| Sex | Male | 104 | 87.4 |
| Female | 15 | 12.6 | |
| Total | 119 | 100.0 | |
| Marital status | Married | 103 | 86.6 |
| Divorced | 6 | 5 | |
| Widow | 10 | 8.4 | |
| Total | 119 | 100.0 | |
| Education level | Illiterate | 69 | 58.0 |
| Read and write | 18 | 15.1 | |
| Primary | 19 | 16.0 | |
| Junior | 73 | 10.9 | |
| Total | 119 | 100.0 |
Table 1: Sex, marital status and education level. Source: own survey results 2015.
Age and family size: Average age of the respondents is 46.9 years with the youngest 26 years and the eldest is 74 years, implying most of farmers were in working age. Most of respondents said they were engaged only in farm activity and few farmers participate in off farm activities like trading grain. Farmers in the area got their income mainly from rice production and to some extent from coffee as seeing rice as major cash crop. Average annual income of the respondents is 20,983 birrs, with highest income level is 60,000 ETB (Ethiopian Birr) and smallest one is 2000 ETB (Table 2).
| Variables | Minimum | Maximum | Mean | Std. Deviation |
|---|---|---|---|---|
| Age | 26 | 74 | 46.9 | 10.35 |
| Family Size | 2 | 12 | 6.13 | 2.017 |
| Annual Income (ETB) | 2000 | 60000 | 20983.19 | 11942.89 |
Table 2: Age, family size, and annual income of the respondents. Source: own survey result (2015).
Livestock ownership: According to perception of farmers, who participated in focus group discussion, farming system of the area was very well-suited for livestock production, but disease and rustling problem were major constraints in the area. Most of farmers used to own oxen, mainly for land preparation purpose for short period of time and sale them after land preparation have been done because of the rustling problem and disease occurrence (Table 3). Farmers do rice field land preparation by oxen plough from one to three times and for this reason most of farmers have their own oxen. Despite the area have better opportunity for livestock production regarding availability of feed for animals the above-mentioned problems were hindering smallholder farmers from being benefited from the sector.
| Type | Mean | Min | Max | Std. Deviation |
|---|---|---|---|---|
| Oxen | 1.41 | 0 | 4 | 0.800 |
| Cow | 0.77 | 0 | 3 | 0.870 |
| Bull | 0.46 | 0 | 2 | 0.615 |
| Heifer | 0.39 | 0 | 2 | 0.596 |
| Sheep | 0.46 | 0 | 3 | 0.762 |
| Goat | 0.98 | 0 | 5 | 1.37 |
| Poultry | 3.59 | 0 | 10 | 3.02 |
Table 3: Livestock ownership. Source: Own survey result (2015).
Major crops production, consumption and marketing
Rice is produced in wider proportion of land than other crops. On average, in the farm household 1.05 ha of land is covered by rice. All of the respondents were used to produce rice. According to the data obtained from agricultural office of the district, in 2014/15 production season more than 6000 ha of land was covered by rice. Rice was being produced by farmers primarily for market purpose and nearly 70% of the product was supplied to the market and which makes it higher than maize and sorghum which account 51 and 41%, respectively.
According to farmers’ response, lower market price of maize hindered them not to supply the product to the market and most of the product was being used for consumption purpose. The impact was higher in areas located far from main road and sometimes farmers use it even as animal feed when the price become very low. Sorghum was produced in on average 0.34 of land per farmer in the production season. Rice was produced mainly for selling purpose than other crops. Coffee was another major cash crop in the district with average land coverage of 0.29 ha per household. Coffee plantation was being increasing in the area, thus most of farmers have their own new plantation coffee farms which did not start giving yield (Table 4).
| Crop | Mean | Maximum | Std. Deviation | |
|---|---|---|---|---|
| Rice | Area (ha) | 0.99 | 3.00 | 0.563 |
| Production (qt) | 28.06 | 83.00 | 16.05 | |
| Consumption (qt) | 9.43 | 20.00 | 3.945 | |
| Sale (qt) | 19.13 | 75.00 | 14.895 | |
| Sorghum | Area(ha) | 0.34 | 1.00 | 0.231 |
| Production (qt) | 9.15 | 42.00 | 7.948 | |
| Sale (qt) | 3.8 | 27.00 | 5.543 | |
| Maize | Area(ha) | 0.35 | 1.00 | 0.253 |
| Production (qt) | 12.73 | 60.00 | 11.598 | |
| Sale (qt) | 6.53 | 42.00 | 8.01 | |
| Coffee | Area(ha) | 0.29 | 1.00 | 0.327 |
| Production (qt) | 1.83 | 11.00 | 2.789 | |
| Sale (qt) | 1.75 | 11.00 | 2.620 |
Table 4: Major crops production (2015). Source: Own survey result, (2015).
Over view of rice production (2012-2014)
In Guraferda district, rice was being produced in 19 kebeles and from these 17 kebeles produce it as major crop [9]. According to the data collected from respondents, in the district rice production was started in 2006 in some farms and later in 2014 it was observed on most farmers’ fields as major crop. Now days its production has got high attention as compared to other major crops produced in the district. Even though rice is a new crop to the area, its production was expanded considerably and now days its production seems long stayed popular culture (Figure 1).

Figure 1: Over view of rice production, consumption and sell (2012-2014). Source: own computation (2015).
Cultivated area
Most of the farmers in the Guraferda district produce rice. Despite area of production vary from farmers to farmers, the average cropped area per rice producer was 0.84, 0.87 and 1 hectares in 2012, 2013, and 2014 cropping season, respectively. Even though it was a new crop to the area, still there is continuous and quick expansion of rice production. Some farmers told that they have started rice production lately after observing other benefited farmers, especially when it had got attention and better market price have been created. Now days, the number of farmers producing rice have been increased and new farmers have started rice production. Additional land was allocated for rice and as result total land coverage of the crop was increasing (Figure 1).
Production and productivity
Prior research findings showed that, volume of rice production in Ethiopia is also on moving with the national average productivity rise of 1.8 tons per hectare to 2.8 ton per hectare at on-farm level [11]. However, findings in this study revealed that, productivity have been declined for the last three years. As shown in the figure below, average rice productivity per hectare is 32 q/l, 30 q/l and 28.67 q/l in the years 2012, 2013 and 2014 year, respectively (Figure 1). According to farmers’ response, the total amount of paddy rice has been declining time to time. Farmers pointed out the reason that causes the problem is disease locally known as Mich which caused the grains unfilled. In addition, shortage of rain falls at critical rice growing periods, lack of improved rice varieties and weak farmers soil and crop management practices.
To have increased productivity it is essential to adopt improved technologies like using disease resistant improved rice varieties, recommended rate and application time of fertilizer, improved crop management practices, frequent and effective extension support. But the experience of farmers with these factors was weak and that resulted in declining productivity for those consecutive years.
Consumption and market supply
Annually 9 qt ha-1 rice was consumed at household level. Rice milling machine availability in district helped farmers to consume rice as one of major crop product. It was clear that rice production was in better market-oriented way than other crops and all producers used to supply the product to the market. The average quantity of paddy sold per household was on average 17.7, 18, 8.97 qt in 2012, 2013 and 2014, respectively. This shows that it was higher than when it is compared with a report from Metema district where annual production, consumption and sale of 12.11, 8.53, 4.21 qt at household level, respectively [12].
Participant farmers mentioned that price for paddy have been improved for these consecutive years as compared to what had been before, but still they insist it should be improved well enough to be fair price. Farmers sold their paddy rice to grain traders who were sitting in villages at kebele or district level without value addition activities, like selling milled rice not practiced. Since paddy rice is not that much affected by weevil like maize and sorghum in the area, most of farmers store rice for months and sale their product for local collectors or whole sellers in the time when they need money for expenses at prevailing price whether it was low or high.
Use of improved rice production technologies
Use of inorganic fertilizer: Agricultural production and fertilizer application are mutually related things which cannot be divorced. Fertilizer application harmonized with improved seed use and crop management is the key driver to agricultural production as it is critical in improving agricultural production and productivity through nutrient loss replacement on farmers’ fields. The experience of farmers using/applying inorganic fertilizer for rice was weak as few farmers from the respondents used it and those farmers also used small amount of fertilizer that was seemingly below the recommended rate as its application rate varying from farmers to farmers. As shown in Table 5, only 31.9% of respondents applied inorganic fertilizer in 2014 production season. Some farmers face problems like lack knowledge of exact rate and time of application during using inorganic fertilizer. Some farmers told that they do not believe as there is an additional rice yield gained even as they apply inorganic fertilizer and due to this reason, they hesitate to use it. If this is the case, it might be difficult to recover fertilizer cost from additional yield from the rice due to inorganic fertilizer application. In the area, most of rice farmers use local variety. The farmers’ opinion coincides with some literatures showing that most of the older varieties have long duration, taking 140-160 days to mature, and they do not respond well to the addition of fertilizer [2]. However, some farmers who adopted new rice varieties like NERICA-4 and SUPARICA-1 varieties started to apply inorganic fertilizer in better condition than those farmers who were using local variety.
| Year | Did you use inorganic fertilizer? (N=119) | Did you use herbicide? (N=119) | Did you use improved variety? (N=119) | |||
|---|---|---|---|---|---|---|
| Yes | Percent | Yes | Percent | Yes | Percent | |
| 2014 | 38 | 31.93 | 105 | 88.2 | 19 | 16 |
| 2013 | 24 | 20.2 | 103 | 86.6 | 18 | 15.1 |
| 2012 | 9 | 7.6 | 104 | 87.4 | 11 | 9.2 |
Table 5: Use of improved rice production technologies. Own survey result (2015).
Use of herbicide: In the study area, nearly all respondent farmers used herbicides, namely 2-4-D for the rice cultivation and 88.2% respondents used it in 2015 (Table 5). Major weeds in the area are Mimosa invisa , Amaranthus species, Galinsonga palviflora , etc. In most of farmers’ field Mimosa invisa and Amaranthus species were major weeds that were spread widely and affecting rice yield.
Most of farmers let Mimosa invisa weed grown on their field at off season as they believe its invasion reduces the invasion of other weeds and increases soil fertility. This would be related with a profound effect of the plant that enhance organic matter status of the soil [13]. During land preparation time weeds are cleared and burned before land was being ploughed. However, this could not reduce the invasion of rice fields by Mimosa weed because the weed grows from soil seed bank and not affected by a 2-4 D herbicide application, with which most farmers were familiar. Farmer’s use of 2-4 D herbicide depends on the type and intensity of weed on rice field, labor availability and amount of rice land cultivated. If more land covered with rice and household faces labor shortage for timely hand weeding, they use 2-4 D to retarded growth and intensity of weed until first hand weeding was done.
Use of improved rice varieties: The practice of using improved rice varieties was poor, only 16 % of respondents have used new varieties (NERICA-4 and SUPARICA-1) other than using long stayed local variety (Table 6). Non-government organization in the district with agricultural office and Bonga Agricultural Research Center support farmers by supplying new improved rice varieties, but most of farmers were using local variety which they named locally Nech ruz, introduced to the area by farmers themselves.
| Year | Did you use inorganic fertilizer? (N=119) | Did you use herbicide? (N=119) | Did you use improved variety? (N=119) | |||
|---|---|---|---|---|---|---|
| Yes | Percent | Yes | Percent | Yes | Percent | |
| 2014 | 38 | 31.93 | 105 | 88.2 | 19 | 16 |
| 2013 | 24 | 20.2 | 103 | 86.6 | 18 | 15.1 |
| 2012 | 9 | 7.6 | 104 | 87.4 | 11 | 9.2 |
Table 6: Use of improved rice production technologies. Own survey result (2015).
According to farmers’ response, improved varieties like NERICA 4 have better yield and early maturity time advantage over the local one; as also said by Afework [14]. However, its’ difficulty to thresh immediately after harvest and short heighted characteristic as compared with some weed’s types (Mimosa invisa) in some farmers’ fields in the area made it difficult to be adopted by some farmers. Due to these reason farmers mostly use local variety, but it lacks quality in relation with its grains. According to a result reported by Alemayehu [15] those improved varieties have adapted well and scored higher yield in the area. Even though farmers are seeking additional varieties, efforts are needed to use available varieties. Land preparation, major weeds management and promoting threshing materials for those improved varieties are necessarily needed.
Access to credit and extension contact: Farmers need efficient agricultural extension information to enable them to produce efficiently and increase rice production with existing technology level. About 28.6% of farmers told as they have had no contact with extension regarding rice production while 11.2% have weekly contact, 12.7% contact by in two weeks, 47.5% contact by monthly and 15% mate twice in the year with extension experts. During focus group discussion and survey data collection, most farmers said that extension service provision is related with seemingly forced fertilizer application oriented rather than focusing on improved crop management practices and supply of improved and high yielding rice varieties.
The survey result showed that, in addition to informal lending systems the farmers in the area have access for credit services from Omo Micro Finance institution, even though the participation is minimal. Farmers need credit when they face financial shortage for buying agricultural inputs (seed, fertilizer, herbicide and oxen), schooling cost, payment of wage for rice production particularly at weeding time and other costs they need. Farmers need for credit has been increasing from year to year as most of farmers mentioned in focus group discussion. However, the number of farmers taking the credit was lower as compared to those who need it. As some farmers who were in need of credit but did not take credit from formal institutions told they left because they were afraid of risk associated with it to take credit and grouping system inconvenience to borrow money. Some farmers did not take credit because of the religious reason preventing money borrowing. In addition to formal financial institutions, farmers use informal sources like relatives, friends and rice traders (Table 7).
| Do you have access? | Yes (N=119) | Percent | Std. Deviation |
|---|---|---|---|
| Credit use | 33 | 27.7 | 0.45 |
| Extension contact | 85 | 71.4 | 0.45 |
Table 7: Access to credit and extension contact. Source: Own survey result (2015).
Access to market and development center: It is not controversial that access for market and other infrastructures including development centers are necessary for agricultural production and marketing efficiency. Farmers in the area have access to nearby market centers on average at 9.3 Km and with maximum of 18 Km walking distance. Farmers can buy agricultural inputs and sell the produce in market either at district level, village level or farm gate market. Farmers walk on average 4.7 Km to find development center (Table 8).
| Variable | Minimum | Maximum | Mean | Std. Deviation |
|---|---|---|---|---|
| Distance to market (Km) | 1 | 18 | 9.3 | 3.5 |
| Distance to development center (Km) | 1 | 9 | 4.7 | 2.27 |
Table 8: Access to market and development center. Source: Own survey result (2015).
Contribution of rice production: Rice is produced in the Guraferda area as major cash crop. Farmer’s livelihood has been primarily based on income from the crop. Motives of farmers behind rice production have been described trough the contribution of the crop to farmers’ livelihood. During survey time, it was understood that the demand and price of rice was increased for four years, although the market lacks consistency as price fluctuates over time.
Even though some farmers were hesitating for high cost of rice production and unfair price for the product, most of farmers living condition were primarily related with the income from it and some farmers have shown significant changes in their livelihood.
The crop has contributed a lot to the improvement of farmers’ living conditions as it is their motive in engaging in rice production. Table 9 showed that 81% of the respondents constructed better living house (iron sheath). It was good thing that all the farmers did not face any food shortage problem for the last five years before survey time and more than 89.1% respondents told as their food intake has been improved after they stared rice production.
| Change/Effect | Yes (N=119) | Percent (N=119) | St. Deviation |
|---|---|---|---|
| Construction of better living house | 97 | 81.5 | 0.390 |
| Improved the amount of food consumed | 106 | 89.1 | 0.313 |
| Improved the clothing of family members | 99 | 83.2 | 0.371 |
| Improved the schooling of children | 91 | 76.5 | 0.426 |
| Increased the number of livestock | 80 | 67.5 | 0.472 |
| Increased number of farm tools | 81 | 68.1 | 0.461 |
| Increased the use of fertilizer on other crops | 62 | 52.1 | 0.502 |
| Increased the use of improved seed for other crops | 49 | 41.2 | 0.490 |
| Having TV/mobile/radio/tape | 62 | 52.1 | 0.502 |
| Having house in the town | 18 | 15.1 | 0.360 |
| Saving money in the bank/microfinance/on hand | 65 | 54.6 | 0.500 |
Table 9: Contribution of rice production. Source: Own survey result (2015).
According to the obtained result 65.5% of farmers increased the number of livestock they have and that is why most of the farmers have oxen for cultivation. More than 60% of the respondents told their families members clothing, farm tool implements, and schooling of children has been improved as result of rice production. Nearly 50 % of the respondents improved their usage of fertilizer and improved seed for other crops, 52 % have their own mobile telephone, 54.6% have cash savings in bank, microfinance institution and in hand and 15.1 % have constructed a house in town (Table 9).
Cost benefit analysis: To evaluate comparative advantage of rice production, cost benefit analysis method has been used. In the study area, major annual crops grown in large amount were rice, maize and sorghum. For simplicity, all necessary data regarding costs and yields collected from the respondents was on the timad (1/8th of a hectare) base and finally changed to the hectare. All the farmers get income from only the sale of yields from their rice crop and straw being left on the farm and have no any other income generation activity being done on it. For cost estimation, variable costs and opportunity cost of land for one production season have been used.
Since all the farmers use the paddy rice, price was valued in paddy form on average considering its fluctuation. Weeding cost has the lion share of all costs. Marketing cost includes sack cost, transport cost from farm to home and to the market. Gross revenue per hectares was 19085 ETB and total cost of 14934 and gross profit of 4150 (Table 10). This was lower than the profit level from production of paddy per hectare 5006.48 birr obtained at Fogera district Amhara region [16]. However, it was nearly the same as profitability level 4038 obtained in the same area Fogera Woreda Amhara region by Temesgen, et al. [17].
| Parameter | Rice Crop | Maize Crop | Sorghum Crop | |||
|---|---|---|---|---|---|---|
| Mean Value | St. Dev. | Mean Value | St. Dev | Mean Value | St. Dev | |
| Average yield (qt ha-1) | 31.68 | 6.017 | 50.65 | 13.849 | 34.4874 | 8.525 |
| Average price (ETB qt-1) | 603 | 46.38 | 281.42 | 51.9 | 357 | 36.409 |
| Gross revenue (ETB qt-1) | 19085 | 3668.94 | 14421.2 | 5563.13 | 12305.1 | 3198.7 |
| Average Cost (ETB ha-1) | ||||||
| Opportunity cost of land | 1000 | 0 | 1000 | 0 | 1000 | 0 |
| Land preparation | 2228.23 | 285.58 | 1919.59 | 538.409 | 1472.94 | 278.429 |
| Fertilizer cost | 1842.69 | 20.654 | 2860 | 0 | 3068 | 0 |
| Seed cost | 854.69 | 177.86 | 572 | 0 | 93.2437 | 31.56 |
| Herbicide cost | 121.65 | 39.465 | 78.00 | 48.233 | 94.7899 | 34.166 |
| Weeding cost | 5891.83 | 1404.37 | 2473.68 | 604.886 | 1538.82 | 368.28 |
| Harvesting and threshing | 1750.92 | 419.99 | 2224.8 | 649.257 | 1989.85 | 446.004 |
| Marketing cost | 1244.88 | 488.688 | 873.14 | 500.422 | 535.025 | 268.6 |
| Weevil killer | 124.90 | 69.016 | 81.3782 | 20.38 | ||
| Total Cost | 14934.9 | 1816.77 | 12126 | 1658.71 | 9874.05 | 909.211 |
| Gross Profit | 4150 | 3122.55 | 2294 | 4559.93 | 2431.83 | 2790.839 |
Table 10: Cost benefit analysis of rice. Source: Own computations (2015).
For maize production, input cost is higher than other costs. Marketing cost includes, sack cost, transport cost from farm to home and to the market. Grain damage due to weevil is a major post-harvest loss incurred in the area thus, farmers use chemical protectants for stored grains immediately after harvest. Average farmers’ profitability of maize was 2294 birr per hectare (Table 10). Even though, on average, farmers have shown better productivity for maize, lower product price has made it difficult to compete with rice profitability. During focus group discussion, farmers desperately mentioned about the unfair market price of maize. That was the reason that its profitability was very much lower than rice. Sorghum was profitable than maize but lower than rice with average profitability of 2431.83 birr (Table 10).
According to the obtained result, it has lowest production cost related with its lower frequency and method of weeding activity. Relatively, rice consumes more cost of production, however it allows higher benefit and better profitability than maize and sorghum.
Conclusion and Recommendations
In Guraferda most of farmers are producing rice in better marketoriented way than other food crops grown in the area and it creates better employment opportunity for most of farm households. Land coverage of rice has been increasing than any other crops being produced in the area. However, adoption of existing improved rice varieties like NERICA-4 and SUPERICA-1 and fertilizer application as well as other agronomic practices was weak as most of farmers were not using technologies. As a result, farmers gain was only increased from area expansion aside rice productivity was being declining due to various reasons. This shows the extension services given in the area lack important components that could drive farmers to better production systems.
Despite rice production incurs higher cost of production, it was a profitable business than other food crops like maize and sorghum which are also grown in the area.
Rice is a significant contributor and the same will be in the future as the crop has potential to improve the livelihood of farm households and communities. Thus, attention should be given on rice production and solving associated constraints like introduction and evaluation of improved high yielding varieties in the area; and generation and wider demonstration of demand-driven rice technologies for producers. Furthermore, strong research extension and farmer linkage should be established to address rice production problems and generating demand driven technologies. Better soil fertility and water management practices should get attention as they are necessary to counter balance the adverse weather conditions.
Effective extension service provision should be given for farmers in the way that farmers could understand and develop awareness about the technologies in better approach like field demonstration and field visits for easier promotion and increase the exposure of farmers to appropriate and promising rice production technologies. Farmers experience of fertilizer application on rice should be tested in scientific way supported by partial budget analysis whether to accept what farmers say” fertilizer application has no more yield effect “or to come up with location specific recommended rate of fertilizer for rice.
Effective monitoring of existing market and development of wellfunctioning market access for rice with introduction and promotion of better value addition activities on rice product which is led by strong and strategic synergetic relation of stake holders should get attention.
References
- Central Statistical Agency (CSA) (2014) Agricultural sample survey 2013/2014. Report on area and production of major crops. Central Statistical Agency of Ethiopia, Addis Ababa, Ethiopia.
- Maclean J, Hardy B, Hettel G (2013) Rice Almanac: Source book for one of the most important economic activities on earth. IRRI.
- Belayneh T, Tekle J (2017) Review on adoption, trend, potential, and constraints of rice production to livelihood in Ethiopia.
- Alemu D (2015) Rice in Ethiopia: Progress in production increase and success factors. In 6th CARD General Meeting, pp: 1-22.
- Seyoum M, Alamerew S, Bantte K (2012) Genetic variability, heritability, correlation coefficient and path analysis for yield and yield related traits in upland rice (Oryza sativa L.). Journal of Plant Sciences 7: 13-22.
- Lakew T, Tariku S, Alem T, Bitew M (2014) Agronomic performances and stability analysis of upland rice genotypes in North West Ethiopia. International Journal of Scientific and Research Publications 4: 1-9.
- Central Statistical Agency (CSA) (2016) Agricultural sample survey 2015/2016. Report on area and production of crops (Private peasant holdings, Meher Season). Central Statistical Agency of Ethiopia, Addis Ababa, Ethiopia.
- Negussie T, Alemu D (2011) An Overview of the National Rice Research and Development Strategy and its Implementation. Challenges and Opportunities of Rice in Ethiopian Agricultural Development, pp: 1-16.
- Guraferda District Office of Agriculture and Rural Development (GDOARD) (2015) Report on socio economic profile and background information of the district.
- Yamane T (1967) Statistics, an introductory Analysis. 2nd (edn.) Horper and Row, New York.
- Abayneh KK, Addis AT, Altaye TG (2018) Estimation of Genetic Variability, Heritability and Genetic Advance in Upland Rice (Oryza Sativa L.) Genotypes at Guraferda, South West Ethiopia. Journal of Food Science and Quality Management.
- Kassa B (2010) Rice value chain in Metema District, North Gondar, Ethiopia: Challenges and opportunities for innovation. (Doctoral Dissertation), Addis Ababa University.
- Barman S, Bhuiya MSU, Haque MZ (2007) Effect of variety and source of compost on the yield and yield component of lentil. Journal of Agroforestry Environment 3: 13-15.
- Afework H (2014) Choices of Varieties and Demand for Improved Rice Seed in Fogera District of Ethiopia.
- Alemayehu Tassew A (2017) Performance evaluation of upland rice varieties in south western areas of Ethiopia. Journal of Agricultural Research.
- Takele A (2010) Analysis of rice profitability and marketing chain: The case of Fogera Woreda, South Gondar Zone, Amhara national regional state, (Doctoral Dissertation), Haramaya University, Ethiopia.
- Temesgen Y, Tilahun D, Belay B (2014) Production Expansion, Competitiveness and Comparative Advantage of Upland Rice Production: Case of Fogera and Libokemekem Plain in Ethiopia. The International Journal of Applied Economics and Finance 8: 48-50.
Citation: Helamo EM, Tassew AA (2018) Production Expansion and Comparative Advantage of Upland Rice Production and its Effect on the Local Farming Systems: The Case of Guraferda District, Southwest Ethiopia. Adv Crop Sci Tech 6: 395. DOI: 10.4172/2329-8863.1000395
Copyright: © 2018 Helamo EM, et al. This is an open-access article distributed under the terms of the Creative Commons Attribution License, which permits unrestricted use, distribution, and reproduction in any medium, provided the original author and source are credited.
Share This Article
Recommended Journals
Open Access Journals
Article Tools
Article Usage
- Total views: 4323
- [From(publication date): 0-2018 - Apr 25, 2025]
- Breakdown by view type
- HTML page views: 3445
- PDF downloads: 878