Research Article Open Access
Prevention against Deposits at the Bottom of Oil Stabilization Column.
Hassen Sellami M*, Benzaoui L and Mouhoubi IProcess Engineering Department, Laboratory of Process Engineering, Ouargla University, Ouargla, Algeria
- *Corresponding Author:
- Hassen Sellami M
Associate Professor
Process Engineering Department
Laboratory of Process Engineering
Ouargla University, Ouargla, Algeria
Tel: +213.771168857
E-mail: sellami2000dz@gmail.com
Received Date: June 27, 2016; Accepted Date: July 06, 2016; Published Date: July 13, 2016
Citation: Hassen Sellami M, Benzaoui L, Mouhoubi I (2016) Prevention against Deposits at the Bottom of Oil Stabilization Column. Oil Gas Res 2:117. doi: 10.4172/2472-0518.1000117
Copyright: © 2016 Hassen Sellami M, et al. This is an open-access article distributed under the terms of the Creative Commons Attribution License, which permits unrestricted use, distribution, and reproduction in any medium, provided the original author and source are credited.
Visit for more related articles at Oil & Gas Research
Abstract
Formation of salts composed mainly of NaCl and CaSO4 in the bottom of columns in oil production trains causes huge difficulties and obstacles to the sweet units running. Precipitation of salts in question is caused by the operating temperature of 145°C at the bottom of the column. This is the origin of the increased pressure drop due to plugging of the anti-vortex which causes compulsory stops to proceed to the cleaning operations; either by simple washing with fresh water to dissolve NaCl or by mechanical cleaning every week by opening the column in order to remove adherent scale deposits. To solve this problem, tests and experiments were held in order to select an own crude oil emulsion-breaker for Ourhoud field in southern east of Algeria, to result in decrease of crude salinity after electrostatic desalting as to have minimum scale deposits. Experimental study carried out in (Ourhoud) laboratory reveals that one commercial emulsion-breaker from five others is chosen because of its effectiveness; this is the (CECA-SY-25E). An anti-deposits (EC-6146-A) is further injected in production trains. After then, trains have recovered their normal walks without recording any pressure drop.
Keywords
Stabilization column; Emulsion-breaker; Crude salinity; Electrostatic oil desalting
Introduction
Oil and gas production operations are characterized by the inevitability of numerous technical problems related to the nature of the produced effluents. Scale deposition is one of the most important and serious problems for oil Industries because it causes a lot of trouble in design and equipment operations. These consequences could generate equipment failure, emergency shutdown, the increase of maintenance’ cost and several decreases in production efficiency. Stopping the Ourhoud’s oil-production unit for one day causes a production loss of 78.103 barrels, so nearly 5 million U.S Dollars. In Ourhoud’s field, the formation waters are saturated with high concentration ions especially Ca2+ and SO42-. The bottom of stabilization column presents the favorite place for CaSO4 precipitation because of the high temperature prevailing at the location (145°C) and thus, results to a very hard and adherent deposit. Analysis of the hard deposit at the bottom of the column shows that the salt is calcium sulphate. A simple pressure drop in the tubing leads to partial evaporation of water leading to its saturation and rapid deposition of the salt.
The calcium sulfates is known in its anhydrous form (CaSO4) and under two other forms:
- Dehydrated calcium sulphate (CaSO4.2H2O) or gypsum.
- Hemi hydrate calcium sulphate (CaSO4.1/2H2O).
Table 1 summarizes the percentage weight of compounds present in the scale deposit located in the bottom of stabilization column. It can be seen clearly from iron oxide percentage that the corrosion has been occurred severely not to mention clogging and fouling. All crudes contain dilute dispersion/emulsion of ultrafine salty water droplets composed by a variety of salts, solids and metals. Adverse effects of these impurities can result in shortened unit run lengths and reduced equipment reliability. These emulsions are generally stable due to the presence of natural surfactants in oil such as fine solids, asphaltenes, naphthenic acids, resins, clay…etc. [1]. To prevent corrosion, plugging, fouling of equipment, water-soluble salts are removed from an oil stream by electrical desalting plants which are often installed in crude oil production units [2]. The refiners always preheat and wash the crude oil with fresh water, add chemical demulsifier (emulsion breaker), and use high electrical field to remove added water and most of the inorganic contaminants from the crude oil [1]. Several researchers carried out a study of non-electrical desalting and proposed many achievements recently, including different methods namely: centrifuge method [3], filtration method, [4,5] hydro-cyclone method [6], and microwave radiation method [7]. However, those techniques were less used in industrial production because of the complex of the equipment, their cost and their low reliability. Other investigators [8-11] used and developed a mathematical model by studying the effect of different key parameters of crude oil desalting on salts removal efficiency , namely: oil temperature, demulsifier amount, wash water rate and drop pressure of mixing valve and settling time. They found that the water and salt removal efficiency increases with oil temperature, demulsifier and wash water amounts, settling time and to a certain value of pressure drop of mixing valve. One of the important keys is the crude temperature. Preheating cold oil decreases its viscosity, dissolves the film coating emulsion droplets, activates emulsion breaker and thus, facilitates water droplets coalescence and settling [12].
| Compound | NaCl | CaSO4 | Fe2O3 | Organiccompounds | Clay |
|---|---|---|---|---|---|
| Weightpercentage(%) | 38.39 | 26.27 | 04.65 | 21.05 | 09.64 |
Table1: Chemicalanalysisofscaledeposits.
The objective of this experimental work is an attempt to treat the problem of scale deposits using two complementary manners:
- Firstly, apply an immediately solution by injecting an anti-scale in order to inhibit the scale deposit formation.
- Secondly, choose by bottle-tests analysis a suitable demulsifier (emulsion-breaker) which can reduce the crude salinity to a minimal possible value after oil desalting.
However, this second solution requires a long period because of laboratory tests from which we must choose between five commercial demulsifiers using six different concentrations: 10, 20, 30, 40, 50, and 100 ppm.
Experimental Procedure
This paragraph presents the determination method of free water and emulsion, Basic Sediments and Water (BS&W) and emulsion breakers efficiencies for the crude oil, or otherwise, the bottle test experiments.
Six series of experiments have been carried out using 10, 20, 30, 40, 50 and 100 ppm of each emulsion-breaker. We have to choose between the five emulsion-breakers cited below:
- CECA-SY-25-E (CECA PROCHINOR)
- CS-LA-175 (CECA PROCHINOR)
- BJ-TB-9001 (BJ-UNICHEM)
- BJ-U-05317 (BJ-UNICHEM)
- MI-EB-8789 (MI-SWACO)
The results have been expressed as curves display efficiencies versus settling time.
Determination of free water and emulsion in the crude
Just after sampling and temperature recording, we introduce a quantity of 100 ml of crude in a graduated cylinder with conical bottom and then centrifuged for five minutes then we record the volume (V0) of free water and the volume of emulsion in the bottom of the cylinder. The volume in ml represents directly the percentage. The results are presented for each sample in the table before any emulsion-breaker test.
Analysis for basic sediment and water (BS&W)
Materials and solutions needed: For analysis of Basic Sediment and Water in the crude oil using five different emulsion-breakers, we have to use the following materials and solutions:
• Five bottles of 100 ml volume.
• Three Pipettes of 20 ml volume.
• Water bath.
• Centrifuge apparatus.
• Three beakers for rinsing.
• The five different commercial demulsifiers.
• Solvent (xylene).
Procedure: For determinate the (BS&W), the steps must be followed:
• Fill two centrifuge tubes to 50% mark with xylene.
• Mix oil sample thoroughly and fill the tubes remainder to the 100% mark and mix.
• Add a chosen volume of one demulsifier to each tube and mix.
• Place tubes in water bath at (70-80°C) for about 10 min until they reach the chosen temperature.
• Centrifuge the tubes for 5 min.
• Record observations to include volume of water, then solids volume and oil.
• Calculate the water volume (V) corresponding to 100 ml of oil sample.
Emulsion breaker efficiency: The efficiency of commercial emulsion-breaker was calculated using the water volumes (V0 and V) recorded in previous experiments by using the following expression:

The total volume (V’) of residual water contained in the crude sample is determined using one (ml) of universal emulsion breaker (F- 46) following the same method above in paragraph 2.2.2
Results and Discussion
During experiments, we will choosing between five emulsionbreakers using six different concentrations with a settling time of up to one hour; therefore, this will need a relatively long time which means that we will need a lot of fresh samples of crude oil. Knowing that taking a lot of samples implies that to have samples with different properties, despite that all samples have been taken from the same oil well (QB- 34). For these experiments we have used 6 samples for six different concentrations, i.e. one sample for each concentration; otherwise, one sample for five emulsion-breakers; i.e. 30 tests. We try to find a product that provides high efficiency with low concentrations and short settling time. Before any curves we will insert a table containing properties of the oil’s sample used.
First experiment (10 ppm of emulsion-breaker)
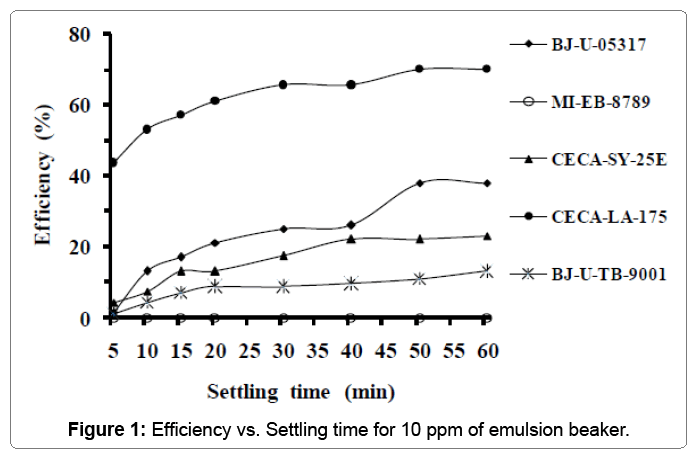
Table 2 summarizes properties of the first sample of crude oil used in the first experiment. It can be observed from the Table 2 that the crude oil used has a high salinity. Figure 1 displays the variation of emulsion-breaker’s efficiency versus settling time of water. It is clear that the emulsion-breaker (CECA-LA-175) is the better but it needs more than 40 min for settling time to reach significant efficiency (65.5%). Its maximal efficiency was 70% after one hour of settling time.
| Oilwell | Temperature(�°C) | Oilsalinity(mg/l) | Freewater(%) | Emulsion(%) | Residualwater(%) |
|---|---|---|---|---|---|
| QB-34 | 17 | 20000 | 3.5 | 17 | 23 |
Table 2: Sampleproperties.
Second experiment (20 ppm of emulsion-breaker)
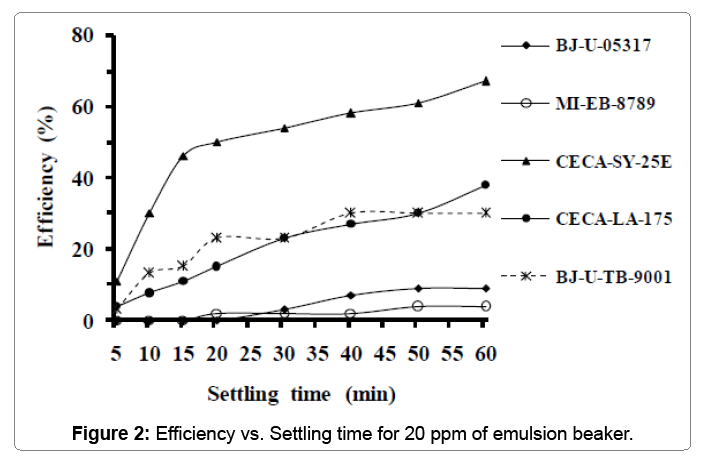
Table 3 below groups properties of the second sample used in the second test. From this table, we can see that the oil salinity is 2.3 times high compared to the previous sample. Figure 2 shows the emulsionbreaker’s efficiency versus settling time for the second test when adding 20 ppm of emulsion-breaker. From curves, it can be clearly seen that the curve of emulsion-breaker (CECA-SY-25E) is above the others. Its efficiency increases with settling time to reach the maximum of 58% after 40 minutes. 67% of efficiency was recorded after 60 minutes of settling time for the same emulsion-breaker. Although that the concentration has doubled, the product (CECA-LA-175) remains less important than in the first experiment. This was explained probably by the high value of salinity and emulsion percentage recorded with the sample used.
| Oilwell | Temperature(�°C) | Oilsalinity(mg/l) | Freewater(%) | Emulsion(%) | Residualwater(%) |
|---|---|---|---|---|---|
| QB-34 | 16 | 46095 | 0.5 | 30 | 26 |
Table 3: Sampleproperties.
Third experiment (30 ppm of emulsion-breaker)
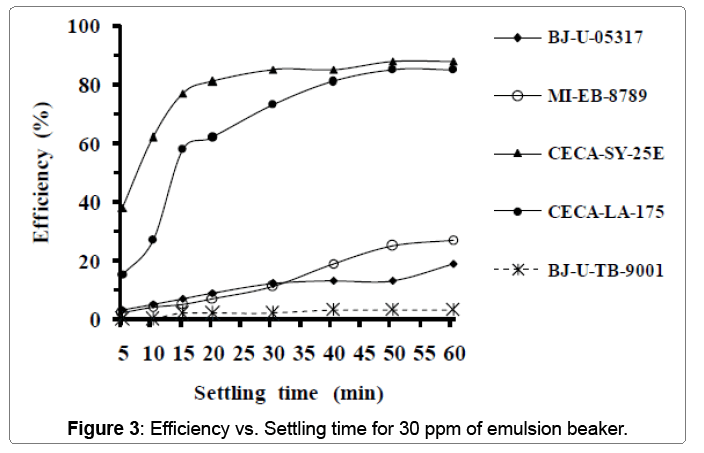
Table 4 below summarizes the properties of the third sample used in this experiment. From the previous table, we can see that the oil salinity is closely lower compared to the previous sample; In addition, this sample is colder. Figure 3 clarifies the variation of emulsionbreaker’s efficiency vs. settling time. Adding 30 ppm of product leads to a great differences between their efficiencies. The better product in this case is the (CECA-SY-25E) which reaches more than 85% of efficiency just after 30 minutes of settling time. Its maximal efficiency recorded is 88% after 50 minutes of settling time. The product (CECA-LA-175) is ranked the second relating to efficiency because it doesn’t reach its maximal efficiency (85%) until 50 minutes of settling time.
| Oilwell | Temperature(�°C) | Oilsalinity(mg/l) | Freewater(%) | Emulsion(%) | Residualwater(%) |
|---|---|---|---|---|---|
| QB-34 | 12 | 43237 | traces | 32 | 26 |
Table 4: Sampleproperties.
Fourth experiment (40 ppm of emulsion-breaker)
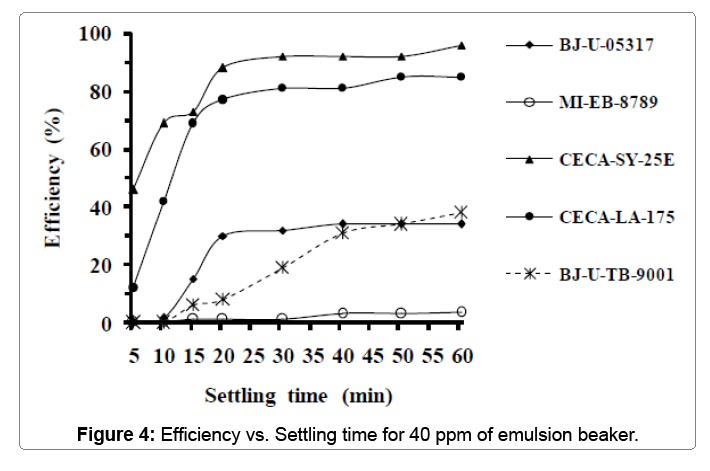
Table 5 below groups properties of the fourth sample used in this test. From the previous table, we can see that the properties of this sample are nearly the same compared to the previous sample. Figure 4 displays the result of variation of each emulsion-breaker’s efficiency versus settling time after adding 40 ppm. From the curves, we can notice that there is no improvement in the effectiveness of (CECA-LA-175) which remains approximately around 88% after 50 minutes of settling time. However, the effectiveness of (CECA-SY-25E) varied significantly after 30 min to 92% and reached 96% after 60 minutes.
| Oilwell | Temperature(�°C) | Oilsalinity(mg/l) | Freewater(%) | Emulsion(%) | Residualwater(%) |
|---|---|---|---|---|---|
| QB-34 | 14 | 43110 | 0 | 33 | 26 |
Table 5: Sampleproperties.
Fifth experiment (50 ppm of emulsion-breaker)
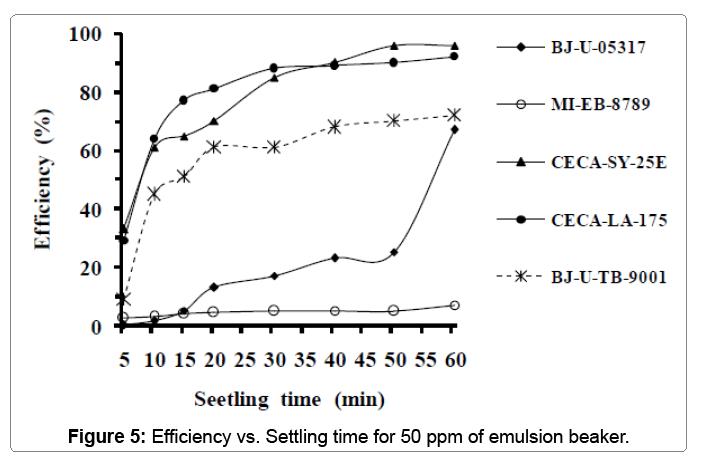
Table 6 below summarizes the properties of the fifth sample used in this experiment. Figure 5 displays the variation of emulsionbreakers effectiveness versus settling time. As can be seen, emulsionbreakers (CECA-LA-175 and CECA-SY-25E) remains the best also in this experiment. They reached 90% of effectiveness after 40 minutes of settling time. The maximal efficiencies recorded were 92% and 96% respectively for CECA-LA-175 and CECA-SY-25E after one hour of settling time.
| Oilwell | Temperature(�°C) | Oilsalinity(mg/l) | Freewater(%) | Emulsion(%) | Residualwater(%) |
|---|---|---|---|---|---|
| QB-34 | 22 | 37868 | traces | 31 | 26 |
Table 6: Sampleproperties.
Sixth experiment (100 ppm of emulsion-breaker)
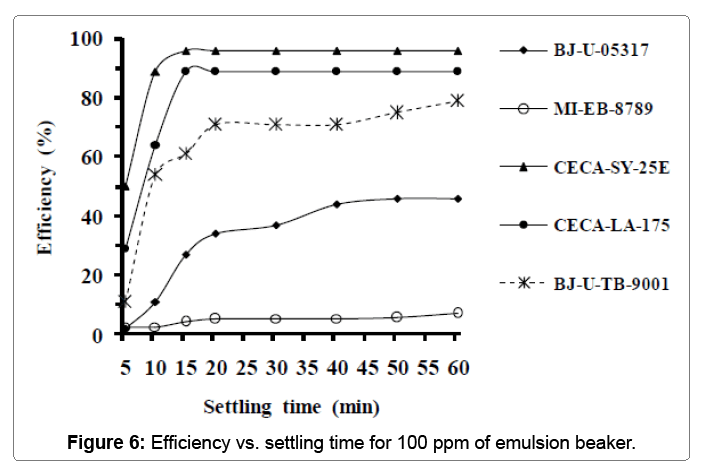
Table 7 below groups the properties of the sixth sample used in this experiment. Figure 6 below presents the effect of maximal emulsionbreaker concentration on its effectiveness. The products of CECA PROCHINOR: SY-25E and LA-175 appear as the best in this last experiment. Such of them reached its maximal effectiveness 15 minutes of settling time. The high efficiency recorded is that of CECA-SY-25E with 96% followed by that of CECA-LA-175 with 89%.
| Oilwell | Temperature(�°C) | Oilsalinity(mg/l) | Freewater(%) | Emulsion(%) | Residualwater(%) |
|---|---|---|---|---|---|
| QB-34 | 21 | 23756 | 0.15 | 28 | 28 |
Table 7: Sampleproperties.
Industrial Test
Industrial tests will confirm the bottle-test under operating conditions. These tests should be carried out in winter due to the unfavorable influence of low temperature on the stability of the emulsion. Thus, this will present an important criterion for the selection of the suitable product.
- The product is injected only at the satellites.
- The duration is 30 days in two stages of 15 days everyone.
- During the first stage the product will be tested at 15 ppm.
- During the second stage the product will be tested at 10 ppm only.
- Perform sampling in several points of production trains for controlling the salinity level, the emulsion percentage and the settled water quality.
Selection criteria
Criteria for selection of an emulsion-breaker are the following:
- Emulsion percentage=0%
- Salinity<40 mg/l at the output of the second desalter.
- The chosen product is which leads to a minimum of oil in settled water.
If the above conditions are not met, we increase the product concentration and repeat again the previous industrial trial. After three months of industrial trials with injection of an anti-deposit (EC- 6146-A), the emulsion-breaker (CECA-SY-25E) has been chosen as to be the own crude oil emulsion-breaker for OURHOUD’s field. Therefore, production trains have resumed their normal operation; no increase in the pressure drop was recorded. Thus, these two complementary operations have resolved this problem.
Conclusion
To avoid production losses due to stoppages of trains which are caused by deposits, corrosion and clogging of oil equipment at the OURHOUD’s field, laboratory analysis and experiments were conducted in order to find and choose an emulsion-breaker. Five emulsion-breakers agents have been proposed by the manufacturers; 30 experiments were conducted with six different doses of each product (10, 20, 30, 40, 50 and 100 ppm). These experiences also called bottle-test results in selecting the most effective product. From an economic point of view, the emulsion-breaker is chosen that if it gives maximum efficiency with a low concentration for a very short settling time of residual water and emulsion. From the previous experiments, the emulsion-breaker (CECA-SY-25E) is shown to be the best. Complementarily, an anti-scale will be injected to avoid any deposit.
After 3 months of industrial trials during which an anti-deposit (EC-6146-A) and an emulsion-breaker (CECA-SY-25E) have been injected, no increase in the pressure drop was recorded and the problem has been resolved.
Acknowledgment
The authors thank the personnel of Sonatrach Laboratories Group/OURHOUD/ Algeria, without forgetting Mr. Moures Med Seghir, for their valuable cooperation in sampling and doing the experimental tests.
References
- Office of Inspector eneral,U.S Department of Interior (2015).Organizational Assessment
- National Commission on the BP Deep water Oil Spill (2011) Report to the President, p:115.
- Lewis P (2013) Comparison of High Reliability Organizations (HROs). Integrated Communications, Navigation and Surveillance Conference pp:2155-4943.
- Weick K, Sutcliffe K (2007) Managing the unexpected: Resilient performance in an age of uncertainty. San Francisco, CA.
- Waring T, Wainwright D (2008) Issuesand Challenges in the Use of Template Analysis: Two Comparative Case Studies from the Field.The Electronic Journal of Business Research Methods 6:85-94.
- BrymanA(2012)SocialResearchMethods.OUP,Oxford.
- King N (2012) Doing template analysis in Qualitative Organizational Research: Core Methods and Current Challenges. Sage, London.
- King N (1998) Template Analysis in Qualitative Methods and Analysis in Organizational Research.Sage, London.
Relevant Topics
Recommended Journals
- Oil & Gas Research Journal
- Renewable Energy and Applications Journal
- Oceanography Journal
- Industrial Pollution Control Journal
- Coastal Zone Management Journal
- Climatology & Weather Forecasting Journal
- Geoinformatics & Geostatistics Journal
- Engineering and Technology Journal
- Petroleum & Environmental Biotechnology Journal
- Polymer Sciences Journal
Article Tools
Article Usage
- Total views: 3822
- [From(publication date):
December-2016 - Jul 13, 2025] - Breakdown by view type
- HTML page views : 2893
- PDF downloads : 929

