Research Article Open Access
Predictive Value of 1 Month Postoperative MRSI and FDG-PET Evaluations of Glioblastomas
| Dorra Ben Sellem1#, Waisse Waissi2#, Mojdeh Dormishian1, Caroline Bund1, Jean-Louis Dietemann3, Marie-Pierrette Chenard4, Georges Noël2 and Izzie-Jacques Namer1,5,6* | |
| 1Department of Biophysics and Nuclear Medicine, Hautepierre Hospital, University Hospital of Strasbourg , Strasbourg, France | |
| 2Department of Radiotherapy, Centre Paul Strauss, Strasbourg, France | |
| 3Department of Radiology, Hautepierre Hospital, University Hospital of Strasbourg, Strasbourg, France | |
| 4Anatomical pathology service, Hautepierre Hospital, University Hospital of Strasbourg, Strasbourg, France | |
| 5ICube, University of Strasbourg/CNRS UMR 7357, Strasbourg, France | |
| 6FMTS - Faculty of Medicine, Strasbourg, France | |
| #Authors contributed equally | |
| *Corresponding Author : | Izzie-Jacques Namer Department of Biophysics and Nuclear Medicine, Hautepierre Hospital University Hospital of Strasbourg, Strasbourg, France Tel: +33 388 127 550 Fax: +33 388 128 342 E-mail: Izzie.Jacques.NAMER@chru-strasbourg.fr |
| Received date: February 26, 2016; Accepted date: April 04, 2016; Published date: April 08, 2016 | |
| Citation: Sellem DB, Waissi W, Dormishian M, Bund C, Dietemann JL, et al. (2016) Predictive Value of 1 Month Postoperative MRSI and FDGPET Evaluations of Glioblastomas. OMICS J Radiol 5:220. doi:10.4172/2167-7964.1000220 | |
| Copyright: © 2016 Sellem DB, et al. This is an open-access article distributed under the terms of the Creative Commons Attribution License, which permits unrestricted use, distribution, and reproduction in any medium, provided the original author and source are credited. | |
Visit for more related articles at Journal of Radiology
Abstract
Aim: The purpose of this study was to investigate prospectively the predictive value of positron emission tomography with proton magnetic resonance spectroscopic imaging (MRSI) and 18F-fluorodeoxyglucose (FDG-PET) performed the 1st month after surgery and before radio- chemotherapy in 43 patients with glioblastoma (GBM).
Patients and methods: Metabolite concentrations were quantified using LCModel. Overall survival (OS) and progression free survival (PFS) were calculated including all 43 patients using Kaplan-Meier curves, and the Cox proportional hazard model was used to calculate the predictor of survival.
Results: At the end of the follow-up period, all patients died within a period of 1–70.2 months. In 32 patients (74.4%), increased FDG-uptake was seen around the resection cavity and abnormal metabolic profiles on MRSI, indicative of residual disease, were present in all patients. There was no significant difference between the median OS in patients with hypometabolic FDG lesions compared to patients with hypermetabolic FDG lesions. On univariate analysis, normalized choline-containing compounds/creatine (nCho/Cr) and normalized lactate/creatine (nLac/Cr) were significantly predictive of OS and nLac/Cr and normalized N-Acetylaspartylglutamate and NAcetylaspartate/ creatine (NAA/Cr) were significantly predictive of PFS.
Conclusions: nCho/Cr and nLac/Cr ratio after surgery and before radio-chemotherapy were independent metabolic predictive factors of OS times in newly diagnosed patients with GBM.
| Keywords |
| Brain; Glioma; Glioblastoma; MR spectroscopy; FDGPET; Radiotherapy; Chemotherapy; Prognosis |
| Introduction |
| Glioblastoma (GBM) is the most common (approximately 50%) and most aggressive primary brain tumor [1]. Despite recent developments in surgical technique and the current standard-of-care radiotherapy plus concomitant and adjuvant temozolomide chemotherapy, the prognosis to date remains poor, with a median survival range of 15-18 months and a 2 year survival rate of 26.5% [2-5]. |
| GBMs have a propensity for infiltration, especially along white matter tracks, and surgical removal of the entire lesion is often not achievable because of the tumor’s large size or difficult surgical location of the neoplasm. It is inevitable that a large percentage of patients will have residual disease after surgical resection and the tumor progression in the vicinity of the original GBM site remains the most prevalent form of failure after treatment [6]. It is important to define the full extent of residual tumor in order to adapt adjuvant therapies, mainly radiotherapy target volumes. However, the ability of contrastenhanced conventional anatomic imaging (MRI, CT) to differentiate between surgery-induced changes and residual tumor is limited [6-8]. |
| In recent years, integrating metabolic imaging such as FDG-PET and MRSI into imaging-guided surgery or physical imaging for radiation treatment planning has been suggested [6,8-13]. FDG-PET is the most widely used imaging technique that provides glucose metabolism information in brain tumours. FDG, a glucose analog, is actively transported across the blood–brain barrier into the cell, and therefore a disturbance of the blood–brain barrier does not influence FDG-uptake in the tumor. MRSI is another non-invasive imaging technique that is able to characterize the spatial distribution of pathologic biochemical changes in the tumor on the basis of the levels of tissue metabolites. Metabolic imaging has revealed a clear discordance between the GBM target volumes that result from metabolic imaging and those derived from anatomic imaging. |
| The aim of this study was to determine, in a prospective longitudinal study of a homogenous group of patients with GBM, the predictive values of FDG-PET and MRSI performed the 1st month after surgery and before radio chemotherapy on clinical outcome. |
| Patients and Methods |
| Patient population |
| Forty-three consecutive patients with a histologically confirmed GBM (grade IV astrocytoma, according to the histological criteria of the World Health Organization classification) were included in this prospective study, from March 2004 to October 2007. All patients underwent a gross surgical resection and the 1st month after surgery (before radio chemotherapy) MRI/MRSI and FDG-PET were performed within 72 h. All patients received the same standard radiation protocol (60 Gy) plus concomitant and adjuvant temozolomide treatment [14,15]. The follow-up consisted of a clinical and MRI evaluation. |
| MRI and MRSI |
| All MRI and MRSI investigations were performed on a 1.5 Tesla MR unit (AVANTO, Siemens Medical Systems, Erlangen, Germany). MRI sequences included conventional sagittal spin-echo T1-weighted, axial turbo spin-echo proton density, T2-weighted and axial fluid-attenuated inversion recovery (FLAIR) images. Multiplanar spin-echo T1- weighted and 3D magnetization-prepared rapid-acquisition gradientecho (MPRAGE) images with intravenous injection of 0.2 mmol/kg of gadolinium contrast agent were obtained following MRSI. The spatial resolution was 1 × 1 × 1 mm for the 3D MPRAGE sequence and 1 × 1 × 5 mm for all 2D sequences. |
| MRSI spectra were obtained using a double-spin echo pointresolved spectroscopy sequence (PRESS) with 2D or 3D 16 × 16 phaseencodings depending on the resection cavity. Measurement parameters were as follows: TR, 1500 ms; TE, 135 ms; excitations, 2; slice thickness, 15 mm; FOV, 240 mm; data points, 1024; and acquisition time, 7 min and 14 min for 2D and 3D sequences, respectively. The 2D or 3D of acquisition volume was positioned to cover the edges of the resection cavity and the majority of abnormalities and contralateral normal-appearing tissue. |
| All 2D and 3D spectra chemical-shift imaging (CSI) data were then analyzed using LCModel version 6.3 k-1 K [16]. For each case a subset of the voxels in the slice were selected and analyzed by LCModel in one multivoxel run according to LCModel and LCMgui user’s manual. A file containing the basis set of model metabolite spectra for PRESS with TE=135 ms freely available with LCModel was used for analyzing our data. Different metablolites concentrations including alanine, Cr, glutamine, glutamate, glutamine, Cho, glutathione, inositol, taurine, Lac, NAA were calculated with LCModel. For each metabolite concentration ratios to Cr were calculated. Only metabolites with estimated standard deviations (%SD) equal or less than 15% (Cho, NAA and Lac) were used for statistical analysis. |
| FDG-PET |
| FDG-PET imaging was performed using the Discovery ST combined PET/CT (GE Medical System, Milwaukee, USA). 18F-FDG was injected intravenously at 2.5 MBq/kg after a fast of at least 6 h (with the exception of ad libitum water intake) and capillary glycemia lower than 6.6 mmol/l. Image acquisition was initiated 30 min and 4 h after FDG injection, including low-dose non-contrast transmission CT scan followed by a 3D PET scan with an acquisition time of 15 min. Fusioned PET/CT images were obtained after attenuation correction using CT scans with the Ordered Subset Expectation Maximization (OSEM) algorithm with two full iterations of 21 subsets. The image reconstruction matrix was 128 × 128 with a transverse field of view of 60 × 60 cm. The PET component of the scanner had an in-plane spatial resolution of 4.7 mm. |
| For semi quantitative analysis of FDG-uptake, we used the maximum standardized uptake value (SUVmax) per focus defined as: SUVmax = [maximum value of radioactivity concentration (kBq/ml)] / [injected dose (MBq) / patient weight (kg)]. |
| A metabolic index, normalized SUVmax (nSUVmax), was calculated, at 30 min and 4 h, as the ratio of maximum residual tumor FDGuptake obtained using the region of interest (ROI) covering the entire residual tumor on trans axial slices to contralateral normal brain 18FFDG- uptake. An nSUVmax value greater than 1 is considered hypermetabolic; less than or equal to 1 is considered hypometabolic. |
| A retention index was calculated as follow: RI = [SUV (at 4 h)] – SUV (at 30 min)] / SUV (at 30 min). |
| Statistical analysis |
| Overall survival (OS) time was defined as the interval from the date of diagnosis to the date of death. Progression-free survival (PFS) was defined as the interval from the date of surgery to the date of the first clinical and/or MRI evidence of disease progression. Data were analysed using the SPSS system. Receiver Operating Characteristic (ROC) curve analyses were performed to estimate the sensitivity and the specificity at the optimal nSUV threshold and all MRSI parameters for distinguishing the two extreme survival groups. |
| For univariate analysis, survival curves were constructed using the Kaplan-Meier method. A log rank test was used to delineate which covariates independently influenced the patient’s outcome. All variables significant at p<0.05 in the univariate analysis were included in Cox regression model. |
| Results |
| Clinical outcome |
| The median age of the patients at the time of surgery was 64 years (range, 18-79 years). There were 15 women (35%) and 28 men (65%). At the end of the follow-up period, the 43 patients had died within a period of 1-70.2 months (median, 13 months). The median PFS was 6.7 months. According to OS time, patients were divided into three subgroups: group 1 with a low survival rate (<9 months) included 14 patients, group 2 with a high survival rate (>18 months) included 15 patients, and the last with intermediary survival included 14 patients. |
| FDG-PET analysis |
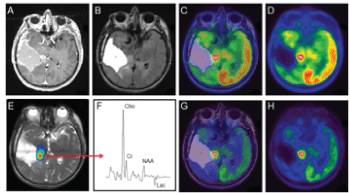
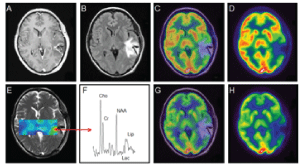
| In 32 patients (74.4%), higher levels of FDG-uptake (nSUVmax at 30 min) were seen around the resection cavity showing residual disease (Figure 1) and in 11 (25%) patients, was less than or equal to 1 (Figure 2). |
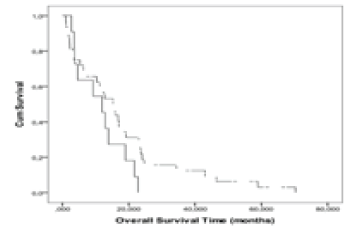
| There was no significant difference between the median OS in patients with hypometabolic FDG lesions compared to patients with hypermetabolic FDG lesions. The Kaplan-Meier plot showed that the median OS was not significantly different between group 1 and group 2 (p=0.138, log-rank) (Figure 3). There was also no significant relationship between nSUVmax (4 h), RI and OS. |
| MRSI analysis |
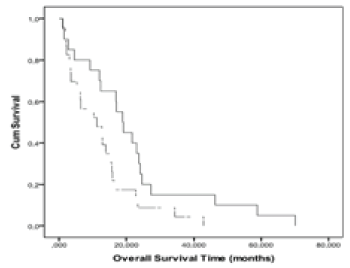
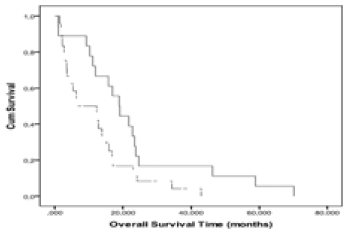
| An optimal n(Cho/Cr) cut-off level (2.56) clearly differentiating the two prognostic groups, with good sensitivity and specificity of 71.40%, and 73.30% was obtained from the ROC curves. The Kaplan-Meier curves (Figure 4) showed that the OS of patients with n(Cho/Cr) greater than or equal to 2.56 was significantly less than the survival of patients with n(Cho/Cr) less than 2.56 (p=0.02, log-rank). The Kaplan- Meier curves of PFS for n(Cho/Cr) showed no significant relationship (p=0.14, log-rank). |
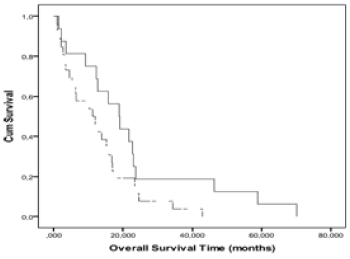
| An optimal n(Lac/Cr) cut-off level (1.64) separating the two prognostic groups, with good sensitivity and specificity of 85.7%, and 71.4% was obtained from the ROC curves. The Kaplan-Meier curves (Figure 5) showed that the OS of patients with n(Lac/Cr) greater than or equal to 1.64 was significantly lower compared to the survival of patients with n(Lac/Cr) less than 1.64 (p=0.02, log-rank). The Kaplan- Meier curves of PFS for n(Lac/Cr) showed that the PFS of patients with n(Lac/Cr) greater than or equal to 1.64 was significantly lower than the PFS of patients with n(Lac/Cr) less than 1.64 (p=0.03, log-rank). |
| An optimal n(NAA/Cr) cut-off level (0.6) separating the two prognostic groups with sensitivity and specificity of 64.3% and 78.6%, respectively was obtained from the ROC curves. The Kaplan-Meier curves (Figure 6) showed that the OS of patients with n(NAA/Cr) less than 0.6 was lower than the survival of patients with n(NAA/Cr) greater than or equal to 0.6 but the difference was not significant (p=0.06, log-rank). The Kaplan-Meier curves of PFS for n(NAA/Cr) showed that the PFS of patients with n(NAA/Cr) less than 0.6 was significantly lower than the PFS of patients with n(NAA / Cr) greater than or equal to 0.6 (p=0.01, log-rank). |
| Cox univariate analysis confirmed the association between OS and the n(Cho/Cr) and n(Lac/Cr) levels. According to PFS, n(Lac/Cr) and n(NAA/Cr) were significant prognosis factor in univariate analysis (Table 1). |
| Discussion |
| Several prognostic factors have been identified in patients with GBM: age, Karnofsky performance status, pathologic grade, and tumor location, the extent of surgery, neurological status, genetic and molecular biomarker status, and concomitant chemotherapy [17-22]. |
| Major efforts have been undertaken within recent years to apply metabolic imaging such as FDG-PET and MRSI to GBM that will add an understanding of the metabolic and cellular picture of the tumor to the anatomic or structural information derived from conventional imaging techniques such as MRI and CT [6,9,21-23]. |
| In this current study, we investigated the prognostic values of two functional imaging modalities, FDG-PET and MRS, in patients with GBM after surgery and before radio chemotherapy. FDG-PET, which reflects glucose metabolism, has been widely used in patients with malignant brain tumours for more than a decade. However, its utility remains controversial: it depends on the purpose to achieve. It has been used before treatment [21,24,25] to guide stereotactic biopsies of intracerebral tumours [26,27]. It has been correlated with glioma grade [28,29], gadolinium enhancement on MR images [30], and MRSI findings [31]. FDG-PET imaging was predictive of the progression of low-grade gliomas to a higher grade [32]. FDG-PET was also used to define the volume for radiation dose escalation of GBMs [33]. And to clearly distinguish between GBM recurrent tumors and radiation necrosis [34,35]. |
| The prognostic utility of FDG-PET remains controversial. Many studies have demonstrated an inverse statistical correlation between deoxyglucose trapping by the tumor and survival. Tralins et al. showed that the volume of FDG-PET avid tumor is predictive of survival and time to tumor progression [9]. More recently, Colavolpe et al. [36] demonstrated that FDG uptake before surgery is an independent prognostic factor in high-grade glioma. In a prospective pilot study, De Witte et al. compared MRI and FDG-PET in a group of ten patients, as a postoperative assessment of the extent of resection. They emphasized that, even after complete surgical resection, signs of residual tumor on either MRI or FDG-PET were associated with a high probability of recurrence within 6 months [21]. Disagreement regarding the value of FDG-PET studies is often related to heterogeneity in the patient cohort. |
| In the present study, we investigated only patients with a histologically confirmed GBM, imaged 1 month after surgery, before radio chemotherapy. We found that residual tumor was hypermetabolic in 74.4% of cases and hypometabolic in 25% of cases. The median OS was 11 months in patients with hypometabolic lesions and 15 months in patients with hypermetabolic lesions. In fact, GBMs are characterized histologically by the presence of necrosis, which derives from the mismatch between rapid cell growth and insufficient endothelial development. Kubota et al. have shown that prenecrotic cells are hypermetabolic [37]. Intensity of necrosis may differ among GBMs: in tumours where macroscopic necrosis largely predominates, metabolism may be reduced. In such patients, we found that there was a non-significant trend toward shorter OS compared to those with hypermetabolic lesions. |
| However, due to the FDG uptake in normal brain, the sensitivity of detecting recurrent or residual tumor is low. In the last decade, studies have focused on other radio markers or on the coregistration of PET and MRI, which has increased sensitivity over using either modality alone [35]. Therefore, the specificity of distinguishing gliomas from normal tissue could be increased from 68% with the use of MRI alone to 97% with the use of MRI in conjunction with 18Ffluoroethyltyrosine (FET-PET) and MRSI [38]. |
| Radiolabeled amino acids have been of particular interest, especially for the identification of low-grade tumor extent because they show high uptake in biologically active tumor tissue and low uptake in normal brain. Their use for tumor imaging is based on the observation that amino acid transport and/or metabolism are up regulated in malignant transformation [38]. The radiolabeled amino acids commonly used in clinical studies are 11C-methionine (MET-PET), 18F-dihydroxyphenylalanine (F-DOPA), and FET-PET. The rate of uptake is correlated with expression of Ki-67 proliferating cell nuclear antigen [39] and micro vessel density [40,41]. Therefore, Kim et al. found that in contrast to FDG-PET, MET-PET was found to be an independently significant prognostic factor, and MET uptake was correlated with cellular proliferation [36]. More recently, Kinoshita et al. [42] developed a novel image analysis method using matched FDGPET and MET-PET scans to calculate a decoupling score. |
| The second metabolic technique we have investigated is MRSI, which allows non-invasive exploration of the spatial distribution of metabolic differences in brain lesions during an MRI examination. It can characterize biochemical, metabolic, and pathologic changes in brain tissue [42,43]. It provides information on tumor activity on the basis of the levels of cellular metabolites, including Cho, Cr, NAA, and Lac/lipid [6]. Cho is a membrane component, and it is thought to be a marker of increased membrane turnover or higher cellular density. It is increased in tumours and reflects the hyper cellularity and hyperplasia of the tumor [44]. NAA is a neuronal metabolite marker, not present in other central nervous system cells. It is decreased in tumours due to neuronal loss or dysfunction [6,44]. Cr is necessary for cellular bio energetic processes and osmotic balance and might be a potential marker for cell energetics. Lactate is an end-product of modulated aerobic glycolysis in tumoral cell, characteristic by pyruvate generated from glucose metabolism is preferentially converted to lactate as opposed to entering the tricarboxylic acid cycle [45]. Lipid peaks generally correlate with necrosis and represent cellular breakdown [6]. |
| Spectra associated with tumor are distinguished from those associated with normal tissue by the characteristic increase in the resonance peak of Cho and reduction in the NAA peak [44,46]. In fact, a significant finding from a study by Dowling et al. [42] showed that 100% of biopsy specimens obtained from regions where Cho was elevated more than two SDs above normal and the NAA was decreased at least two SDs below normal contained tumor. In our study, abnormal metabolic profiles on MRSI, indicative of residual tumor, were present in all patients. A decrease in the NAA peak was observed in all patients. An increase in the Cho peak was noted in 75.6% of cases. A decrease in the Cr peak was observed in 80% of patients. The range of Cho increase and NAA decrease is compatible with the range of tumor infiltration [46]. |
| Before treatment, this was used to define the sites of metabolically active tumor inside and outside MRI lesions and to assess their infiltration of the brain [12,47-50]. Guillevin et al. have suggested that MRSI was a reliable tool to evaluate the proliferation activity of WHO grade II glioma and to identify potentially more aggressive clinical behaviour [48]. Laprie et al. [12] have demonstrated that areas of metabolic abnormalities inside tumours were predictive of the site of relapse compared with regions of normal Cho/NAA. This predictive value of MRSI has also been described in association with perfusion and diffusion MRI, providing additional information on T1 contrast enhancing images [51]. It was shown that there is a clear relationship between high cerebral blood volume, a low apparent diffusion coefficient, and high Cho for GBMs. |
| After surgical resection and before radio chemotherapy, it was suggested that MRSI would be a valuable diagnostic tool for the assessment of residual disease, clearly demonstrating that MRSI provides additional information regarding the tumour’s spatial extent [6,49,50]. In general, the tumor volume determined by MRSI is greater than that shown by MRI [6]. Even if surgical removal of the entire lesion is often not achievable because of the lesion’s large size or a difficult surgical location of the neoplasm, incorporating MRSI data into postoperative treatment planning may improve target definition. Analysis of MRSI metabolites may help differentiate regions of aerobic from regions of anaerobic metabolism, thus detecting hypoxic areas. The regions with low Cr and high Lac will require a greater dose of radiotherapy if poor oxygenation is causing such effects. This study investigated the prognostic factor of MRSI metabolites. We found that n(Lac/Cr) and n(Cho/Cr) values were independent metabolic predictive factors of OS time in newly diagnosed patients with GBM after surgery and before radio chemotherapy. |
References
- Fisher JL, Schwartzbaum JA, Wrensch M, Wiemels JL (2007) Epidemiology of brain tumors. NeurolClin 25: 867-890, vii.
- Stupp R, Mason WP, van den Bent MJ, Weller M, Fisher B, et al. (2005) Radiotherapy plus concomitant and adjuvant temozolomide for glioblastoma. N Engl J Med 352: 987-996.
- Mirimanoff RO, Gorlia T, Mason W, Van den Bent MJ, Kortmann RD, et al. (2006) Radiotherapy and temozolomide for newly diagnosed glioblastoma: recursive partitioning analysis of the EORTC 26981/22981-NCIC CE3 phase III randomized trial. J ClinOncol 24: 2563-2569.
- Dunet V, Rossier C, Buck A, Stupp R, Prior JO (2012) Performance of 18F-fluoro-ethyl-tyrosine (18F-FET) PET for the differential diagnosis of primary brain tumor: a systematic review and Metaanalysis. J Nucl Med 53: 207-214.
- Darefsky AS, King JT Jr, Dubrow R (2012) Adult glioblastomamultiforme survival in the temozolomide era: a population-based analysis of Surveillance, Epidemiology, and End Results registries. Cancer 118: 2163-2172.
- Pirzkall A, Li X, Oh J, Chang S, Berger MS, et al. (2004) 3D MRSI for resected high-grade gliomas before RT: tumor extent according to metabolic activity in relation to MRI. Int J RadiatOncolBiolPhys 59: 126-137.
- Dean BL, Drayer BP, Bird CR, Flom RA, Hodak JA, et al. (1990) Gliomas: classification with MR imaging. Radiology 174: 411-415.
- Gerstner ER, Sorensen AG, Jain RK, Batchelor TT (2008) Advances in neuroimaging techniques for the evaluation of tumor growth, vascular permeability, and angiogenesis in gliomas. CurrOpinNeurol 21: 728-735.
- Tralins KS, Douglas JG, Stelzer KJ, Mankoff DA, Silbergeld DL, et al. (2002) Volumetric analysis of 18F-FDG PET in glioblastomamultiforme: prognostic information and possible role in definition of target volumes in radiation dose escalation. J Nucl Med 43: 1667-1673.
- Ganslandt O, Stadlbauer A, Fahlbusch R, Kamada K, Buslei R, et al. (2005) Proton magnetic resonance spectroscopic imaging integrated into image-guided surgery: correlation to standard magnetic resonance imaging and tumor cell density. Neurosurgery 56: 291-298.
- Park I, Tamai G, Lee MC, Chuang CF, Chang SM, et al. (2007) Patterns of recurrence analysis in newly diagnosed glioblastomamultiforme after three-dimensional conformal radiation therapy with respect to pre-radiation therapy magnetic resonance spectroscopic findings. Int J RadiatOncolBiolPhys 69: 381-389.
- Laprie A, Catalaa I, Cassol E, McKnight TR, Berchery D, et al. (2008) Proton Magnetic Resonance Spectroscopic Imaging in Newly Diagnosed Glioblastoma: Predictive Value for the Site of Postradiotherapy Relapse in a Prospective Longitudinal Study. Int J RadiatOncolBiolPhys 70: 773-781.
- Ken S, Vieillevigne L, Franceries X, Simon L, Supper C, et al. (2013) Integration method of 3D MR spectroscopy into treatment planning system for glioblastoma IMRT dose painting with integrated simultaneous boost. RadiatOncol 8: 1.
- Stupp R, Tonn JC, Brada M, Pentheroudakis G (2010) High-grade malignant glioma: ESMO Clinical Practice Guidelines for diagnosis, treatment and follow-up. Ann Oncol 21: v190-v193.
- Ryu S, Buatti JM, Morris A, Kalkanis SN, Ryken TC, Olson JJ (2014) The role of radiotherapy in the management of progressive glioblastoma : a systematic review and evidence-based clinical practice guideline. J Neurooncol 118: 489-499.
- Provencher SW1 (1993) Estimation of metabolite concentrations from localized in vivo proton NMR spectra. MagnReson Med 30: 672-679.
- Gorlia T, van den Bent MJ, Hegi ME, Mirimanoff RO, Weller M, et al. (2008) Nomograms for predicting survival of patients with newly diagnosed glioblastoma: prognostic factor analysis of EORTC and NCIC trial 26981-22981/CE.3. Lancet Oncol 9: 29-38.
- Ducray F, Idbaih A, Wang XW, Cheneau C, Labussiere M, et al. (2011) Predictive and prognostic factors for gliomas. Expert Rev Anticancer Ther 11: 781-789.
- Chargari C, Feuvret L, Bauduceau O, Ricard D, Cuenca X, et al. (2012) Treatment of elderly patients with glioblastoma: from clinical evidence to molecular highlights. Cancer Treat Rev 38: 988-995.
- Orringer D, Lau D, Khatri S, Zamora-Berridi GJ, Zhang K, et al. (2012) Extent of resection in patients with glioblastoma: limiting factors, perception of resectability, and effect on survival. J Neurosurg 117: 851-859.
- De Witte O, Lefranc F, Levivier M, Salmon I, Brotchi J, et al. (2000) FDG-PET as a prognostic factor in high-grade astrocytoma. J Neurooncol 49: 157-163.
- Wright AJ, Fellows G, Byrnes TJ, Opstad KS, McIntyre DJO, et al. (2009) Pattren recognition of MRSI data shows regions of glioma growth that agree with DTI markers of brain tumor infiltration. MagnReson Med 62: 1646-1651.
- Maudsley AA, Domenig C, Govind V, Darkazanli A, Studholme C, et al. (2009) Mapping of brain metabolite distributions by volumetric proton MR spectroscopic imaging (MRSI). MagnReson Med 61: 548-559.
- Alavi JB, Alavi A, Chawluk J, Kushner M, Powe J, et al. (1988) Positron emission tomography in patients with glioma. A predictor of prognosis. Cancer 62: 1074-1078.
- Padma MV, Said S, Jacobs M, Hwang DR, Dunigan K, et al. (2003) Prediction of pathology and survival by FDG PET in gliomas. J Neurooncol 64: 227-237.
- Hanson MW, Glantz MJ, Hoffman JM, Friedman AH, Burger PC, et al. (1991) FDG-PET in the selection of brain lesions for biopsy. J Comput Assist Tomogr 15: 796-801.
- Levivier M, Goldman S, Bidaut LM, Luxen A, Stanus E, et al. (1992) Positron emission tomography-guided stereotactic brain biopsy. Neurosurgery 31: 792-797.
- Delbeke D, Meyerowitz C, Lapidus RL, Maciunas RJ, Jennings MT, et al. (1995) Optimal cutoff levels of F-18fluorodeoxyglucose uptake in the differentiation of low-grade from high-grade brain tumors with PET. Radiology 195: 47-52.
- Kim CK, Alavi JB, Alavi A, Reivich M (1991) New grading system of cerebral gliomas using positron emission tomography with F-18fluorodeoxyglucose. J Neurooncol 10: 85-91.
- Davis WK, Boyko OB, Hoffman JM, Hanson MW, Schold SC Jr, et al. (1993) [18F]2-fluoro-2-deoxyglucose-positron emission tomography correlation of gadolinium-enhanced MR imaging of central nervous system neoplasia. AJNR Am J Neuroradiol 14: 515-523.
- Go KG, Kamman RL, Mooyaart EL, Heesters MA, Pruim J, et al. (1995) Localised proton spectroscopy and spectroscopic imaging in cerebral gliomas, with comparison to positron emission tomography. Neuroradiology 37: 198-206.
- Francavilla TL, Miletich RS, Di Chiro G, Patronas NJ, Rizzoli HV, et al. (1989) Positron emission tomography in the detection of malignant degeneration of low-grade gliomas. Neurosurgery 24: 1-5.
- Langleben DD, Segall GM (2000) PET in differentiation of recurrent brain tumor from radiation injury. J Nucl Med 41: 1861-1867.
- Chao ST, Suh JH, Raja S, Lee SY, Barnett G (2001) The sensitivity and specificity of FDG PET in distinguishing recurrent brain tumor from radionecrosis in patients treated with stereotactic radiosurgery. Int J Cancer 96: 191-197.
- Kim S, Chung JK, Im SH, Jeong JM, Lee DS, et al. (2005) 11C-methionine PET as a prognostic marker in patients with glioma: comparison with 18F-FDG PET. Eur J Nucl Med Mol Imaging 32: 52-59.
- Colavolpe C, Metellus P, Mancini J, Barrie M, Béquet-Boucard C, et al. (2012) Independent prognostic value of pre-treatment 18-FDG-PET in high-grade gliomas. J Neurooncol 107: 527-535.
- Kubota R, Kubota K, Yamada S, Tada M, Ido T, et al. (1994) Active and passive mechanisms of [fluorine-18] fluorodeoxyglucose uptake by proliferating and prenecrotic cancer cells in vivo: a microautoradiographic study. J Nucl Med 35: 1067-1075.
- Miyagawa T, Oku T, Uehara H, Desai R, Beattie B, et al. (1998) "Facilitated" amino acid transport is upregulated in brain tumors. J Cereb Blood Flow Metab 18: 500-509.
- Sato N, Suzuki M, Kuwata N, Kuroda K, Wada T, et al. (1999) Evaluation of the malignancy of glioma using 11C-methionine positron emission tomography and proliferating cell nuclear antigen staining. Neurosurg Rev 22: 210-214.
- Kracht LW, Friese M, Herholz K, Schroeder R, Bauer B, et al. (2003) Methyl-[11C]- l-methionine uptake as measured by positron emission tomography correlates to microvessel density in patients with glioma. Eur J Nucl Med Mol Imaging 30: 868-873.
- Kinoshita M, Arita H, Goto T, Okita Y, Isohashi K, et al. (2012) A novel PET index, 18F-FDG-11C-methionine uptake decoupling score, reflects glioma cell infiltration. J Nucl Med 53: 1701-1708.
- Dowling C, Bollen AW, Noworolski SM, McDermott MW, Barbaro NM, et al. (2001) Preoperative proton MR spectroscopic imaging of brain tumors: correlation with histopathologic analysis of resection specimens. AJNR Am J Neuroradiol 22: 604-612.
- Alger JR, Frank JA, Bizzi A, Fulham MJ, DeSouza BX, et al. (1990) Metabolism of human gliomas: assessment with H-1 MR spectroscopy and F-18 fluorodeoxyglucose PET. Radiology 177: 633-641.
- McKnight TR, von demBussche MH, Vigneron DB, Lu Y, Berger MS, et al. (2002) Histopathological validation of a three-dimensional magnetic resonance spectroscopy index as a predictor of tumor presence. J Neurosurg 97: 794-802.
- Kroemer G, Pouyssegur J (2008) Tumor cell metabolism: cancer's Achilles' heel. Cancer Cell 13: 472-482.
- Oh J, Henry RG, Pirzkall A, Lu Y, Li X, et al. (2004) Survival analysis in patients with glioblastomamultiforme: Predictive value of choline-to-n-acetylaspartate index, apparent diffusion coefficient, and relative cerebral blood volume. J MagnReson Imaging 19: 546-554.
- Möller-Hartmann W, Herminghaus S, Krings T, Marquardt G, Lanfermann H, et al. (2002) Clinical application of proton magnetic resonance spectroscopy in the diagnosis of intracranial mass lesions. Neuroradiology 44: 371-381.
- Guillevin R, Menuel C, Duffau H, Kujas M, Capelle L, et al. (2008) Proton magnetic resonance spectroscopy predicts proliferative activity in diffuse low-grade gliomas. J Neurooncol 87: 181-187.
- Deviers A, Ken S, Filleron T, Rowland B, Laruelo A, et al. (2014) Evaluation of the lactate-to-N-acetyl-aspartate ration defined with magnetic resonance spectroscopic imaging before radiation therapy as a new predictive marker of the site of relapse in patients with glioblastomamultiforme. In J RadiatOncolPhys 90: 385-393.
- Raschke F, Fellows GA, Wright AJ, Howe FA (2015) (1) H 2D MRSI tissue type analysis of gliomas. MagnReson Med 73: 1381-1389.
- Li X, Jin H, Lu Y, Oh J, Chang S, et al. (2004) Identification of MRI and 1H MRSI parameters that may predict survival for patients with malignant gliomas. NMR Biomed 17: 10-20.
Tables and Figures at a glance
| Table 1 |
Figures at a glance
 |
 |
 |
| Figure 1 | Figure 2 | Figure 3 |
 |
 |
 |
| Figure 4 | Figure 5 | Figure 6 |
Relevant Topics
- Abdominal Radiology
- AI in Radiology
- Breast Imaging
- Cardiovascular Radiology
- Chest Radiology
- Clinical Radiology
- CT Imaging
- Diagnostic Radiology
- Emergency Radiology
- Fluoroscopy Radiology
- General Radiology
- Genitourinary Radiology
- Interventional Radiology Techniques
- Mammography
- Minimal Invasive surgery
- Musculoskeletal Radiology
- Neuroradiology
- Neuroradiology Advances
- Oral and Maxillofacial Radiology
- Radiography
- Radiology Imaging
- Surgical Radiology
- Tele Radiology
- Therapeutic Radiology
Recommended Journals
Article Tools
Article Usage
- Total views: 10211
- [From(publication date):
April-2016 - Jul 05, 2025] - Breakdown by view type
- HTML page views : 9363
- PDF downloads : 848
