Predicting Reservoir Performance Using the Elastic Properties of Well Logs in Fabi Field, Niger Delta Basin in Nigeria
Received: 15-Nov-2017 / Accepted Date: 26-Nov-2017 / Published Date: 30-Nov-2017 DOI: 10.4172/2157-7617.1000425
Abstract
In recent times, characterization of reservoir using elastic properties of the well logs is limited to discrimination of reservoir fluids and lithologies which do not precisely reflect reservoir characteristics. In this study, we propose a robust approach that uses the well log derived attributes to predict the effects of the production related changes and performance levels of the reservoirs. First, the elastic attributes were generated from the well logs using the transform menu of the E-log program. The appropriate pairs of the attributes were cross-plotted and color overlay of the most robust attributes established. The cross-plot of Lambda-Rho versus Mu-Rho revealed the gas charged sand, brine charged sand and streak of shale in HD5000 reservoir. The color overlay of the lambda-Rho showed very high degree of brine saturation and very low gas saturation. The cross plot of velocity ratio versus P-impedance in HD8000 reservoir revealed hydrocarbon charged sand which was associated with very low velocity ratio, acoustic impedance values and brine saturation. The color overlay of acoustic impedance showed very high hydrocarbon saturation and low brine saturation. The cross plot of Mu-rho versus density at HD9000 reservoir also revealed the hydrocarbon charged sand (very low-density values) and brine charged sand. The color overlay of density revealed relatively high hydrocarbon and low brine saturation. The high brine saturation in the reservoirs probably resulted from increase in formation water due to production and steam injection program which is an indication of reservoir depletion. However, the results indicate that HD8000 and HD9000 reservoirs are still active for more hydrocarbon production while HD5000 reservoir is not.
Keywords: Acoustic impedance; Cross plots; Lambdah-Rho; Mu-Rho; Velocity ratio
Introduction
In recent time, Niger Delta Basin has progressively become one of the prominent and mature oil and gas provinces in Africa. A massive exploration for hydrocarbon and productions in this basin has recorded huge successes. The production of the hydrocarbon in the wellbore are sometimes associated with production related changes that mostly result from water/steam injection, thermal heating, fracking, and natural gas re-injections. The idea is to reduce the viscosity of the hydrocarbons or increase the reservoir pressure drive so that hydrocarbons can flow easily into the wells for easy production. However, with constant exploitation of hydrocarbon in this manner, the wellbore may become saturated with injected floods, thus reducing the optimal productivity of the field. Our focus in this study is to image the effect of fluid flow saturations and predict the performance level of the reservoirs using well log attributes. The knowledge of wellbore performance is vital in well management and development strategy for overall improvement on the productive life of the field. The use of well log attributes offers good knowledge of physical properties of reservoir especially at the point of well locations. These attributes are generated from the well-logs and cross-plotted to interpret fluids and lithologies in the reservoirs. Goodway et al., highlighted relevance of well log attributes such as Lambda-Rho, Mu-Rho, Poison’s impedance, Pimpedance, S-impedance in reservoir analysis. They stated that Lamdo-Rho attributes give information about the reservoir pore fluids and distinguishes between gas and brine charged sands while Mu-rho gives a quantitative measure of the variations in rock matrics.
Depending on the sand quality, moderately consolidated clean saturated reservoir sand formations exhibit relatively high Mu-rho due to their high resistance to shearing while unconsolidated clean saturated reservoir formations exhibit low Mu-rho values. Quakenbush and Tuttle [1] introduced the concept of the Poison’s impedance attributes, which they described as the difference between Pimpedance and scaled S- impedance arising from the difference of the two squares of Lambda-rho (λρ) attributes. They conclude that Poison’s impedance is a good discriminator of the fluids with higher sensitivity more pronounced in gas than oil effects. Different researchers have used the different approaches similar to that of Goodway et al., method to derive the relationship between lithology and fluids in the reservoir using λ-μ-ρ technique [2-8].
In this study, the well log derived attributes were integrated to monitor the production process and performance stages of the three defined reservoirs. This is hoped to rekindle proactive measures in well management and development.
Location and geologic setting
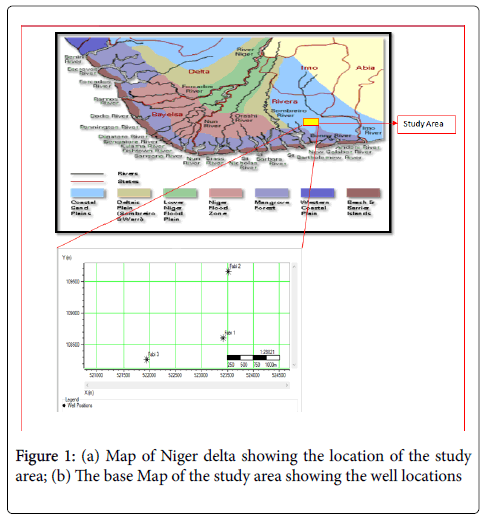
Fabi Field is located at about 40 km south-east of Port Harcourt, Rivers state in the Niger Delta Basin of Nigeria (Figure 1). The Fabi Field is situated in Onshore depo-belt of Niger Delta. The Niger Delta is one of the most prominent basins in West Africa, situated on the continental margin of the Gulf of Guinea in equatorial West Africa, at the southern end of Nigeria, bordering the Atlantic Ocean between latitudes 3° and 6°; and longitude 5° and 8° [9]. The northern boundary is the Benin Flank, an east-northeast trending hinge line south of the West Africa basement massif. The north-eastern boundary is defined by the outcrops of the cretaceous on the Abakaliki high and south east by the Calabar flank, a hinge line bordering the adjacent Precambrian [10]. The offshore boundary of the Niger delta is defined by the Cameroun volcanic line to the east, the eastern boundary of the Dahomey basin. The sedimentary basin of the Niger Delta encompasses a very large region than the geographical extent of the modern delta as evidenced by the Niger- Benue drainage system [11]. It includes Cross river delta and extends eastwards into the continental margins of neighbouring Cameroon and Equatorial Guinea [12].
Methodology
The first step in the method used in this study was to edit and condition the well logs using media filtering correction of E-log program. This removes or smoothen the anomalous spikes in the well logs initiated by high frequency noise or error in equipment. The second vital step was to generate the missing well logs needed for the study using appropriate transform equations. For instance, shear wave logs were not available, but they were generated using Castagna’s relations which apply linear transform to input P-wave log. Gardner’s relation was used to derive density logs.
With appropriate well logs obtained, elastic well log attributes were generated using E-log transform menu. Horizons were defined in the three reservoirs (HD5000, HD8000 and HD9000) that are undergoing productions. The appropriate pair of generated elastic attributes (Lambda (λ), Mu (μ) –Rho, density (ρ), P-impedance, S-impedance, Vp/Vs ratio etc.) was cross-plotted at each reservoir interval. The cluster populations of the cross-plots and the attribute cross sections were analyzed to ascertain the level of the reservoir lithology variations, water saturation and their overall performances.
Results And Discussion
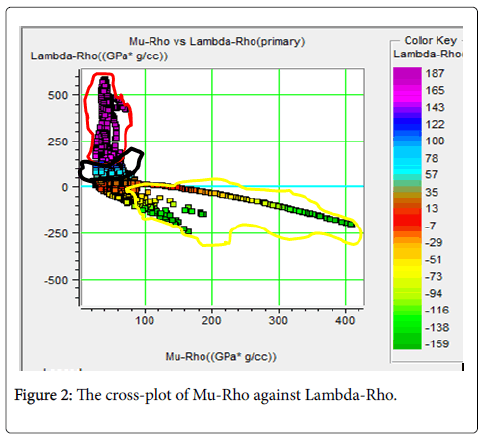
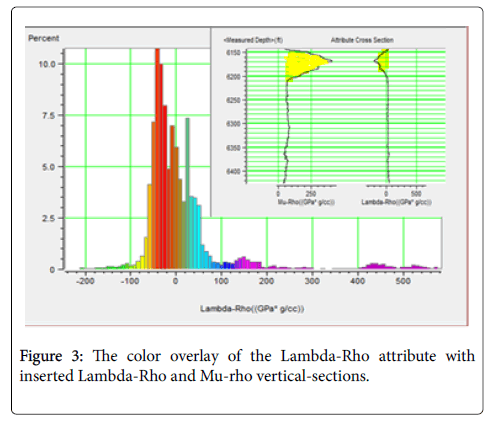
The cross-plot of Lambda-Rho versus Mu-Rho in HD5000 reservoir discriminated fluids and lithology (Figure 2). The red circle is shale zones which are associated with very high Lambda-Rho values and very low Mu-Rho values; the black circle are brine- charged zones while the yellow circle are interpreted as gas-charged zones with a very low Lambda-Rho values (high Mu-Rho values). The color overlay of the Lambdah-Rho shows the percentage of lithologcal and fluid distribution within the reservoir (Figure 3). The blue color band which represents the brine saturation is about 75% while the gas saturation in yellow and green color bands has about 27% saturation. High percentage of brine saturation in the reservoir is an indication of production related effects. This is because as production increases in the reservoir, hydrocarbon saturation decreases while water saturation increases.
However, the Lambda-Rho and Mu-Rho cross-sections show that increase in Lamda-Rho results in a decrease in Mu-Rho values. Lambda-Rho is more robust in reflection curves than Mu-Rho thus making it a better fluid discriminator than Mu-Rho. Mu-Rho is insensitive to fluid saturant but they are considered as matrix indicator. Sand has a very high Mu-Rho response of about 400Gpa*g/cc (Figure 2). This is because the sand matrix especially quartz has very high rigidity. The cross plot of Lambda-Rho and high Mu-Rho suggests the presence of gas sand in HD5000 reservoir.
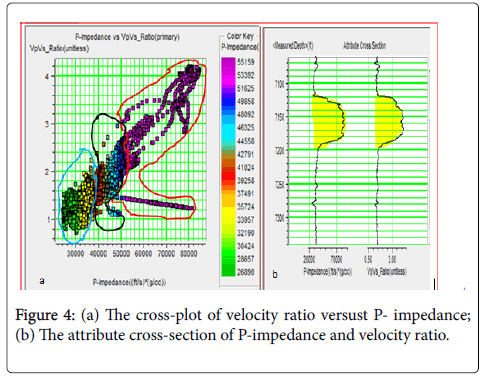
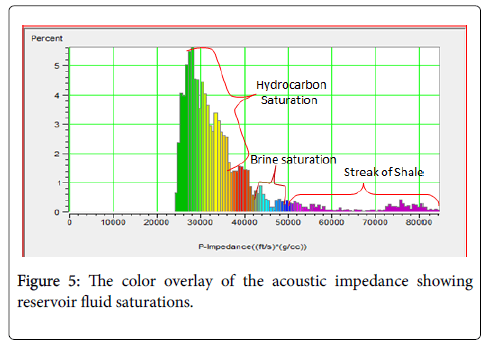
The cross plot of velocity ratio versus P-impedance in HD8000 reservoir has revealed the fluid and lithology distributions in the reservoir. Using the acoustic impedance as color code, the cluster population shows three major acoustic impedance zones that were interpreted as shale, brine and hydrocarbon zones (Figure 4a). The red enclosure with very high acoustic impedance values are shale zones. The black enclosure with blue color band (relatively high acoustic impedance values) is a brine saturated zones while the blue enclosure with very low acoustic impedance values is hydrocarbon saturated zones. The cross-plot clusters of velocity ratio and acoustic impedance have a linear relationship which signifies that both attributes may have the same response to fluid and lithology. The cross section of the both attributes showed that Low acoustic impedance values correspond to low velocity ratio (Figure 4b). The low acoustic impedance zones were divided into yellow color band (gas dominated zones) and green color band (oil dominated zones). The color overlay exhibit very high percentage of hydrocarbon saturation with little brine saturation and streak of shale (Figure 5). The reservoir has very low brine saturation which is an indication that it has not undergone excessive hydrocarbon exploitation. This was validated by massive low acoustic impedance values in the reservoir. Hydrocarbon charged sand is associated with low acoustic impedance values while brine charged sand showed relatively high acoustic impedance values. Shale shows very high acoustic impedance, density, and low Mu-Rho values.
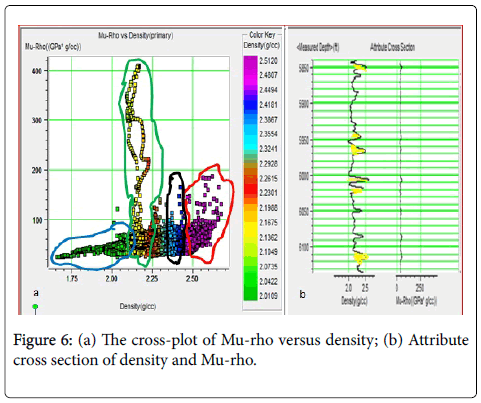
The cross plot of Mu-rho versus density at HD9000 reservoir also discriminate fluid and lithology (Figure 6a). The hydrocarbon charged sand is associated with very low-density values (blue enclosure). Brine charged sand is associated with relatively high-density values (black enclosure) while shale shows very high-density values (red enclosure).
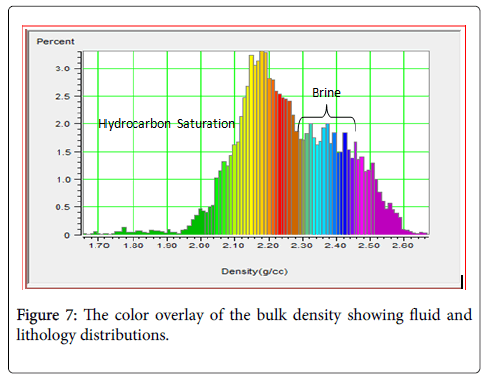
The cross-sectional plot of the density and Mu-Rho showed that density has a stronger reflection curve than Mu-Rho curve (Figure 6b). This suggests that density is a better fluid and lithology discriminator. The density color overlay exhibit relatively high hydrocarbon and brine saturation with little streak of shale. The high brine saturation in this reservoir is an indication of production related changes. Very high production related effect was evident in HD5000 reservoir. The reservoir shows high brine saturation and very low hydrocarbon saturation. The HD8000 reservoir revealed a very high hydrocarbon saturation and very low brine saturation. HD9000 reservoir also showed relatively high hydrocarbon and brine saturation. The high brine saturation is an indication of reservoir hydrocarbon depletion. This is because as production increases, the trapped hydrocarbon in the reservoirs decreases thus leaving behind formation water. The increase in formation water saturation could also arise from water/ steam injection program in the field. The enhanced oil recovery is basically undertaken to reduce the viscosity of the hydrocarbon in the pore spaces for easy movement into the wellbore. Sometimes, because of the heterogeneity of the reservoirs, it is often difficult to know the direction of water/steam flow. They can be left in the ground, or channeled inefficiently along high permeability zones, thus leaving substantial parts of the reservoir saturated with water. However, based on the above observations, HD8000 and HD9000 reservoirs are still active for more hydrocarbon production while HD5000 reservoir is not (Figure 7).
Conclusion
The prediction of performance level of the reservoirs using well log attribute was successfully carried out in Fabi Field Onshore Niger Delta. Different well log attributes were derived, and appropriate pairs of these attributes were cross-plotted along the reservoir intervals. The cross-plot population provides a direct interpretation of the reservoir features. Different reservoir fluid types such as oil, gas, brine and lithologies were revealed. The color overlay plot of the attributes revealed the effect of the production induced changes and performance levels of each reservoir. The HD5000 reservoir exhibit high rate of hydrocarbon depletion and brine saturation. The increase in brine saturation in the reservoir is an indication of decline in reservoir performance. The HD9000 and HD 8000 reservoirs showed high hydrocarbon saturation and very low brine saturation. Further production activities should target these two reservoirs because of their potentials for better performance.
References
- Ekwe AC, Onuoha KM, Osayande N (2012) Fluid and lithology discrimination using rock physics modelling and lambdamurho inversion: An example from onshore Niger Delta, Nigeria Search and Discovery Article 3-4
- Goodway WT, Downton J (1997) Improved AVO fluid detection and lithology discrimination using Lamés petrophysical parameters: fluid stack’ from P and S Inversions: SEG Annual Meeting Expanded Technical Program Abstracts with Biographies 67: 183-186
- Gray FD, Andersen EC (2000) The application of AVO and inversion to the estimation of rock properties: CSEG Recorder 26: 36-39
- Reijers TA (2011) Stratigraphy and sedimentology of the Niger Delta. Geologos 17: 133–162
- Obiekezie TN (2014) Hydrodcarbon exploration in ondo Field in the Niger Delta Basin Nigeria, Using a three-Dimensional seismi creflection survey. Scienttific Research and Essays 6: 778-784.
- Short KC, Stauble AJ (1967) Outline of geology of Niger Delta. AAPG Bull 51: 761-779
- Ujuanbi JC, Jegede SI (2008) Lambda-Mu-Rho techniques as a viable tool for litho-fluid discrimination-the Niger Delta example: International Journal of Physical Sciences 2: 173-176.
- Obeng MC (2015) Lithology and pore fluid prediction of a reservoir using density, Compressional and shear wave logs: a case study of the tano basin. Thesis: 25-29
- Quakenbush M, Tuttle C (2006) Poissons impedance. The leading edge 128-138
- Bello R, Igwenagu CL, Onifade Y (2015) Cross plotting of rock properties for fluid and lithology discrimination using well data in a Niger delta oil field. Journal of Applied Sciences and Environmental Management 19: 3
- Aniwetalu EU, Anakwuba EK (2015) Quantitative characterization of groundroll (Rayleigh Waves) in the Western Niger Delta, Nigeria. Archives of Applied Science Research 4: 7-15
- Sayers C, Chopra S (2009) Special session: Rock physics: The Leading Edge pp: 15-16.
Citation: Adewale AO, Adepoju KA, Awotoye OO (2017) Mapping and Assessing Impervious Surface Areas and Urban Heat Island in Osogbo, Nigeria. J Earth Sci Clim Change 8: 424 DOI: 10.4172/2157-7617.1000425
Copyright: © 2017 Adewale AO. This is an open-access article distributed under the terms of the Creative Commons Attribution License, which permits unrestricted use, distribution, and reproduction in any medium, provided the original author and source are credited.
Share This Article
Recommended Journals
Open Access Journals
Article Tools
Article Usage
- Total views: 4573
- [From(publication date): 0-2017 - Apr 02, 2025]
- Breakdown by view type
- HTML page views: 3694
- PDF downloads: 879

