Potential Source Rock of Albian of the Benin Coastal Sedimentary Basin.
Received: 20-Jul-2018 / Accepted Date: 11-Sep-2018 / Published Date: 19-Sep-2018 DOI: 10.4172/2472-0518.1000155
Keywords: Albian sediment; Coastal sedimentary basin of Benin; Gamma ray; Pyrolysis Rock-Eval6; Source rock
Introduction
The coastal sedimentary basin of Benin is one of the Dahomey Embayment basins, a petroleum province where exploration activities have been conducted for decades. The seismic and drilling carried out allowed a best knowledge of the petroleum geology of this province. After the discovery and exploitation of some oil field in the Upper Cretaceous formations interest was extended to Lower Cretaceous deposits in the Embayment coastal basins. In the Benin coastal sedimentary basin, well tests carried out in Albian deposits (Lower Cretaceous) proved to be positive and made it possible to envisage the existence of an petroleum system of lower Cretaceous age. Thus, the present study, based on log petrographic and geochemical analyzes of rock samples aims to highlight the particularities and potential source rocks of the offshore Albian formation of the Benin coastal sedimentary basin.
Presentation of the Coastal Basin of Benin
Geographical setting
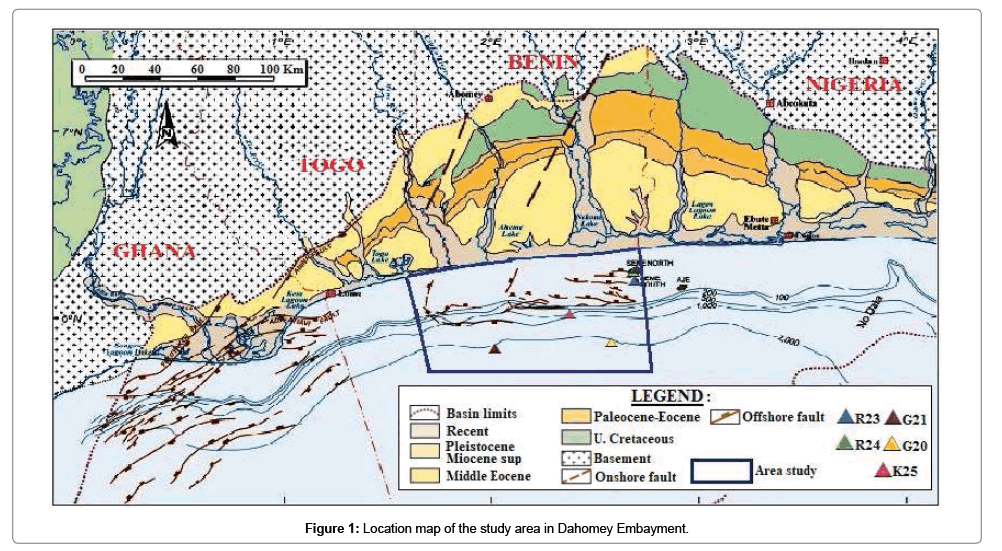
The study area lies between parallels 5°45’ and 6°10’ North latitude and meridians 1°55’ and 3°00’ East longitude (Figure 1) and covers a portion of the offshore of the coastal sedimentary basin of Benin whose area is about 40102 km2 [1].
Lithostratigraphy of the basin
The lithostratigraphy of the formations of the coastal sedimentary basin of Benin reflects the different phases of the tectono-sedimentary development of the basin which is closely linked to the opening of the South Atlantic. This opening can be subdivided into four (04) phases [2-8].
• Early rift doming stage: Late Jurassic to Early Neocomian
• Intracontinental rift stage: Neocomian (?) to Early Cretaceous
• Intermediate proto oceanic transitional stage: Cenomanian to Santonian.
• And drift stage that lasted from Maastrichtian to the Holocene.
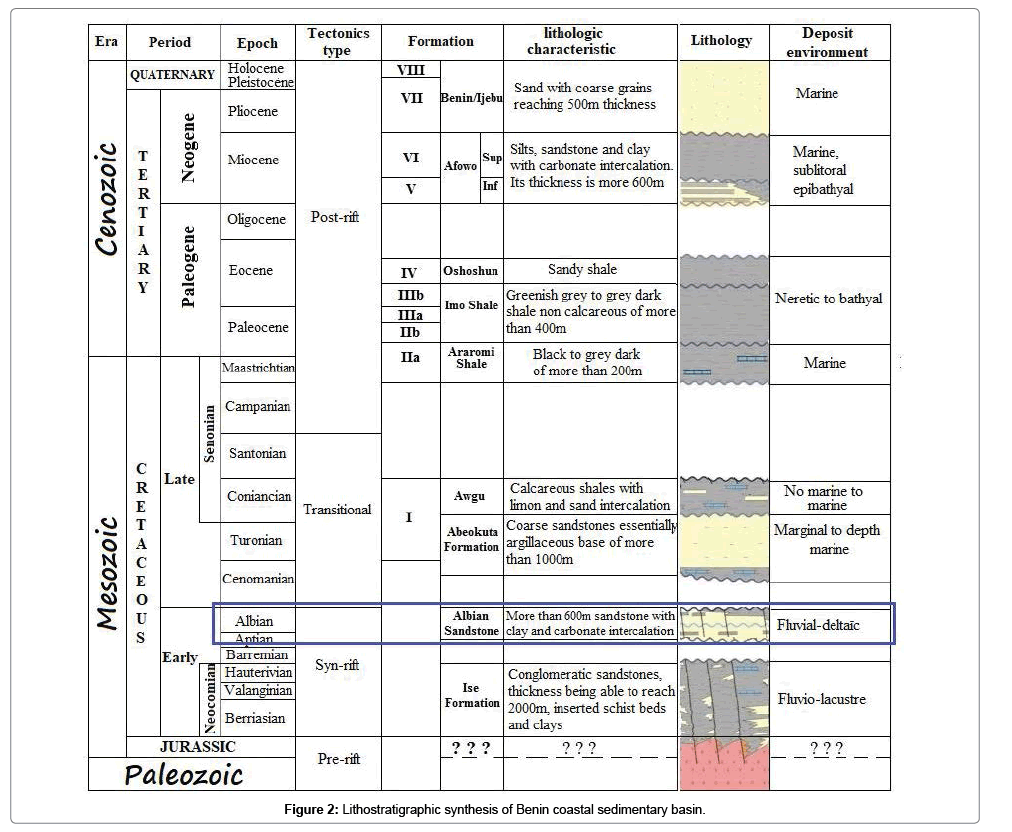
The lithostratigraphic synthesis of the Benin coastal sedimentary basin presented in Figure 2 shows that it contains formations of age from lower Cretaceous to Quaternary and that the Albian formation rest in discordance of gullying on formation Ise [9-16]. The Albian sediments studied in this work took place towards the end of the rifting stage which is characterized by the formation of asymmetric horsts and grabens and remarkable thermal subsidence [17-20]. During this stage, several hundred meters of predominantly continental Jurassic and Early Cretaceous sediments took place [18-22].
Methodology
Equipment
The bulk of the material used for this study consists of gamma ray digital data and thirty-five (35) rock samples from five oil wells (R23, R24, K25, G20 and G21). Samples consisting of cores and debris were made of thin sections for polar microscopic observation and Rock-Eval geochemical analyzes in the petrology and geochemistry laboratories of the State University of Moscou.
Method
The methodological approach adopted consisted at first in the choice of five wells having penetrated or traversed the Albian formation. Then, diagraphic logs were constructed from gamma ray data and interpreted. Finally, clay samples are taken from each well at the clay intervals for petrographic study (observation of thin sections with a polarizing microscope) and geochemistry analysis (Rock-Eval pyrolysis).
Interpretation of logs: The determination of the lithology that led to the lithological sections of the Albian formation from gamma ray (GR) data is based on the method defined by Serra [23]. According to this, for a GR record of which 200 API is 100% clay, the order of magnitude of natural radioactivity is 10-80 API for sands; 80-100 API for calcareous clayey sandstone; 100-200 API for clays. In general, the high values of GR indicate the clay levels and the lower ones the sandy levels ones.
Petrographic study of the samples - Realization and observation of thin sections: Samples of cores and some cuttings were used to make thin sections using the conventional method [24]. These samples were described under a very high enlargment polarizing optical microscope with microphotographs. The objective of this study is the determination of the detrital or carbonate nature of the samples whose oil potential we estimate. The focus is on the granularity and organic matter content of the sampled levels (Figure 3).
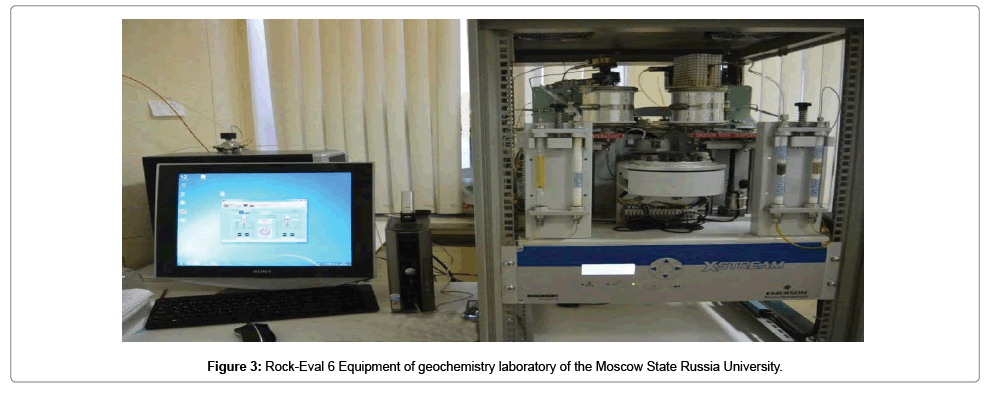
Pyrolysis procedure: As a prelude to the analysis, the samples were crushed and cleaned and then dried in a steamroom for half a day at 45°C. After drying, they were sieved and stripped of metal debris generally from drilling tools using a magnetic device. In accordance with the standard Rock-Eval 6 procedure [25-29] for each sample, 100 mg of rock were heated for three quarters of the time hours under inert gas (helium). The pyrolysis was conducted in a programmed temperature increase regime of 25°C/min from 300°C to 800°C. Also, pyrolytic parameters such as Tmax, S1; S2; S3; S4 were determined. They were used to calculate parameters such as TOC; IH; IO; IP; PP..., very essential for the characterization of source rocks. The results obtained were interpreted using the interpretation guide presented in Table 1 [30,31].
| Quantity | TOC (%) | S1 (mg HC/g TOC) | S2 (mg HC/g TOC) |
|---|---|---|---|
| Poor | <0.5 | <0.5 | <2.5 |
| Fair | 0.5-1 | 0.5-1 | 2.5-5.0 |
| Good | 01-Feb | 01-Feb | 05-Oct |
| Very good | 02-Apr | 02-Apr | Oct-20 |
| Excellent | >4 | >4 | >20 |
| Quality | HI (mg HC/g TOC) | S2/S3 | Kerogen type |
| None | <50 | <1 | IV |
| Gas | 50-200 | 01-May | III |
| Gas and Oil | 200-300 | 05-Oct | II/III |
| Oil | 300-600 | Oct-15 | II |
| Oil | >600 | >15 | I |
| Maturation | R0 (%) | Tmax (°C) | TAI |
| Immature | 0.2-0.6 | <430 | 1.5-2.6 |
| Early mature | 0.6-0.65 | 430-440 | 2.6-2.7 |
| Peak mature | 0.65-0.9 | 440-450 | 2.7-2.9 |
| Late mature | 0.9-1.35 | 450-470 | 2.9-3.3 |
| Post mature | >1.35 | >470 | >3 |
Table 1: Interpretive Guidelines for the quantity, quality and maturation of a rock.
Results
Lithological characteristics of the Albian formation
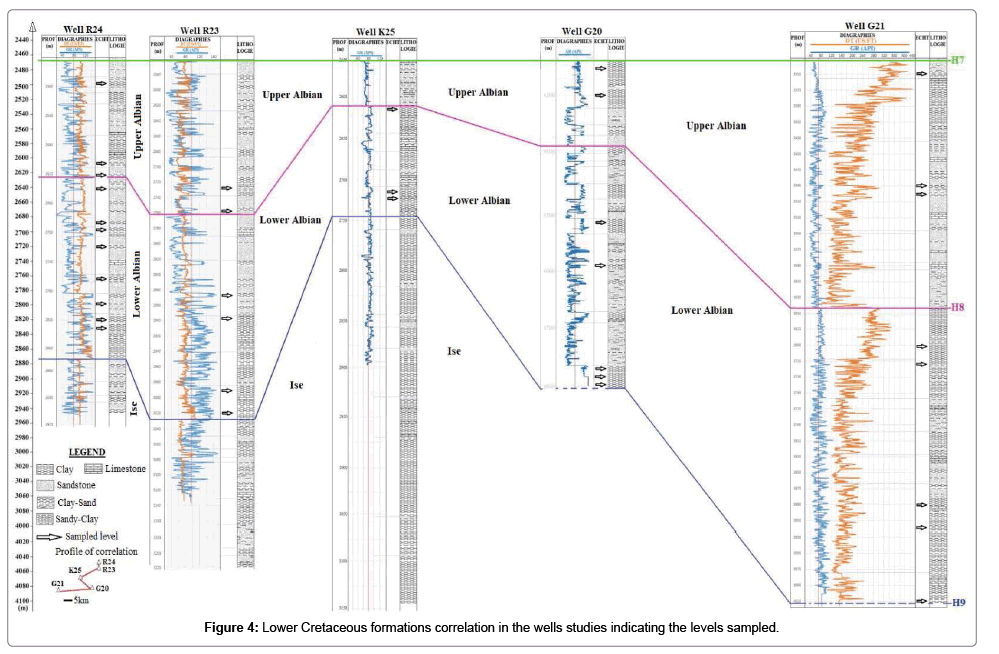
The Albian formation, included between the seismic horizons H7 and H9, rests in unconformity of gully on the Ise formation. Its drilled thickness varies from 190m (K25 well) to 690m (G21 well). It is equal to 466m, 405m and 560m respectively in the wells R23, R24 and G20. However, it should be noted that the wells G20 and G21 have not reached its wall.
The analysis of the well-well correlation presented in Figure 4 shows that the Albian formation, subdivided into two members of different logging characteristics, thickens as a whole from the coast to the sea even if there is a narrowing between the wells R23 and K25. The log signature analysis of each of the wells shows that the lower member of the formation between the seismic horizons H8 and H9 is, as a whole, mostly sandstone. Its base at wells R24 and R23 is characterized by a thick clay layer indicated by high values of gamma ray. Indeed, the interval from 2870 to 2790m at the level of the R24 well is marked by gamma ray deflections with high values ranging from 50 to 146 API whereas at the well R23, the interval between 2884 and 3026.5m is characterized by high frequency deflections and high GR values of up to 174.33 API. In the wells K25, G20 and G21, the clay layer is also observed with a smaller thickness at the K25 well. Unlike the lower member, the upper member, limited by the seismic horizons H7 and H8 is less thick. It’s characterized by an alternation of clayey and sandstone layer of variable thickness, interposed in places of carbonate laminae. These characteristics are indicated at wells R24 and R23, G21 by high frequency deflections and low to medium gamma ray values. At the R24 well, the gamma ray values of the upper member of the Albian formation ranged from 28 to 146 API with few values above 80 API (average value of gamma ray). It is the same at the well G21 where the values are between 29.61 and 90 API. Also, in the R23 well, the lowest values of gamma ray are registered (20.08API) with a few that reach 120 APIs. Contrary, in the K25 well, the gamma signature indicates that the upper member is essentially sandy, whereas at the well G20, it is more clayey as indicated by the high values of the gamma recording.
From this analysis of the Albian formation lithology, it appears overall that it presents a variation of the lithological characteristics as well according to the depth as of the North towards the South.
Petrographic characteristics of the Albian formation
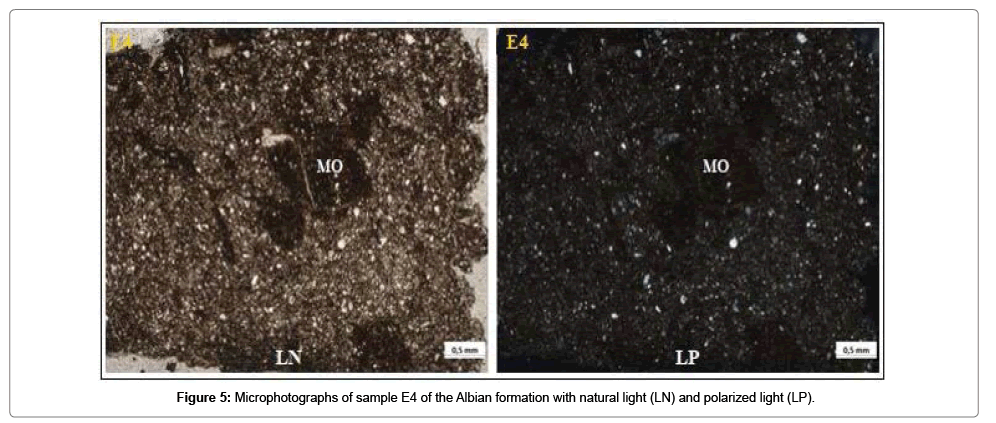
The thin section of the E4 sample from the Albian formation has a silty-clayey rock, fine-grained, poorly sorted with a average diameter of 0.05-0.065 mm (Plate1). The silty material, associated with debris of variable sizes (0.02 to 0.12 mm) occupies a percentage of 50 to 55%. The clayey cement rich in organic matter contains small crystals of quartz feldspar and flakes of micas (Figure 5).
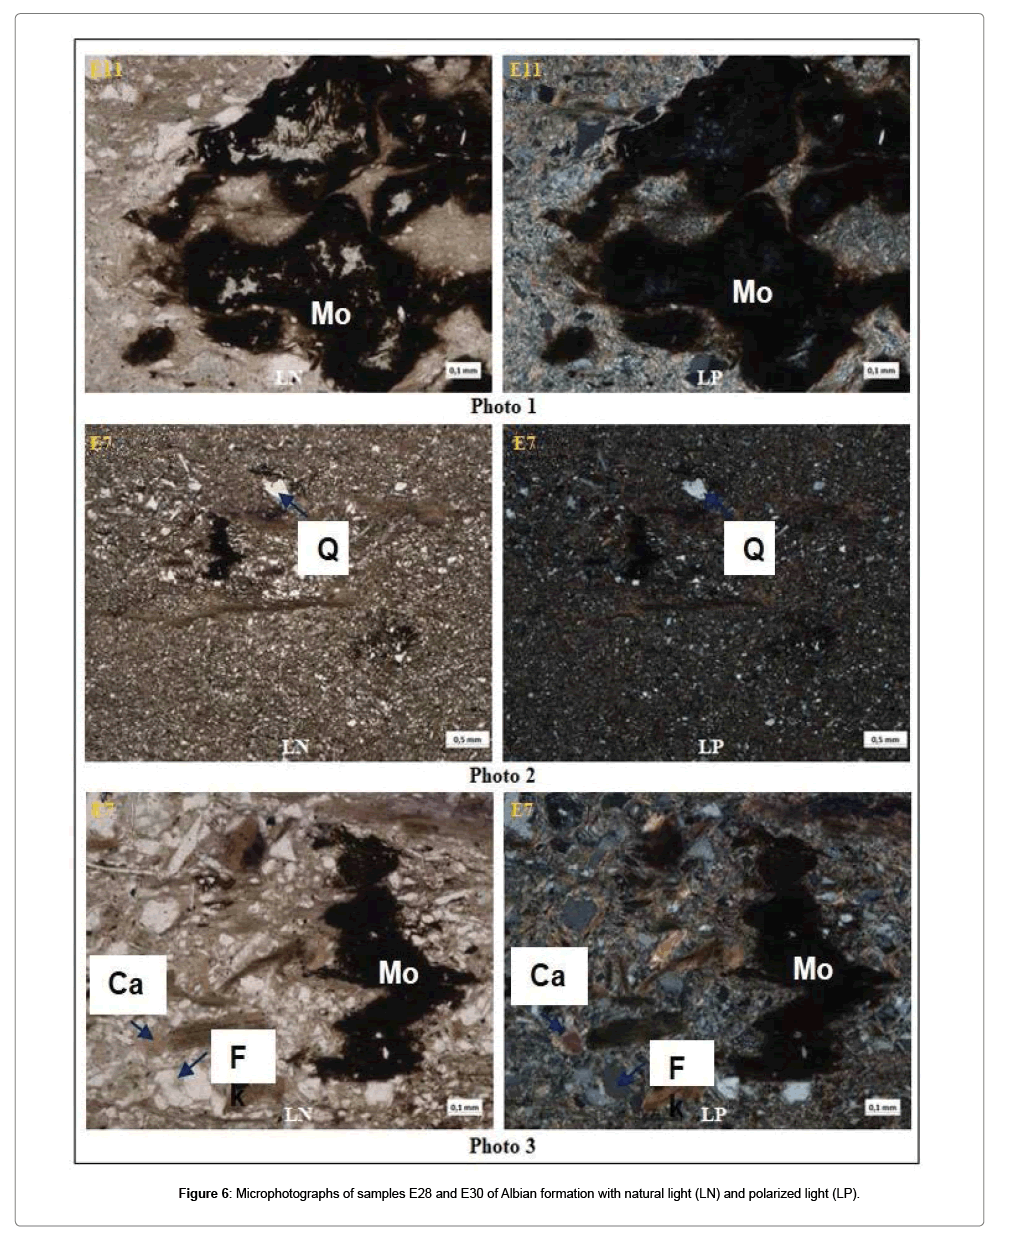
Sample E11 taken at 2648 m is a silty-sandy red rock with pockets of organic matter (Photo1/E11 Plate 3). The crystals are rounded to sub-rounded and occupy a percentage of 30 to 50%. This rock consists mainly of quartz, potassium feldspar, biotite and accessorily sphene, zircon. The authigenic minerals are chlorite and glauconite.
Plate 3 below shows different photomicrographs of samples E11 and E7. The analysis of these photomicrographs shows that it consists of a sample consisting of silt (photo1) and a mixture of silty and psammitic material (photo2/E7 plate3) with areas soaked in organic matter (photo3/E7 planche3). Detrital particles rarely sub-rounded and between 0.01 mm and 0.2 mm in size are poorly sorted. The dominant minerals are quartz (75%), potassic feldspar (10%) and micas (15%), accessorily. it contains zircon and authigenic minerals such as chlorite and pyrite.
From the microscopic study of the thin sections made from the samples of the Albian formation, these samples are mostly clayey silts (E7 and E10) and clay rich in quartz crystals (E4) while the gamma ray data indicated purely clay levels. These samples are also rich in organic matter (Figure 6).
Hydrocarbon potential of the Albian formation
Table 2 presents the summary of the results resulting from the geochemical analysis of thirty-five (35) samples of argillaceous levels of the Albian formation by pyrolysis Rock-Eval.
| Well | Code/Depth (m) | Type | Mesuared parameters | Calculated parameters | |||||||
|---|---|---|---|---|---|---|---|---|---|---|---|
| S1 (mg HC/g rock) | S2 (mg HC/g rock) | Tmax (°C) | S3 (mgCO2/g rock) | TOC (%) | PI | S2/S3 (%) | HI (mg HC/g TOC) | OI (mg CO2/g TOC) | |||
| E1 (2730) | Cuttings | 0.47 | 1.69 | 425 | 1.03 | 5.91 | 0.22 | 1.64 | 29 | 17 | |
| E2 (2760) | Cuttings | 0.45 | 3.09 | 427 | 1.45 | 5.23 | 0.13 | 2.13 | 59 | 28 | |
| E3 (2865) | Cuttings | 0.57 | 5.89 | 432 | 1.72 | 6.98 | 0.1 | 3.42 | 84 | 25 | |
| R23 | E4 (2890) | Cuttings | 0.56 | 4.65 | 429 | 1.65 | 6.5 | 0.11 | 2.81 | 72 | 25 |
| E5 (2990) | Cuttings | 0.12 | 4.05 | 458 | 0.27 | 3.4 | 0.03 | 15 | 119 | 8 | |
| E6 (3020) | Cuttings | 0.09 | 4.43 | 459 | 0.31 | 3.56 | 0.02 | 14.29 | 124 | 9 | |
| E7 (2480) | Carotte | 0.09 | 0.24 | 359 | 0.07 | 0.15 | 0.27 | 3.43 | 160 | 47 | |
| E8 (2490) | Cuttings | 5.11 | 8.52 | 425 | 1.68 | 7.64 | 0.4 | 5.07 | 112 | 22 | |
| E9 (2610) | Cuttings | 5.77 | 7.37 | 434 | 0.71 | 2.28 | 0.44 | 10.38 | 323 | 31 | |
| E10 (2620) | Cuttings | 2.12 | 9.17 | 431 | 1.2 | 5.94 | 0.19 | 7.64 | 154 | 20 | |
| E11 (2648) | Carotte | 0.55 | 0.49 | 321 | 0.12 | 0.27 | 0.53 | 4.08 | 182 | 44 | |
| E12 (2690) | Cuttings | 0.67 | 5.82 | 431 | 1.3 | 8.44 | 0.1 | 4.48 | 69 | 15 | |
| R24 | E13 (2720) | Cuttings | 0.34 | 5.48 | 439 | 0.71 | 1.91 | 0.06 | 7.72 | 287 | 13 |
| E14 (2760) | Cuttings | 0.31 | 9.19 | 465 | 0.5 | 3.84 | 0.03 | 18.38 | 239 | 16 | |
| E15 (2800) | Cuttings | 0.37 | 9.11 | 453 | 0.64 | 4.22 | 0.04 | 14.23 | 216 | 15 | |
| E16 (2820) | Cuttings | 0.29 | 11.06 | 452 | 0.62 | 4.59 | 0.03 | 17.84 | 241 | 14 | |
| E17 (2830) | Cuttings | 0.27 | 10.45 | 456 | 0.58 | 5.32 | 0.03 | 18.02 | 196 | 11 | |
| E18 (2610-2620) | Cuttings | 0.79 | 6.2 | 429 | 0.61 | 4.97 | 0.11 | 10.16 | 125 | 12 | |
| K25 | E19 (2710-2720) | Cuttings | 0.95 | 10.12 | 436 | 0.75 | 6.07 | 0.09 | 13.49 | 167 | 12 |
| E20 (2740-2750) | Cuttings | 0.34 | 9.13 | 436 | 0.79 | 5.5 | 0.04 | 11.56 | 166 | 14 | |
| E21 (3310) | Cuttings | 0.72 | 5.37 | 427 | 1.43 | 1.77 | 0.12 | 3.76 | 303 | 81 | |
| E22 (3490) | Cuttings | 0.06 | 0.62 | 439 | 0.34 | 0.55 | 0.1 | 1.82 | 113 | 181 | |
| E23 (3500) | Cuttings | 3.25 | 5.34 | 426 | 1.05 | 1.54 | 0.38 | 5.1 | 347 | 68 | |
| E24 (3690) | Cuttings | 0.18 | 3.37 | 438 | 0.24 | 1.12 | 0.05 | 14.04 | 301 | 21 | |
| G21 | E25 (3720) | Cuttings | 0.18 | 2.28 | 440 | 0.77 | 0.63 | 0.07 | 2.96 | 362 | 123 |
| E26 (3890) | Cuttings | 0.1 | 0.92 | 435 | 0.38 | 0.54 | 0.1 | 2.42 | 170 | 70 | |
| E27 (3920) | Cuttings | 0.1 | 0.7 | 440 | 0.33 | 0.43 | 0.13 | 2.12 | 163 | 77 | |
| E28 (4010) | Cuttings | 0.27 | 1.19 | 439 | 0.24 | 0.46 | 0.18 | 4.96 | 259 | 52 | |
| E29 (4200) | Cuttings | 0.38 | 7.04 | 428 | 1.78 | 2.15 | 0.05 | 3.96 | 327 | 83 | |
| E30 (4300) | Cuttings | 0.86 | 6.85 | 437 | 1.57 | 2.63 | 0.11 | 4.36 | 260 | 60 | |
| E31 (4521) | Carotte | 0.16 | 3.31 | 458 | 0.09 | 2.43 | 0.05 | 36.78 | 136 | 4 | |
| G20 | E32 (4581) | Carotte | 0.12 | 1.69 | 454 | 0.15 | 1.61 | 0.07 | 11.27 | 105 | 9 |
| E33 (4770) | Cuttings | 0.86 | 6.83 | 436 | 1.37 | 1.93 | 0.11 | 4.99 | 354 | 71 | |
| E34 (4785) | Carotte | 0.13 | 7.19 | 460 | 0.09 | 4.57 | 0.02 | 79.89 | 157 | 2 | |
| E35 (4800) | Cuttings | 4.09 | 7.55 | 440 | 1.15 | 3.19 | 0.35 | 6.57 | 237 | 36 | |
Table 2: Rock-Eval parameters of Albian formation samples.
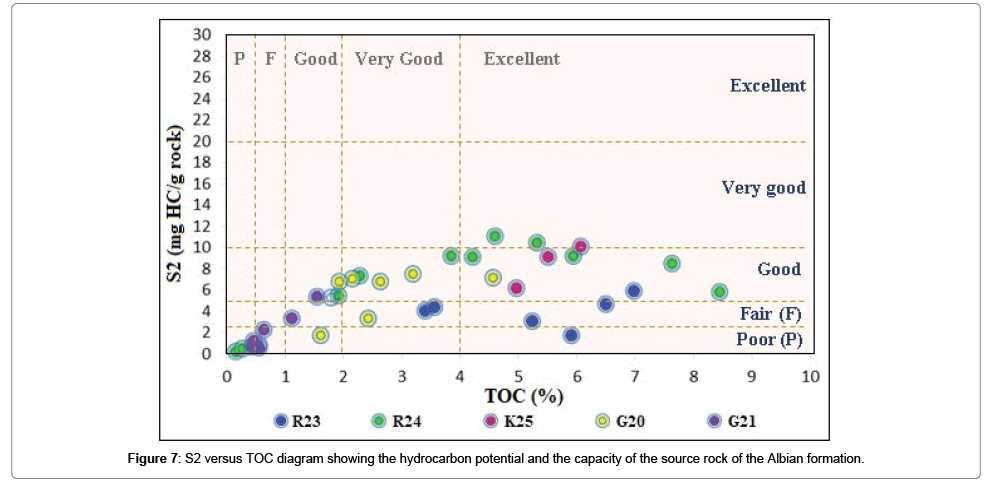
Petroleum potential of the Albian formation: The combined analysis of the TOC and S2 values (Table 2) shows that most of the samples from the wells R23. R24. K25 and G20 have their TOC greater than 2% and their S2 exceeding 5 mgHC/g rock, testifies to the high oil potential of the clay levels of the Albian formation. On the other hand some samples from well G21 (E21 and E23) and from well G20 (E33) have TOC values (less than 2%) and S2 (more than 3 mgHC/g rock) which indicates a good oil potential. Other samples (E22, E25, E26, E27 and E28) are characterized by low TOC values (less than 1% and greater than 0.5%). indicating their low potential. As for samples E7, E11 and E28 characterized by low TOC values (less than 0.5%) and S2 (below 1.35 mgHC/g rock) are not source rocks. In a general way, it comes out from this analysis that the Albian formation has a good to very good oil potential as shown in Figure 7.
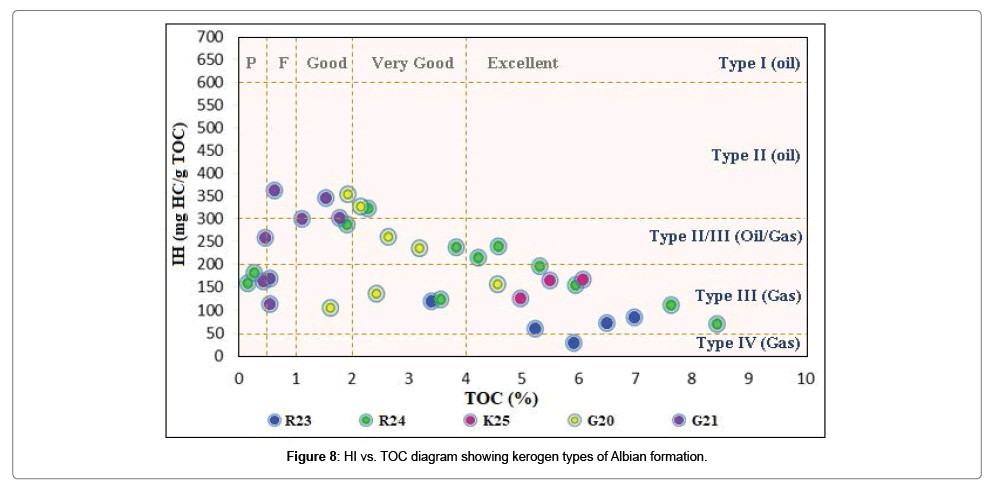
Type of organic matter: A comparative analysis of the Hydrogen Index (HI) and Total Organic Carbon (TOC) values for the majority of samples shows that the Albian formation contains types III, II/ III and II kerogen (Table 2). Only the sample E1 of the well R23 indicate by its value of the Hydrogen Index (less than 50 mg HC/g TOC), the presence of kerogen type IV. However, the analysis of the diagram, Figure 8 shows a dominance of kerogen types III and II/III.
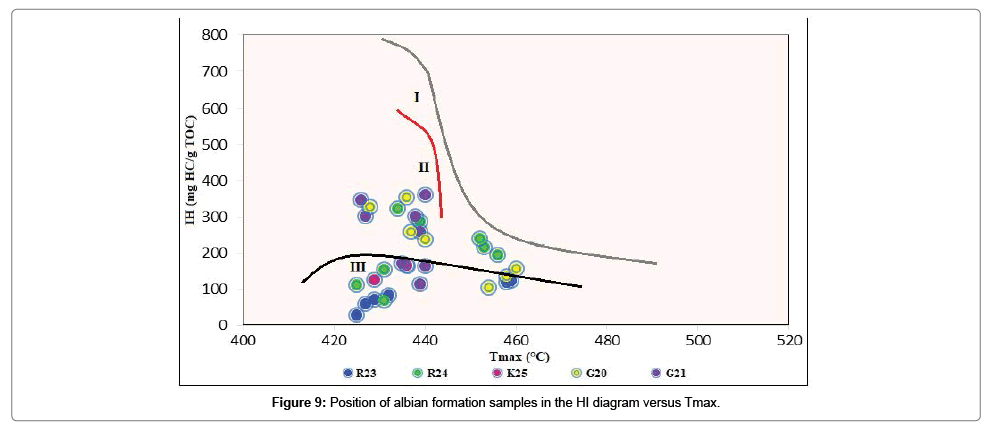
Thermal maturity of organic matter: The kerogen evidenced in the analyzed samples being mostly of types III and II, the maturity of the organic matter is indicated by a value of Tmax higher than 430°C. Thus, the overall analysis of the different values of Tmax obtained shows that apart from a few samples of the wells R23, R24, K25, G20 and G21 whose Tmax values vary from 321 (E11) to 429°C (E18), all other samples are above 430°C and between 431 and 465°C indicating early to late maturity of the organic material in the samples. Moreover, the majority of the samples of the latter category have a Tmax between 440 and 450°C corresponding to a high maturity of the Albian. Also, it should be noted that the organic matter that contains the Albian formation is as well in the oil and gas window. The position of the samples analyzed on the Van Krevelen type of maturity diagram below, Figure 9 allows to deduce a dominance of samples rich in mature organic matter and the presence of immature levels in all the wells.
Discussions
Lithological characteristics of the Albian formation
Analysis of the gamma ray profiles made it possible to highlight along the studied wells that the Albian formation consists of alternating sandstone levels of clay levels and in places of thin intercalations of carbonates. This lithological description is in accordance with that made by previous studies [9-12,16]. Also, it corresponds to the formation described by previous study [6] in the coastal basins of the Dahomey Embayment and in the offshore basin of the Ivory Coast. In addition, the alternation of detrital levels found in these lower Cretaceous deposits, the frequency of deflections of gamma ray profiles. The presence of carbonate levels in the upper member of the formation testifies to a deposit in a fluvial to marin environment. These carbonate levels have also been reported at the Albian formation by different authors in the basin of Keta (Ghana), Togo, Nigeria and even Côte d’Ivoire [32-35]. It is the same in the basins of Togo and Nigeria [30,31]. The presence of these carbonate levels could be explained by the marine transgression that marked the end of the Lower Cretaceous.
Maturity of the organic matter and kerogen type of the Albian formation
Considering the analysis of the Tmax values (from 321 to 465°C) of the samples from the Albian formation, it appears that the organic matter that it contains presents various states (early to high maturity and immaturity) of a well to another and from one level to another in the same well. These various states of organic matter are related to the nature of the sediment. In fact, immature levels are linked to clay siltstones made up of coarser grains. These silty levels are reshuffle coarser grain levels as indicated by the presence of authigenic minerals such as glauconite and calcite revealed by the petrographic study of some samples. The higher the sampling depth the higher the value of Tmax and therefore the degree of maturity. This is well illustrated with some exceptions in both shallow offshore (R23, R24 and K25) wells samples as well as deep offshore wells (G20 and G21) (Table 2). The maturity of the organic matter therefore intervenes at a depth that varies from one well to another. The work of previous studies [36-39] agrees on the late maturation of the organic matter contained in the schistous levels of the Albian formation for which the Tmax values vary from 435 to 465°C. However early maturation levels were also identified by previous studies [36,37] in shallow offshore (wells R23 and R24) and a study [38] in deep offshore (wells G20).
From the point of view of quality of the source rock, our results according to which the Albian formation has a good to excellent oil potential corroborate those of the works of previous studies [10,14,36]. Indeed, the average values of the TOC and S2 of these different works are respectively well above 1% and 10 mgHC/g rock.
According to the results of this work, the Albian Formation contains a kerogen of type III, II and II/III with type II dominance in deep offshore. The work of previous studies [36,37] on the samples from the wells R24 and S11 rather suggests the presence of Type III kerogen while excluding the possibility that the formation contains Type II kerogen in the shallow offshore. This possibility is confirmed by our results. The presence of Type III and II kerogen in deepwater reported by a study [38] in the clay levels of wells G20, G21 is consistent with our results. However, in the shallow offshore well R24, the presence of Type IV kerogen has been revealed. In the Keta Basin (Ghana), Type II and III kerogens were also found in the Albian Formation [40,41]. It is the same in the Ivorian basin according to the work of previous studies [42]. The presence of type II kerogen in the Albian formation in the Embayment basins could be explained by the existence of a particular sedimentation condition during the depositing of this formation, notably sedimentation under the influence of rifting with sea level variation.
Conclusion
The present study has found from log analysis that the Albian formation, which represents the upper unit of Lower Cretaceous deposits in the coastal sedimentary basin of Benin is characterized by two dominant lithofacies: One sandstone and the other clay. These two dominant facies are associated in places with thin carbonate levels of variable thickness. The petrography of some sampled clay levels has made it possible to highlight the clay to clay-silty and silty-clayey nature of some source rock levels, which sometimes have high granularity and contain organic matter. The Rock-Eval6 pyrolysis assessment of clay levels indicates that the Albian Formation is a veritable source rock capable of generating oil and gas. These characteristics have been defined by TOC; S2; Tmax and IH values which vary respectively from 0.1 to 8.44%; 0.21 to 12.69 mgHC/g rock; 321 at 460°C and 66 to 411 mgHC/gTOC. It is generally mature at late maturity and contains type II kerogen; III and II/III.
Acknowledgements
The authors of the article thank the General Directorate of Mining and Oil Industry (DGIMP) of Benin for its spontaneous collaboration in the provision of rock samples whose pyrolysis analyzes allowed the writing of this article.
References
- Ministry of Energy for Oil and Water Research and Renewable Energy Development (MERPMEDER) (2015) Indicative table of oil blocks of the coastal sedimentary basin of Benin at August 14, 2015, Report, p: 2.
- Gérard Alfred Franck d’Almeida (2013) Benin Embayment, Report HIS  p: 59.
- Dumestre MA (1985) Northern Gulf of Guinea shows proma. J Oil Gas83, 18: 154-165.
- Sougy J (1988) West African connections with other Archean continental masses in the Mesozoic. Synthesis of the contributions of a conference penrose. J Afr Earth Sci 7: 315-323.
- Tucker JW (1992) Aspects of the Tano Basin Stratigraphy Revealed by Ghana, African Geology, 1st Colloquium on Stratigraphy and Paleogeography of West African Sedimentary Basins and 2nd African Symposium on Micropaleontology. Libreville, Gabon Elf Aquitaine, Memory 13: 153-159.
- Brownfield ME, Charpentier RR (2006) Geology and total petroleum systems of the West-Central Coastal Province (7203), West Africa, U.S. Geological Survey Bulletin 2207-C, p: 52
- Moulin M, Aslanian D, Unternehr P (2010) A new starting point for the South and Equatorial Atlantic Ocean. Earth-ScienceRev 98: 1-37.
- Lepretre R (2015) Phanerozoic evolution of the West African Craton and its North and West borders. Doctoral Thesis Paris Sud University, p: 422.
- Billman HG (1976) Offshore stratigraphy and paleontology of the Dahomey Embayment, West Africa. Paper prepared for the 7th African Micropaleontological Colloquium, Ile-Ife Nigeria, p: 29.
- Jan Duchene R (1998) Geology and sequence stratigraphy of the Benin basin. Report ABACAN, p: 68.
- Archean Benin Energy sarl (2000) Joint technical commitee meeting block 2 and 3 offshore Benin. Report, pp: 1-26.
- Kaki C, Oyede LM, Laibi RA, Yessoufou S (2001) Influence of sedimentary and structural dynamics on the formation of Cretaceous detritic reservoirs in the coastal sedimentary basin (RESO-BSC) of Benin (Gulf of Benin, West Africa), Symposium on the "redefinition of the basement of the coastal sedimentary basin of Benin ". Acts, pp: 213-237.
- South Atlantic Petroleum (SAPETRO) (2010) Benin Bloc 1/Seme Petroleum System. Report, p: 8.
-  Kaki C, d’Almeida GAF, Yalo N, Amelina S (2012) Geology and Petroleum Systems of the Offshore Benin Basin (Benin). Oil Gas Sci Technolo – Rev IFP 68: 363-381.
- d’Almeida GAF, Kaki C, Adeoye AJ (2016) Benin and Western Nigeria Offshore Basins: A Stratigraphic Nomenclature Comparison. International Journal of Geosciences 7: 177-188.
- Bellion Y, Benkhelil J, Faure H, Guiraud B, Le Theoff B, et al (1983) The Eastern Niger Basin: Structural Observations and Geodynamic Evolution. In: Conrad G (ed.) Sedimentary Basins in Africa, Summary of Papers, Specialized Meeting of the Société géologique de France. St-Jérôme Marseille. Trav Lab Sci Earth Series A 15: 57.
- Popoff M (1988) From Gondwana to the South Atlantic: the connections of the Bénoué Trench with the basins of northeastern Brazil until the opening of the Gulf of Guinea in the lower Cretaceous. J Afr Earth Sci 7: 409-431.
- Benkhelil J, Mascle J, Villeneuve M, Tricart P, Auroux C, et al. (1989) The Equamarge Group the South Guinean transforming margin: first results of the Equamarge II campaign. C Acad Sci Paris, t 308: 655-661.
- Bumby AJ, Guiraud R (2005) The geodynamic setting of the Phanerozoic basins of Africa. J Afr Earth Sci43.
- MacGregor DS, Robinson J, Spear G (2003) Play fairways of the Gulf of Guinea transform margin. In: Arthur TJ, MacGregor DS, Cameron NR (eds.) Petroleum geology of Africa - New themes and developing technologies. Geol Soc London Spec Publ 207, p: 289.
- Eagles G, Konig M (2008) A model of plate kinematics in Gondwana breakup. Geophys J Int 173: 703-717.
- Serra O (1979) Delayed logging-basis of interpretation. Tom1: Acquisition of log data. Bull Cent Rech Explor-Prod Etl-Aquitaine Mém 1: 328.
- Beaux JF, Platevoet B, Fogelgesang JF, Petrology Atlas, Paris Peters KE (1986) Guidelines for evaluating petroleum source rock using programmed pyrolysis. American Association of Petroleum Geologists Bulletin 70: 318-329.
- Peters KE, Cassa MR (1994) Applied source rock geochemistry. In: Magoon LB, and Dow WG (eds.) The petroleum system – from source to trap. American Association of Petroleum Geologists 60: 93-120.
- Lafargue E, Marquis F, Pillot D (1998) Rock-Eval6 applications in hydrocarbon exploration, production, and soil contamination studies. Oil Gas Sci Technolo – Rev IFP 53: 421-437.
- Behar F, Beaumont V, de Penteado HL (2001) Rock-Eval 6 technology: Performances and developments. Oil and Gas Science and Technology 56: 111-134.
- Fowler M, Snowdon L, Stasiuk V (2005) Applying petroleum geochemistry to hydrocarbon exploration and exploitation. American Association of Petroleum Geologists Short Course Notes June 18-19.
- Kjemperud A, Agbesinyale W, Agdestein T, Gustafsson C, Yükler A (1992) Tectono-stratigraphic history of the Keta Basin, Ghana with emphasis on late erosional episodes, 1st Colloquium on Stratigraphy and Paleogeography of West African Sedimentary Basins and 2nd African Symposium on Micropaleontology. Libreville, Gabon, 6-8 Mai. Elf Aquitaine, Mémoire 13, 55-69.2005, Calgary, Alberta, p: 224.
- Baik HY, Richtmyer A, Asafu-Adzaye NB, Adzei-Akpor N, Manu T (2000) TectonoStratigraphy And Hydrocarbon Potential Of An Active Transform Margin Basin: Accra/KetaBasin, Ghana, West Africa. Aapg Annual Convention, New Orleans, Louisiana, AAPG Search and Discovery.
- Getty Oil International (1985) Exploration well prognosis Haho1, offshore Togo. Rapport interne B. N R M Togo, p: 75.
- Da Costa PYD, Johnson AKC, Affaton P (2013) The Paleozoic and Mesozoic Lands of the Togolese Coastal Basin: Stratigraphy and Palaeogeography. Standard Scientific Research and Essays 1: 415-429.
- Omatsola ME, Adegoke OS (1981) Tectonic evolution and Cretaceous stratigraphy of the Dahomey basin. Jour Min Geol18: 130-137.
- Elvsborg A, Dalode J (1985) Benin hydrocarbon potential looks promising. J Oil Gas 11: 126-131.
- International Petroleum Limited (IPL) (1991) Offshore Benin Blocks 1 and 2: Technical Evaluation. Report 57.
- Beicip-Franlab (1994) Geological Survey and Evaluation of the Reserves of the Field of Sèmè. Reports, 1:157 and 2: 128.
- Kerr McGee Oils and Gas (2001) Preliminary Geochemistry and 1Demensional Basin Modeling Results for Block 4, Offshore Benin. Report 47.
- d’Almeida GAF, Kaki C, Senou R, Amelina S (2016) Thermal Maturity Evaluation of Albian Shales from Offshore Benin Basin (Benin-West Africa) ASRJETS. 23: 190-213.
- Atta-Peters D, Garrey P (2014) Source Rock Evaluation and Hydrocarbon Potential in the Tano Basin, South Western Ghana, West Africa. Int J Oil Gas Coal T 2: 66-77.
- Tetteh Teye J (2016) The Cretaceous Play of Tano Basin, Ghana. International Journal of Applied Science and Technology 6: 10.
- Macoura K (1998) Thermal maturation and petroleum potential of the cuttings of the IVCO-10 oil well of the CI-02 block of the sedimentary basin of Côte d'Ivoire. Master's thesis in Earth Science from QUEBEC University in CHICOUTIMI 79.
- Morrison J, Burgess C, Cornford C, N’Zalasse B (2000) Hydrocarbon systems of the Abidjan margin, Cote d’ivoire. Offshore West Africa 2000 Conference and Exhibition 22nd March, 2000 Abidjan, Côte d’Ivoire, p: 13.
Citation: Armand Kiki, Kaki C, d’Almeida GAF, Hounkpantini J (2018) Potential Source Rock of Albian of the Benin Coastal Sedimentary Basin. Oil Gas Res 4: 155. DOI: 10.4172/2472-0518.1000155
Copyright: © 2018 Armand Kiki, et al. This is an open-access article distributed under the terms of the Creative Commons Attribution License, which permits unrestricted use, distribution, and reproduction in any medium, provided the original author and source are credited.
Select your language of interest to view the total content in your interested language
Share This Article
Recommended Journals
Open Access Journals
Article Tools
Article Usage
- Total views: 5211
- [From(publication date): 0-2018 - Nov 23, 2025]
- Breakdown by view type
- HTML page views: 4219
- PDF downloads: 992

