Potential Power Production from Salinity Gradient at the Hooghly Estuary System
Received: 08-Jun-2018 / Accepted Date: 26-Jun-2018 / Published Date: 02-Jul-2018 DOI: 10.4172/2576-1463.1000210
Abstract
Salinity gradient energy is a clean source of renewable energy, which can be harnessed from a region where fresh river water connects to a hypersaline sea or lake. The funnel shaped Hooghly Estuarine river system connects to comparatively more saline Bay of Bengal. This change in salinity can be used to extract salinity gradient energy. Here, analyses has been done on the energy potential due to salinity gradient for the Hooghly estuarine system using Reverse Electrodialysis (RED) process to estimate the available energy. Using the available data for solving the required thermodynamic equations, theoretical potential as high as 1425.3 MW and low as 228.4 MW was calculated for the River Estuarine during May and November. The study also explains the effect of the monsoon season in the extractable energy. The viability of any such energy extraction project depends on the sale price of the generated power and membrane efficiency. A number of laboratory experiments in the previous studies were done, which state the energy efficiency of RED process to be 33-44 % considering equal volume of seawater and river water. The calculated values are based on recently available membranes and better results can be anticipated with the use of advanced membranes.
Keywords: Salinity; Energy efficiency; Reverse electrodialysis; Pressure retarded osmosis; Membrane technology; Renewable energy
Nomenclature
Change in energy: ΔHmix; Gibbs energy change: ΔGmix; Entropy of mixing: ΔSmix; Absolute temperature: T; Energy from estuarine water: Gb; Energy from hypersaline water: GC; Energy from dilute water: Gd; Chemical potential of component: mμm; Number of moles of component: mnm; Molar free energy under standard condition: μm°; Specific volume of component: m Vm; Change in pressure: ΔP; Universal gas constant: R; The mole fraction of component: m xm; Valency of the ion of component: m Zm; Faradays constant: F; Gibbs free energy: G; Enthalpy: H; Internal entropy: Sint; Sea water: SS; Volume of sea: VS; River water: SR; Volume of river: VR; Mixture: SM; Volume of mixture: VM; Lake salinity: L; River salinity: S.
Novelty
The manuscript demonstrates a promising amount of extractable salinity gradient energy from Hooghly Estuarine river system connecting to comparatively more saline Bay of Bengal. Studies show that 1425.3 MW can be extracted and the influence of highly influencing monsoon period has also been illustrated. The studies are based on the RED process with the possibility of increase in renewable energy and energy efficiency with the advancement in the membrane technology. No significant previous studies based on energy due to salinity gradient for this region has been done which makes this study highly significant and makes new way for exploring energy using Salinity Gradient.
Introduction
The increasing global pollution has resulted in tremendous increase in the consumption of the fossil fuels. For instance, increase of 60% in the worldwide total energy consumption has been projected by the US department of Energy from 1999 to 2020. The conventional sources of energy fossil fuels are the one which are available in the limited amount and hence, an alternative to replace these sources of energy is needed. As the energy drives the global economy [1], it is inevitable to find a better source of energy, both in terms of eco–friendly and efficiency. The fossil fuels are non–renewable sources of energy and produce very harmful gases. The CO2 released from the fossil fuels causes the greenhouse effect and hence global warming. The use of renewable energy sources is a must and the most important requirement for a better future. Geothermal power, wind power, small–scale hydropower, solar power, biomass power, tidal power, wave power and salinity gradient energy are the renewable energy sources available. Table 1 shows that abundant amount of osmotic power can be generated from some of the major rivers of the world, for example 20,800 MW2 and 2,080 MW2 from Amazon and Ganges river. The least exploited of all these renewable sources is the salinity gradient energy, and is called the “Blue Energy”. The Gibbs free energy gradient is the driving force in the salinity gradient energy [2]. It is the energy produced due to the mixing of different salt concentration solutions, e.g. sea water and fresh river water. It is a completely renewable and sustainable process for energy production with the highest energy potential of all marine renewable energy sources [1]. The higher salt concentration in the aqueous solution results in greater chemical potential as Gibbs free energy is the positive function of the chemical potential. The extraction of salinity gradient energy was discussed long back in 1950’s [3], but the unavailability of efficient membranes made the thought to fade away. With the modern technology and increasing power demand, the process has been worked on to make it commercially viable. The biggest advantage of the process is that it does not pollute the atmosphere and it has a low environmental impact as the mixing of the saline water and river takes place naturally [2].
| Source of fresh water | Average flow rate (m3s-1) | Power (MW)2 |
|---|---|---|
| World | 1.2 x 10⁶ | 124,800 |
| Amazon River, Brazil | 2 x 10⁵ | 20,800 |
| La Plata – Parana River, Argentina | 8 x 10⁴ | 8,320 |
| Congo River, Congo Angola | 5.7 x 10⁴ | 5,930 |
| USA | 5.4 x 10⁴ | 5,620 |
| Yangtze River, China | 2.2 x 10⁴ | 2,290 |
| Ganges River, Bangladesh | 2 x 10⁴ | 2,080 |
Table 1: Osmotic power production capacity of few major rivers of the world as per the Central Intelligence Agency, The world fact book, CIA, Washington, 2011.
Nollet in 1748 was the first scientist to observe the Osmosis phenomenon [4] but Pattle was the first to discuss the process of energy extraction through the RED process [3]. Norwegian utility company “Statcraft” launched a 10 KW prototype plant in Tofte, South of Oslo, Norway in 2009, combining freshwater from the Tofte river and saline water from a neighbouring fjord. The two different salt concentration solutions are separated using semipermeable membrane [2]. The spontaneous mixing of the two aqueous solutions having different salinity is the driving force of mixing process. The similar studies has been done on the effect of different molecular weight polyethylene glycol on flat sheet cellulose acetate membranes for evaluating power density performance in pressure retarded osmosis study [5]. The basic mathematical equation for the RED process was proposed by Lacey et al. [6]. Forgacs applied the equation for the extraction of salinity gradient power for the RED. Emren and Bergestrom conducted an alternative approach for the energy potential calculation for the RED [2]. Energy production potential from salinity gradient (SGP) for Hooghly estuary region have not been reported yet. The potential for the electric energy production from salinity gradient, at the Sundarbans delta region, has been examined. The study presents calculation of the technical and theoretical potential on the basis of the available technology. To do the calculations, the study region has been divided into different sections, River estuarine system and coastal estuarine system. A comparative study for extraction of salinity gradient energy has been done between the two systems. As the region is highly affected by seasonal rainfall, efforts have been made to analyse the process seasonal basis. The data were collected from various sources (including literature) and a mathematical model was used to calculate the values for three seasons namely, monsoon, pre-monsoon, and post-monsoon.
Study Area, Data used and Methodology
Study area and data
The Hooghly Estuarine System is located in the North East Coast of Bay of Bengal. It is one of the major estuaries of the Ganges. The map of the studied region is illustrated in Figure 1. Being the first Ganges offshoot deltaic, it flows through the western Sundarbans mangrove forests. This mangrove ecosystem is highly productive in the estuarine phase and carries nutrients with them to the coastal region [7]. It carries a large amount of minerals and a lot of materials are being transported to the estuarine part due to the heavy rains in the monsoon period. Ganges originates in the Garhwal portion of the western Himalayas and further diverges into two parts namely the Padma channel at Bangladesh and the Bhagirathi–Hooghly channel in West Bengal, India. The Hooghly estuarine system is located approximately between 21°31′–23°20′ N and 87°45′–88°45′ E. The lower 80 km of the estuarine system flows through thick mangrove forest of the Sundarbans.

Figure 1: The Hooghly estuary region divided into three; regions, riverine, estuarine and coastal regions.
Hooghly River is the main artery of the North East coast of Bay of Bengal and is connected with a number of rivers and waterways. The Hooghly estuary has a funnel shaped mouth and is connected to the Bay of Bengal close to the Sagar Island, which is the largest block in the western Gangetic Sundarbans located about 100 Km to the south Calcutta, at 20.56°–21.88° N and 88.08°–88.16° E, surrounded by river Hooghly from the northwestern and river Mooriganga from the east [8]. The breadth and cross–sectional area continuously goes on decreasing the flow of water to the river end. The expression Ax = A0 e-kx relates the area of the cross-section to the distance, where Ax, x, A0 and k are the area of the cross–section of distance x (Ax), measured distance (x), the area of the cross–section at the mouth (Ao) and a constant value 0.0241 respectively. Here, the Hooghly estuarine system has been divided into three stations, namely riverine, estuarine and coastal. Beguakhali being highly saline is situated at 88°46.6 E and 21°41.2 N has been considered as the coastal region. This region is the meeting point for estuary and Bay of Bengal. Kachuberia (88°8.15 E and 21°52.72 N), has been considered as the estuarine. It is situated at the northern most tip of the Sagar Island. Diamond harbor (88o9.0 E and 22o8.78 N), has been considered as the Riverine. It is situated on the mainland and goes 60 km down from Calcutta. A schematic of this study is shown in Figure 1.
Figure 2 shows the monthly distribution of air temperature due to the effect of solar radiation, evaporation, fresh water influx and mixing up of water on the water and air temperature. The highest temperature with a mean value of 33.19 ± 1.5°C in the Hooghly estuary was observed during pre-monsoon, whereas the post monsoon period experienced the lowest value of 21.9 ± 2.07°C. Water temperature is directly related with air temperature, as the difference is usually less than 8 %. The average temperature for various seasons and monthly salinity values for the various stations were taken to calculate the NaCl concentration [9]. The increasing temperature of water increases the salinity of the water and hence alters the output of the energy potential due to enhanced salinity gradient.

Figure 2: Monthly variation in the maximum and minimum air temperature at the Hooghly estuary region, over a period of 1990–2000.
Figure 3 shows the distribution of rainfall with months, when the river discharge value is highly influenced by rainfall at the Hooghly estuary region. The river discharge data for the studied region was collected from Rudra [10]. Relatively large value for river discharge was observed during monsoon and lower river discharge values were observed during the pre–monsoon. Figure 4 shows that the post– monsoon river discharge values were observed to be intermediate to the pre–monsoon and monsoon values. A number of experiments and studies to calculate the concentration of various ions dissolved in water were done for the study region. Maximum temperature between 30-35°C was recorded during May and June, whereas minimum temperature ranging between 20–24°C was recorded during December [11-19].

Figure 3: Monthly variation in the rainfall at the Hooghly estuarine system over the period of 1990-2000.

Figure 4: Monthly variation in the river discharge at the Hooghly estuary region, over the period of 1990–2000.
Methodology
The Gibbs free energy relation ΔGmix = ΔHmix - TΔSmix represents the theoretical non expansion work produced by mixing the saline water with the fresh water. Here the quantity ΔHmix represents the change in energy and ΔSmix represents the entropy of mixing. The quantity ΔHmix for an ideal solution becomes zero, and hence the equation becomes
ΔGmix = - TΔSmix
The Gibbs free energy for the mixing of saline water and fresh water is: [11]
ΔGmix = Gb(Gc+Gd) (1)
Where Gb, Gc and Gd represents the energy from estuarine water, hypersaline water and dilute water respectively.
Considering the solution to be ideal: Gmix = Σμmnm, where μm and nm represents the chemical potential and the number of moles of any component ‘m’ in the solution [8]. In an ideal solution the chemical potential (μm) of any component m is [12]:
μm = μm° + VmΔP + RT ln xm + ZmΔF (2)
Where μm° is considered as the molar free energy under standard conditions, ΔP is the change in pressure compared to the atmospheric conditions, Vm is the specific volume of the ‘m’, R is the universal gas constant, xm, is the mole fraction of the component m and Z is the valency of the ion [3,13]. The component F is the Faraday’s constant.
Considering no change in the pressure or transport and mixing the concentrated and dilute solutions, the equation becomes [14]:
μm = μm° + RT ln xm (3)
Since the enthalpy of mixing is 0, the change in Gibbs free energy on mixing will be determined by the entropy of mixing, i.e.
ΔGmix = RTΣmxmln(xm) (4)
Now, calculating the change in Gibbs free energy on mixing two components ‘A’ and ‘B’:
ΔGmix = RT Σm(xAln(xA) + xBln(xB)) (5)
From the basic Gibbs free energy expression for the mixing of saline water and fresh water:
ΔGmix = Σ [Gb- (Gc + Gd)];
ΔGmix = Σi{(nm,c + nm,d) RT ln xm,b – (nm,c RT ln xm,c + nm,d RT ln xm,d)} (6)
The amount of energy theoretically available by mixing two aqueous solutions, with ‘m’ dilute compounds is given by the equation 6.
Gibbs, free energy is a measure of chemical energy and is defined as:
G= H-TSint (7)
where, the expression G, H, T, and S are Gibbs free energy, enthalpy, temperature and entropy respectively. Considering the system to be in chemical equilibrium, the entropy increase of the river and sea water (if these were compose of a pure water and solid salt) is calculated as:
S = -nR[xln(x) + yln(y)] (8)
here n is the number of moles and R as the universal gas constant. The above-mentioned equation can be further represented as:
Ss = -Vs mR [xs ln(xs) + ys ln(ys)] (9)
SR = -VR mR [xR ln(xR) + yR ln(yR)] (10)
SM = -VM mR [xM ln(xM) + yMln(yM)] (11)
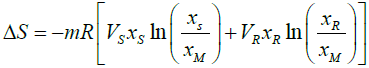
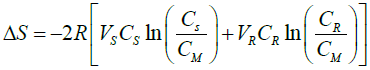
Here, the volume of sea water is assumed as Vs, volume of river water as VR, the Gibbs free energy from sea water as Ss, Gibbs free energy from the river water as SR and that of the mixture of the two is represented as SM [11]. By ignoring the contribution of water to the entropy, the equation can be transformed as:
ΔS = -mR[VMXM ln(XM) – VSXS ln(XS)- VRXR ln(XR)] (12)
 (13)
(13)
 (14)
(14)
With 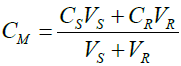
considering the case of a reversible isothermal process, the change of the free enthalpy (ΔG) can be calculated as:
W = ΔG = ΔH – TΔS, (15)
considering the solutions to be ideal and the enthalpy change to be zero, the reversible work W, is calculated as:
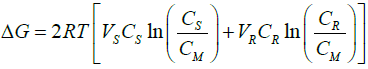 (16)
(16)
This is used to calculate the change in Gibbs free energy on mixing fresh water with saline water. It can be concluded that the theoretically available energy due to the mixing of fresh river water with saline water is a function of salinity and river water discharge. The greater will be the salinity of the saline water, the more will be the energy. However, in practical application, the energy extraction from salinity gradient differs mainly due to the limitations in the mass transfer and other parameters, which vary with time and place [2,12]. The osmotic pressure, therefore, is utilized to extract the energy as the increasing salinity increases the osmotic pressure. With advanced technology, the possibility of extracting salinity gradient energy at the commercial level has been increased.
There are few methods available for estimation and extraction of salinity gradient energy [2]. Pressure retarded osmosis, Reverse electrodialysis, Vapor pressure gradient, Capacitive technologies and Microbial fuel cell. Among the processes, PRO and RED have been found to be the most efficient and effective. A number of studies have been done on the potential performances of both techniques, which state these process to be much more advantageous over any other available techniques. PRO process involves the mixing of two solutions having different salt concentrations separated by a thin semipermeable membrane. To increase the efficiency of the PRO process, the advanced membrane technology is needed, as the permeability of water through the membrane skin needs to be increased [13]. Figure 5 shows the working of a PRO process of extraction of salinity gradient energy.

Figure 5: Functioning of energy production by Pressure Retarded Osmosis process.
Figure 6 illustrates the functioning of the RED process for salinity gradient energy production. In this system, filling up of the compartments with solutions having different salinity takes place. The compartments are separated by a large number of perm–selective ion– exchange membranes. The difference in the chemical energy potential due to salinity gradient thus causes the ions transportation across the cation and anion exchange membranes. This process of transport of ions takes place due to the perm–selective ion–exchange membranes separating the two solutions of different salt concentrations. The difference in Gibbs free energy between the two different salt concentration solutions is the driving force of the ion transportation, which continues till the equilibrium is attained [13].

Figure 6: Functioning of energy production by Reverse electrodialysis process.
Thorsen performed an experiment with a commercial CA (cellulose acetate, SS10 from Osmonics) RO sheet membrane and observed the performance of the PRO process for the production of salinity gradient energy by mixing freshwater and seawater to study the limitations of the process [15]. The model was developed to analyse laboratory experiments. Around 40 % of the energy can be achieved by this process and advanced technology. Different power density can be acquired using different types of available membrane.
Results and Discussion
Salinity gradient energy (Theoretical and technical)
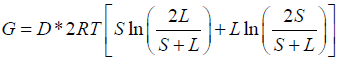
The calculation of theoretical potential for the extractable energy from salinity Gradient (G) is done using the Forgacs equation. The estimated values vary with time and seasons, due to the changes in river discharge (D), temperature (T), sea or lake salinity (L) and river salinity (S) change with time.
Applying this equation to estimate the extractable energy from salinity gradient between the River–Estuary system and the Coastal– Estuary system. The data for river discharge, salinity and temperature were collected from various sources and also from published works [9,10,15]. On the basis of the monthly values for river discharge and salinity, an analysis for the change in the theoretical potential during three seasons (Pre–Monsoon, Monsoon, and Post–Monsoon) was estimated.
Figure 4 illustrates the monthly variations in the river discharge. The studied region receives heavy rainfall during monsoon season, which provides huge freshwater influx. On the basis of the available data, the estimated value for theoretical potential (G) and technical potential for extractable energy was calculated. Table 2 shows the values obtained for the river–estuarine and coastal–estuarine system.
| Month | River discharge (m3/s) | River salinity (gm/l) | Estuarine salinity (gm/l) | Coastal salinity (gm/l) | Theoretical potential (MW) for R–E system |
Technical potential (MW) for R–E system |
Theoretical potential (MW) for C–E system |
Technical potential (MW) for C–E system |
|---|---|---|---|---|---|---|---|---|
| Jan | 4382 | 0.013 | 0.126 | 0.267 | 433.4 | 173.4 | 214.4 | 85.7 |
| Feb | 3922 | 0.019 | 0.172 | 0.295 | 517.1 | 206.8 | 121.6 | 48.6 |
| Mar | 3027 | 0.023 | 0.197 | 0.320 | 450.7 | 180.3 | 84.7 | 33.9 |
| April | 2986 | 0.027 | 0.233 | 0.376 | 525.5 | 210.2 | 96.2 | 38.5 |
| May | 7149 | 0.030 | 0.299 | 0.419 | 738.3 | 295.3 | 135.6 | 54.2 |
| June | 9064 | 0.018 | 0.155 | 0.243 | 1049.9 | 419.9 | 170.6 | 68.2 |
| July | 13,342 | 0.006 | 0.108 | 0.189 | 1425.3 | 570.1 | 283.7 | 113.5 |
| Aug | 16,632 | 0.002 | 0.052 | 0.153 | 892.9 | 357.2 | 822.1 | 328.8 |
| Sept | 16,541 | 0.001 | 0.016 | 0.087 | 234.8 | 93.9 | 840.2 | 336.1 |
| Oct | 7301 | 0.003 | 0.040 | 0.132 | 258.6 | 103.4 | 358.2 | 143.3 |
| Nov | 3070 | 0.007 | 0.085 | 0.182 | 228.4 | 91.4 | 105.1 | 42.0 |
| Dec | 3091 | 0.008 | 0.118 | 0.240 | 341.8 | 136.7 | 124.3 | 49.7 |
Table 2: Monthly variation in the values of Theoretical and Technical potential for the river–estuarine and coastal–estuarine system for 1990–2000.
Fresh water discharge to the Hooghly river connecting the bay of Bengal is highly influenced by the monsoon seasons. Monsoon rains fill the Hooghly river with huge amount of fresh water, which reduces the salinity of the river. This is one of the major factors of increasing the potential of energy extraction due to change in salinity gradient. Table 2 lists the changing salinity and river discharge values for the studied region. April month experiences the minimum river discharge of 2986 m3/s, which goes on increasing with approaching monsoon and reaches the peak value of 16,632 m3/s during August as shown by Figure 7. Accordingly the energy increases for river estuarine system from 525.5 MW to 1425.3 MW, respectively. The highest recorded value for the coastal estuarine system was in the month of September as 840.2 MW and the lowest was recorded as 84.7 MW in March. This is due to the salinity difference between the estuarine water and coastal water, and hence there is reduction in the value of extractable energy when the salinity is lower in september.

Figure 7: Seasonal variation of the theoretical potential energy for the River– estuarine and Coastal–estuarine system.
Figure 7 shows that during pre–monsoon season the coastal estuarine system can generate 100 MW of average salinity gradient energy, whereas the river estuarine system can generate 800 MW. The post monsoon period receives comparatively less fresh water than the monsoon period but more than the pre monsoon period. Although a good amount of fresh water discharge is experienced during the post– monsoon in the bay, which gets more saline towards the coastal region, the extractable energy is minimum for the river–estuarine system and moderate for the coastal–estuarine region, as the salinity gradient is minimum during this season. The theoretical energy, which can be generated during this season is around 400 MW for river–estuarine and around 200 MW for coastal–estuarine system. The monsoon period is shown to be highly productive with average energy of around 900 MW and 500 MW for river–estuarine and coastal–estuarine system, respectively. However, the extractable energy is expected to increase with the introduction of modern technology and more efficient membranes.
Economical feasibility
Financial aspects of any project need to be studied well before the project is led to the floor. These include total installation cost of the project and its feasibility. The functioning of the PRO and RED systems depends on the cost, life expectancy and efficiency of the membrane. During monsoon season fresh water carries with large amount of impurities and other materials, which get mixed with water during its flow from connecting rivers and other water bodies. This increases the treatment cost of water before it can be fed to the processing unit. Membranes are most important and delicate components of the plant and they need special care and cleaning.
The ion–exchange membranes are the most crucial part of the RED and are the main limitations of the process. Theoretically, ten membrane pairs are needed to split water, with each pair generating 0.1–0.2 V potential. But at least 20 such membrane pairs are needed practically. Although there are energy loses at the electrodes but this can be neglected by using higher number of membrane pairs to generate electric power. Neglecting the electrode potential and pumping losses 0.93 W/m2 is the maximum power obtained using 50 cell pairs. Increased power densities can be obtained by reducing membrane spacing and optimizing membrane material. The power generation can be increased further by using ion conductive spacers between the membranes and reducing the size of the RED systems [16]. Modern technology and introduction of highly efficient membrane, to reduce phenomenon such as membrane fouling can certainly increase the membrane permeability and hence increase the efficiency of the process.
In a practical situation, the situation such as gel formation and formation of concentration polarization reduce the membrane permeability [17]. Studies were performed and estimated energy potential was considered to be 40 % of the calculated theoretical potential [18-22]. The revenue of a plant was calculated by Achilli [23].
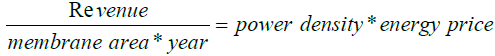
The recent power density for the RED system is close to 20 W/m2 and (2.4–38 W/m2) for PRO process. Power density, however, is not just the only indication of the performance of a system. It includes the regular supply of freshwater and cleaning of the membrane. Proper cleaning of the membrane is required to increase its efficiency and life expectancy. They cost around 50–80 % of the total capital required for the installation of the plant. The study shows that an increase of 5 W/ m2 in the power density of mixing sea water and river water can be expected by the introduction of improved membranes [24,25]. The current cost of the membranes is around 20–40 USD/m2 [26], which is very high for any project to be viable. The revenue must be higher than the price of replacing the membranes. However, a decreasing trend in the price of the available membranes has been noticed and is expected to be enhanced with the latest technology. For instance, the first experiment to harness energy from salinity gradient was conducted by Sidney loeb [27]. It took almost 30 years to launch the first prototype and was done by Statcraft Company in 2009 at Norway. As per the studies done by Saito [28], 13.8 W/m2 was the maximum output power density obtained with 30 bars of hydraulic pressure by a PRO prototype plant. Other projects like “Mega–Ton RO–PRO” have been started by Japan in Fukoku City [28,29].
However, no full–scale plants have been constructed yet. The real value of the capital cost can only be calculated by implementing a plant at the studied region. Nijmeijer estimated the cost price of electric energy for a full–scale PRO plant [30]. He calculated the value to be around 65–130 USD/MWh [2]. This estimation of the capital cost is similar to the capital cost of other sources of renewable energy. A number of companies like Fujifilm, FumaTech, Nitto Denko, Oasys Water, OsmoBlue, Pentair X–Flow, Porifera and Toray Industries are working on the development of highly efficient and economic membranes, indicating that a number of research works are going on SGE industry.
Conclusion
Salinity gradient energy is generated when fresh river water meets the saline sea water. The salinity gradient potential is reported to be 1650 TWh/y globally, which is approximately half of the current annual hydropower generation of 3551 TWh/y [31-36]. These results make this process worth to be examined in the region where sea or lake water with high salt concentration meets with the less saline river water. The Hooghly Estuarine System, North East Coast of Bay of Bengal, India is one of the major estuaries of the Ganges. It is a funnel–shaped system which further gets connected with the Bay of Bengal. The increasing salinity from Raichak to Sagar south with huge freshwater influx can produce salinity gradient energy as high as 1425.3 MW during monsoon for the River estuarine system.
A large number of companies are entering the market with the motive to produce dedicated membranes and other parts required for the installation of RED and PRO plants for extraction of salinity gradient energy. The drawback of the technical potential from salinity gradient is that it is devoid of any ecological and legal constraints, which may reduce the energy production. The production of highly efficient but affordable membranes in large scale is the most important factor for the salinity gradient energy potential. Our analysis show, the river estuarine system can be considered to be more productive as compared to the coastal estuarine region [36-40]. Two different methods PRO and RED for extraction of salinity gradient energy have been discussed in the manuscript among the various methods available, and the study explains the RED process worth to be considered for the Hooghly estuary region with 1425.3 MW as the highest calculated salinity gradient energy. The calculated technical potential is just 40% of the theoretical potential, which is the minimum feasible energy for the region. The energy gain can be increased with the introduction of better membranes and reducing various loses reducing the production. However, our study is based on the presented calculations of the amount of extractable energy and exact capital cost can only be estimated after installing the plant.
References
- Mishra A (2013) Osmotic Power Huge Source of Renewable Energy. Int J Sci Res Sci Eng 4: 1-6.
- Emdadi A, Gikas P, Farazaki M, Emami Y (2016)  Salinity gradient energy potential at the hypersaline Urmia Lake–ZarrinehRud River system in Iran. Renew Ener 86: 154-162.
- Pattle RE (1954) Production of Electric Power by Mixing Fresh and Salt Water in the Hydroelectric Pile. Nature 174: 660.
- Jamaly S, Darwish N, Ahmed I, Hasan SW (2014) A short review on reverse osmosis pre–treatment technologies. Desalination 354: 30-38.
- Sharma MP, Mondal A, Chakraborty A, Kuttippurath J, Purkait M (2018) Â Effect of different molecular weight polyethylene glycol on flat sheet cellulose acetate membranes for evaluating power density performance in pressure retarded osmosis study. J Water Process Eng.
- Lacey RE (1980) Energy by reverse electrodialysis. Ocean Eng. Pergamon Press Ltd. Printed in Great Britain 7: 1-47
- Gonneea ME, Paytan A, Herrera-Silveirab JA (2004) Tracing organic matter sources and carbon burial in mangrove sediments over the past 160 years. Â Estuar Coast Shelf Sci 61: 211-227.
- Bhunia AB, Choudhary A (1991) Hydrological parameters and a report on planktonic and benthic fauna of Sagar Island. Sundarbans. West Bengal. Rec Zool Surv 88: 335-343.
- Mukhopadhyay SK, Biswas H, De TK, Jana TK (2006) Fluxes of nutrients from the tropical River Hooghly at the land- ocean boundary of Sundarbans, NE Coast of Bay of Bengal, India. J Marine Systems 62: 9-21.
- Rudra K (2014) Changing river courses in the western part of the Ganga- Brahmaputra delta. Geomorphology 227: 87-100.
- Vermaas DA, Veerman J, Yip NY, Elimelech M, Saakes M, Nijmeijer K (2013) High Efficiency in Energy Generation from Salinity Gradients with Reverse Electrodialysis. ACS Sustainable Chem Eng 1: 1295-1302.
- Emami Y, Mehrangiz S, Etemadi A, Mostafazadeh A, Darvishia S (2013) A Brief Review about Salinity Gradient Energy. Int J Smart Grid and Clean Energy 2: 295-300.
- Post JW, Veerman J, Hamelers VM, Euverink JW, Metz S, et al. (2007) Salinity gradient power, Evaluation of pressure retarded osmosis and reverse electrodialysis. J Membrane Science 288: 218-230.
- Brauns E (2008) Towards a worldwide sustainable and simultaneous large-scale production of renewable energy and potable water through salinity gradient power by combining Reversed Electrodialysis and solar power. Desalination 219: 312-323.
- Thorsen T, Holt T (2009) The potential for power production from salinity gradients by pressure retarded osmosis. J Membrane Sci 335: 103-110.
- Logan BE, Elimelech M (2012) Membrane–based processes for sustainable power generation using water. 488: 313-319.
- Skilhagen SE, Dugstad JE, Aaberg RJ (2008) Osmotic power- power production based on the osmotic pressure difference between waters with varying salt gradients. Desalination 220: 476-482.
- Post JW (2009) Blue Energy: electricity production from salinity gradients. Reverse Electrodialysis.
- Helfer F, Lemckert C, Anissimov Y (2014) Osmotic power with Pressure Retarded Osmosis: Theory, performance and trends - A review. J Membrane Sci 453: 337-358.
- Yip NY, Elimelech M (2014) Comparison of Energy Efficiency and Power Density in Pressure Retarded Osmosis and Reverse Electrodialysis. Environ Sci Technol 48: 11002-11012.
- Yip NY, Elimelech M (2012) Thermodynamic and Energy Efficiency Analysis of Power Generation from Natural Salinity Gradients by Pressure Retarded Osmosis. Environ Sci Technol 46: 5230-5239.
- Straub AP, Yip NY, Elimelech M (2014) Raising the Bar: Increased hydraulic pressure allows unprecedented high power densities in Pressure- Retarded Osmosis. Environ Sci Technol Lett 1: 55-59.
- Achilli A, Childress AE (2010) Pressure retarded osmosis: from the vision of Sidney Loeb to the first experimental installation- Review. Desalination 261: 205-211.
- Ramon GZ, Feinberg BJ, Hoek EMV (2011) Membrane–based production of salinity- gradient power. Energy Environ Science 4: 4423-4434.
- Post JW, Hamelers HV, Buisman CJ (2008) Energy recovery from controlled mixing salt and fresh water with a reverse electrodialysis system. Environ Sci Technol 42: 5785-5790.
- Zhu A, Christofides PD, Cohen Y (2009) On RO membrane and energy costs and associated incentives for future enhancements of membrane permeability. J Membr Sci 344: 1-5.
- Loeb S (2002) Large-scale power production by pressure retarded osmosis using river water and seawater passing through spiral modules. Desalination 143: 115-122.
- Saito K, Irie M, Zaitsu S, Sakai H, Hayashi H, et al. (2012) Power generation with salinity gradient by pressure retarded osmosis using concentrated brine from SWRO system and treated sewage as pure water. Desalination Water Treatment 41: 114-121.
- Tanioka A, Saito K, Irie M, Zaitsu S, Sakai H, et al. (2012) Power generation by pressure retarded osmosis using concentrated brine from sea-water desalination system and treated sewage: review of experience with pilot plant in Japan. 3rd Osmosis Membrane Summit, Statkraft, Barcelona.
- Nijmeijer K, Metz S (2010) Chapter 5 Saliity gradient energy. Sust Sci Eng 2: 95-139.
- Yip NY, Tiraferri A, Phillip WA, Schiffman JD, Hoover LA, et al. (2011) Thin-film composite pressure retarded osmosis membranes for sustainable power generation from salinity gradients. Environ Sci Technol 45: 4360-4369.
- Kumar A, Schei T, Ahenkorah A, Rodriguez RC, Devernay JM, et al. (2011) Hydropower. In IPCC Special Report on Renewable Energy Sources and Climate Change Mitigation: O. Edenhofer, R. Pichs-Madruga, Y. Sokona, K. Seyboth, P. Matschoss, S. Kadner, T. Zwickel, P. Eickemeier, G. Hansen, S. Schlömer, C. von Stechow (eds), Cambridge University Press, Cambridge, United Kingdom and USA, pp: 441-491.
- Saito K, Irie M, Zaitsu S, Sakai H, Hayashi H, et al. (2012) Power generation with salinity gradient by pressure retarded osmosis using concentrated brine from SWRO system and treated sewage as pure water treated sewage as pure water, Desalination and Water Treatment 41: 114-121.
- Zhang S, Sukitpaneenit P, Chung TS (2014) Design of robust hollow fiber membranes with high power density for osmotic energy production. Chem Eng J 241: 457-465.
- Bui NN, McCutcheon JR (2014) Nanofiber supported thin–film composite membrane for pressure–retarded osmosis. Environ Sci Technol 48: 4129-4136.
- Mitra A, Dube AG, Schmidt ACK, Banerjee K (2009) Observed changes in water mass properties in the Indian Sundarbans (north-western Bay of Bengal) during 1980-2007.
- She Q, Jin X, Tang CY (2012) Osmotic power production from salinity gradient resource by pressure retarded osmosis: Effects of operating conditions and reverse solute diffusion. J Membrane Sci 402: 262-273.
- Efraty (2012) Pressure retarded osmosis in closed circuit without need of energy recovery, 3rd Osmosis Membrane Summit, Statkraft, Barcelona.
- Chou S, Wang R, Shi L, She Q, Tang C, et al. (2012) Thin-film composite hollow-fiber membranes for Pressure Retarded Osmosis (PRO) process with high power density. J Membrane Sci 389: 25-33.
- Kleiterp R (2012) Decreasing trend in the price of the membrane. Fig. adapted from, the feasibility of a commercial osmotic plant.
Citation: Sharma M, Chakraborty A, Kuttippurath J, Yadav AK (2018) Potential Power Production from Salinity Gradient at the Hooghly Estuary System. Innov Ener Res 7: 210. DOI: 10.4172/2576-1463.1000210
Copyright: © 2018 Sharma M, et al. This is an open-access article distributed under the terms of the Creative Commons Attribution License, which permits unrestricted use, distribution, and reproduction in any medium, provided the original author and source are credited.
Share This Article
Recommended Journals
Open Access Journals
Article Tools
Article Usage
- Total views: 8121
- [From(publication date): 0-2018 - Apr 26, 2025]
- Breakdown by view type
- HTML page views: 7147
- PDF downloads: 974