Planting Resistance and Most Often Accurate Diagnosis for Rice Diseases
Received: 01-May-2023 / Manuscript No. RROA-23-99208 / Editor assigned: 04-May-2023 / PreQC No. RROA-23-99208 / Reviewed: 18-May-2023 / QC No. RROA-23-99208 / Revised: 23-May-2023 / Manuscript No. RROA-23-99208 / Published Date: 30-May-2023 DOI: 10.4172/2375-4338.1000364 QI No. / RROA-23-99208
Abstract
We have a good idea of what pests and diseases affect rice, but we do not always have a clear picture of where individual or groups of pests and diseases occur and how much effect they have on rice yield. One approach that can be used to gain insight into this is to develop a yield loss model based on a wide range of pest and disease injuries and corresponding yield losses under different rice production situations across Asia. A production situation is a combination of physical and socio-economic factors that influence agricultural production. Models like this are instructive tools that simplify real-world processes, but still provide useful information about the outcome of these processes.
Keywords: Yield and production; Cropped rice; Agricultural-statistics; Fertilization; Rain-fed millets; Water harvesting
Keywords
Yield and production; Cropped rice; Agricultural statistics; Fertilization; Rain-fed millets; Water harvesting
Introduction
The next step is to determine where these production situations occur and how many hectares they cover, and then use the model to estimate the loss in yield and production for each region of rice- growing Asia in which these situations are thought to occur. Finally, these pieces of information can be combined and visualized in a geographic information system to extrapolate the results of the yield loss model and generate maps that provide a broad overview of possible pest and disease occurrences and the resulting yield losses across large geographic areas [1]. Here, we used rice pest, a rice yield loss model that simulates yield losses due to sheath blight, brown spot, sheath rot, bacterial leaf blight, brown plant hopper, defoliating insects, dead hearts and whiteheads caused by stem borer, and weeds. Although not exhaustive, this list includes the most important pests and diseases that afflict rice in tropical Asia [2]. Next, we looked at the losses that could be expected in two of the most common rice agro-ecologies of tropical Asia: an intensive irrigated mono-culture system in rice is cropped twice or three times a year, and a rain-fed system in which rice is cultivated once and is followed by another non-rice crop in the same year. We estimated the area under both of these systems for different Asian regions by following the same methodology used in the well-known Huke and Huke rice maps of Asia that is a combination of expert opinion and recently published agricultural statistics.
Methodology
Using GIS, yield loss estimates were combined with estimates of the area that these agro-ecologies occupy in each region in countries across Asia [3]. Thus, we were able to generate maps of possible yield loss estimates and possible total paddy production losses per region. In general, the greatest predicted average yield losses take place in regions where double-or triple-rice irrigated systems dominate. This is because there are at least two seasons of rice in these regions annually and these losses are summed. On the other hand, the rain-fed rice and other crop systems have only one season of rice annually [4]. In each of these systems, weeds and sheath blight caused the most losses in the double/triple irrigated system, while weeds and, to a lesser extent, sheath blight, brown spot, sheath rot, and whiteheads caused losses in the rain-fed rice and other crop system. These maps are just the first step as we find new ways to obtain more information about insect pests, diseases, weeds and the amount of yield losses they cause in rice plants, based on weather data, production situations, crop health surveys of farmers’ fields, and results of field experiments [5]. Maps such as these are useful tools that show where researchers should focus their efforts for pest and disease management and help understand which pests and diseases should be managed in different regions. Also, these maps can be used to determine where specific pest and disease management strategies have the greatest impact in reducing yield losses, formulate policy-making decisions, and guide further scientific research, thus helping IRRI and partners achieve larger goals [6].
Discussion
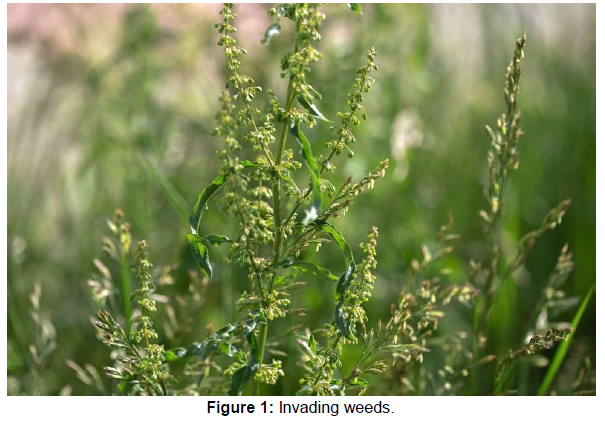
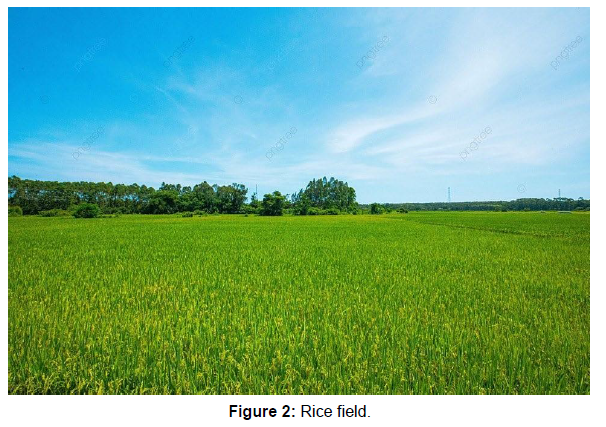
In a study conducted by the International Rice Research Institute, it was found that, on average, farmers lose 37% of their rice yield to pests and diseases, and that these losses can range between 24% and 41% depending on the production situation [7]. The field experiment was conducted during 2015-16 at Viswavidyalaya farm on summer rice following system intensification methodology to study the effects of three major pests on biological productivity. There were two treatments, unprotected and protected which were replicated six times following pair plot technique design. The invading weed, insect and disease pests in the experimental plots were identified as shown in (Figure 1). Weed pest caused maximum loss in seed yield 37.02% followed by insect pest 27.9% and disease pest 15.6%. SRI productivity increase may be attributed to improvement in growth and yield parameters resulting from management of pests in the respective critical infestation period. Eco-safe integrated management of all these three major pests during the critical crop pest competition period effectively below the ETL minimized losses to sustain paddy productivity at desired levels [8]. The severity of the diseases was recorded at 30, 50, 70 and 90 DAT on five randomly selected plants of each plot using the following rating scales. After scoring for different diseases PDI were calculated for each of the diseases separately. Blast disease of rice was scored based on 1-9 scale by following international rice research institute recommended grading scale [9]. Scoring of brown spot of rice was done by using the 0-9 rating scale by following international rice research institute recommended grading scale [10]. Recorded infection scores were then used in calculation of Percent Disease Index as suggested by McKinny. The result related to weed density and biomass showed that gradual increasing trend of the density and biomass of the weed flora from 30 to 70 DAT and the trend declined at the later stage of crop growth. In transplanted summer rice, the weed density and biomass is normally higher than that of the kharif rice. Moreover, as the crop was grown following SRI methodology, the more weed competition was observed as usually because of favorable low moisture status and suitable temperature under field condition [11]. The higher density and biomass of the rice associated weed Echinochloa formosensis and others like Leersia hexandra, Paspalum vaginatum, Cyperus difformis, Fimbristylis dichotoma, Ammania baccifera and Ludwigia octovalvis were higher over the semi aquatic weeds like Monochoria hastaefolia and Marsilea quadrifolia due to use of alternate wetting and drying situation in the summer rice field as shown in (Figure 2). Maximum grain yield was obtained from the protected plots of weed pests, followed by the insect and disease pests.Significant differences were observed in all the three major pests taken under observation. Protected plots under weed pest recorded an extra yield advantage of 1.92 t ha-1 from their unprotected plots [12]. More yields under the protected plots may be associated with lesser crop weed competition in the critical crop weed competition period along with higher dry matter accumulation, LAI and greater number of effective panicles m-2 and filled grain % [13]. These observations are fully supported by Rajkhowa where it has been documented that proper weed-control methods during the critical crop growth stages, significantly improved the yield attributes in rice might be due to decreased weed–crop competitions and thereby providing better crop-growing environment and nutrition to the crop [14]. Similar observations were also recorded in case of other two important pests, i.e. 1.45 t ha -1 and 0.81 t ha-1 more grain yield of rice were obtained in protected plots compared to their unprotected plots only because of adapting proper pest management practices in appropriate insect and disease infestation period which was in conformity with the results of Karmakar. The protected plots of weed, insect and disease pest recorded 1.43 t ha -1 , 1.13 t ha -1 and 0.74 t ha-1 more straw yield from their respective unprotected plots. Significant variation had been observed between the treatments of weed and disease pest experimental part on harvest index of rice. This comparative assessment of weed, insect and disease pests helped us to understand the extent of losses in seed yield of SRI under prevailing pest scenario is offered most by weeds followed by insects and then by diseases and how eco-safe management options respond to crop-pest competition. By minimizing the losses due to these major pests the paddy productivity could be increased to the desired level. Eco-safe integrated management of all these major pests during their critical crop pest competition period, so that the infestation could be brought below the ETL.
Conclusion
The average PMI value indicates 37% more contribution in grain yield of SRI by minimizing the losses in the experimental plots. The findings of the experiment may also help farmers to strategize their crop protection plan accordingly in summer SRI in the light of individuals’ resource affordability.
Acknowledgement
None
Conflict of Interest
None
References
- Wassmann R, Jagadish SVK, Heuer S, Ismail A, Redona E, et al.(2009) Climate Change Affecting Rice Production: The Physiological and Agronomic Basis for Possible Adaptation Strategies. Adv Agron US 101:59-122.
- Farooq MD, Usman MD, Nadeem F, Rehman HU, Wahid A, et al. (2019) Seed priming in field crops: Potential benefits, adoption and challenges.Crop Pasture Sci AU 70:731-771.
- Senthilkumar K, Bindraban PS, Thiyagarajan TM, Ridder ND, Giller KE (2008) Modified rice cultivation in Tamil Nadu, India: yield gains and farmers'(lack of) acceptance. Agric Syst UK 98:82-94.
- Ceccarelli S (2012) Plant breeding with farmers – a technical manual. ICARDA EU 92: 1-139.
- Davis FD (1989). Perceived usefulness, perceived ease of use, and user acceptance of information technology. MIS Quarterly US 13:319–339.
- Dogbe W, Marfo K, Bam R, Darte K, Ansere-Bio F (2002) Needs assessment of farmers’ rice systems and demands from varieties in Tambalug and Nyorigu Upper East Region, Ghana. CSIR AFR 155:315-327.
- Dorward P, Craufurd P, Marfo K, Dogbe W, Bam R, et al. (2007) Needs assessment of farmers’ rice systems and demands from varieties in Sayerano, Western Region, Ghana. UR AFR 40: 316-327.
- Kearney M, Porter W (2009) Mechanistic niche modelling: combining physiological and spatial data to predict species’ ranges. Ecol Lett UK 12:334–350.
- Kumar V, Ladha JK (2011) Direct Seeding of Rice: Recent Developments and Future Research Needs. Adv Agron US 111:297-413.
- Kotera A, Sakamoto T, Nguyen DK, Yokozawa M (2008) Regional consequences of seawater intrusion on rice productivity and land use in coastal area of the Mekong River Delta. Agric Environ 42:267-274.
- Pingali PL, Xuan VT (1992) Vietnam: Decollectivization and rice productivity growth. EDCC US 40:697-718.
- Rugumamu CP (2014) Empowering smallholder rice farmers in Tanzania to increase productivity for promoting food security in Eastern and Southern Africa. Agric Food Secur NY 1-8.
- Emmanuel D, Enoch OS, Victor O, Henry J (2016) Impact of row-planting adoption on productivity of rice farming in Northern Ghana. RAAE EU 19 :19-28
- Easter KW, Abel ME, Norton G (1977) Regional Differences in Agricultural Productivity in Selected Areas of India. Am J Agric Econ 59:257-265.
Indexed at, Google Scholar, Crossref
Indexed at, Google Scholar, Crossref
Indexed at, Google Scholar, Crossref
Indexed at, Google Scholar, Crossref
Indexed at, Google Scholar, Crossref
Indexed at, Google Scholar, Crossref
Indexed at, Google Scholar, Crossref
Indexed at, Google Scholar, Cross Ref
Indexed at, Google Scholar, Crossref
Indexed at, Google Scholar, Crossref
Citation: Cerda A (2023) Planting Resistance and Most Often Accurate Diagnosis for Rice Diseases. J Rice Res 11: 364. DOI: 10.4172/2375-4338.1000364
Copyright: © 2023 Cerda A. This is an open-access article distributed under the terms of the Creative Commons Attribution License, which permits unrestricted use, distribution, and reproduction in any medium, provided the original author and source are credited.
Share This Article
Recommended Journals
Open Access Journals
Article Tools
Article Usage
- Total views: 787
- [From(publication date): 0-2023 - Apr 01, 2025]
- Breakdown by view type
- HTML page views: 571
- PDF downloads: 216


