Research Article Open Access
Phenomena of Street Children Life in Juba, the Capital of South Sudan, a Problem Attributed to Long Civil War in Sudan
Rose Poni-Gore1*, Richard Lado Loro2, Emmanuel Oryem3, Romanya Edi Iro4, Wantok Bak Reec4, Cecilia Namule Mundu4and Malish Taban Christopher41Department of Community Medicine, University of Juba/South Sudan, Juba, Sudan
2Clinical Epidemiologist, National ministry of health South Sudan, Sudan
3Ministry of Health, South Sudan, Sudan
4College of Medicine, University of Juba, Sudan
- Corresponding Author:
- Rose poni-Gore
Assistant Professor of Community Medicine
University of Juba/South Sudan Juba
CES P.O.Box 82, Sudan
Tel: +211955511872
E-mail:roseponi196@gmail.com
Received Date: May 29, 2015; Accepted Date: June 25, 2015; Published Date: June 30 2015.
Citation:poni-Gore R, Loro RL, Oryem E, Iro RE, Reec WB et al., (2015) Phenomena of Street Children Life in Juba, the Capital of South Sudan, a Problem Attributed to Long Civil War in Sudan. J Community Med Health Educ 5:356. doi:10.4172/21610711.1000356
Copyright: © 2015 poni-Gore R, et al. This is an open-access article distributed under the terms of the Creative Commons Attribution License, which permits unrestricted use, distribution, and reproduction in any medium, provided the original author and source are credited.
Visit for more related articles at Journal of Community Medicine & Health Education
Abstract
Introduction: In the recent years Juba the capital of South Sudan has been experiencing the problem of street children, a problem attributed to long civil war in the Sudan, current economic crisis and the current political conflict which started on 15th December 2013. According to UNICEF(Sweitzland 1983), a street child is “ Any girl or boy who has not reached adulthood for whom the street has become her or his habitual abode or source of livelihood and who is inadequately protected ,supervised or directed by irresponsible adult.”
Methodology: The study took place in Juba city in the five major markets namely, Konyo konyo, Juba, Jebel, Custom and Munuki. It targeted children within the age of 6-17 years of age. The study was done by cross sectional design. The methods of data collection were questionnaires and interviews. The sample size was 120 and the data was analyzed by Excel program. Results: The findings were 55% were within the age of 10-14, 70% were boys,41.7% had both parents alive, 40% hadfamilies comprising of 6-10 members, 38.3% do minor business, 55.8% come from urban area, 54.2% sleep at home , 28.3% earn living by selling wares, 37.5% obtained food by buying, 30.8% used their money on family expense, 40% of them were School drop outs, 23.3% sniff glue, 59.2% go to the public hospital for treatment, 56.7% do not have knowledge about HIV/AIDS, 30% of the street children felt that the public do not like them, 43.3% of the street children said their life on the street was tough,44.2% of the street children were responsible for themselves and47.5% of the street children were on the street in search for employment.
Limitations: The study was faced with limitations such as consent.
Conclusion: Majority of the street children are male within the age of 10-14 years and originally from urban areas, with extended families of low socio-economic status. The highest percentages of the children go to the street for employment purpose, followed by parental loss, child abuse, strict regulations at home and commitment of offence. They survive by engaging in works such as selling wares, shoe shining, collecting rubbish, collecting empty battles for re-use by local beverage makers, washing cars, and others beg or steal, They face a lot of problems such as drop out from school, drugs abuse, feeding themselves by left over from restaurants and some sleep hungry, they experience inhuman treatment such as torture, rape and arrest by police. The government in collaboration with NGOs should create employment opportunities to the people, establish enough rehabilitation and correction centres, schools and health centres, campaign for the rights of street children rights, commemorate ‘Street children’s Day’(January 31st ) and empower street children by providing outreach education, training, food and health services.
Keywords
Food handlers; Food borne bacterial contaminants; Isolation rate; Hand rinse
Introduction
Juba City the Capital of south Sudan is experiencing the problem of street children, attributed to the long civil war in Sudan as a result of political, religious, social, economic problems. The war started in 1983 and ended with the signing of the Comprehensive Peace Agreement (CPA) in 2005 [1-4], in which about two million lives were lost as a result of war, famine, and diseases caused by the conflict and four million people were displaced, emerged families with single or no parents, and children were left in the street
Background
History of street children
The phenomenon of street children has been documented as far back as 1848 [5]. Orphaned and abandoned children have been a source of misery from earliest times. The typical age of a street child varies from place to place. In developing countries children as young as eight live completely on their own. In developed countries, street children are usually over the age of twelve. There are cultural differences to this phenomenon. The proportion of girls among street children is reported to be less than 30% in developing countries and about 50% in many developed countries. Most studies show a predominance of the male sex within the population [6-9]. The most common claim for finding fewer girls in the streets has been that they are taken off the streets to become prostitutes [9-11]. A more plausible reason for the gender difference is that because girls are needed in the household, they never get to the streets. Many street children come from femaleheaded homes in which boys are socialized into leaving home much earlier than western middle-class sensibilities deem appropriate and in which girls are encouraged to stay home far longer than is typical in the developed world [12].
Another factor-one less considered and more subtle-is the dynamics that go on between stepfathers and male stepchildren. This is a common situation and might At this point, it can be said that street children are of both genders although they are far more likely to be male in the developing world [13-15].
Justification and objective: To collect and gather information about the street children in Juba/South Sudan and enable the policy makers and well-wishers to set a strategy aimed at promoting and protecting the Child rights [15-17].
Methods
Our research is descriptive epidemiology, cross sectional study.
Study area
The study took place in the five major markets in Juba city namely; konyo konyo market, Jebel market, Juba market, custom market, and Suk Libya market.
Selection of sample and sample size
Initially observational study was done by conducting field visits, to areas that are crowded by the street children and mapped out. The study targeted 120 children form street, who randomly selected from five market areas, about 20 children from each market [18,19]. The street children were interviewed, and they referred their friends for interview
Data collection
The data collectors were deployed in the areas identified as gathering side of street children. The major instrument for investigation used in this research is interview using questionnaires [20-22].
Data analysis
The information obtain is coded and analyzed, through a computer excel program and statistical package for social scientist 8.0(spss8.0) [23-26] for frequency distribution, cross- tabulation and other factors analyzed.
Ethical issues
All the respondents were informed about the purpose of the study and their verbal consent was obtained. They were assured that the interview was anonymous.
Results Analysis and Discussion
From the data we gathered from the street children through questionnaire and interview, the following results were obtained. Some of the emotions that street children desire and their withdrawl symptoms from substance abuse are depicted in the Tables 1.1 and 1.2 respectively.
| Problems on the street | Possible effects of use |
| Hunger | Lessens hunger pains |
| Boredom | Adds excitement |
| Fear | Provides courage |
| Feelings of shame, depression, hopelessness | Helps to forget these feelings |
| Lack of medicine and medical care | Self-medication |
| Difficulty falling asleep because of noise and overcrowding, cold or heat, mosquito bites | Produces drowsiness |
| Being tired from lack of sleep because of noise or overcrowding | Increases energy to work |
| Risk of being attacked and abused | Improves alertness |
| No recreational facilities | Offers entertainment |
| Social isolation | Provides a sense of connection with other substance users |
| Loneliness | Promotes socializing |
| Physical pain | Relieves physical pain |
| No money for food | Makes it easier to steal |
Table 1.1: Some affects that street children may desire.
| Substances | Withdrawal symptoms |
| Anxiety, tremors, vomiting, sweating, convulsion, delirium (confusion & | |
| Alcohol | hallucinations) |
| Nicotine | Nervousness, sleep difficulty, abdominal pain, poor concentration, muscle |
| spasms, headaches, cough, changes in appetite | |
| Opioids | Anxiety, sweating, muscle cramps, runny nose, vomiting, diarrhoea, sleep |
| Difficulty | |
| Hallucinogens | No significant withdrawal symptoms |
| Cannabis | No or mild withdrawal symptoms |
| Hypnosedatives | Anxiety, irritability, inability to sleep, muscle cramps, convulsions, delirium |
| Stimulants | Caffeine: headaches, tiredness, aches and pains, anxiety |
| Amphetamines: fatigue, hunger, irritability, depression, suicidal feelings, sleeplessness | |
| Cocaine: fear, depression, nausea, vomiting, tremors, muscle pain, tiredness | |
| Inhalants | No significant withdrawal symptom |
Table 1.2: Withdrawal symptoms.
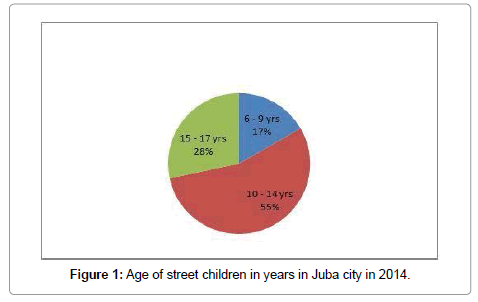
In Figure 1, the majority, 66 (55%) were under the age of 10-14 years followed by 34 (28.3%) under the age of 15-17 years and finally 20 (16.7%) under the age of 6-9 years. The high percentage of that age group indicates that these children can cope up with the street life, while the declining number with increase in the age could be due to their involvement in profitable economic activities which make them self-reliance and live in their own homes as shown in Table 2.1.
| Age in years | Number | percentage % |
|---|---|---|
| 6 - 9 yrs | 20 | 16.7 |
| 10 - 14 yrs | 66 | 55 |
| 15 - 17 yrs | 34 | 28.3 |
| Total | 120 | 100 |
Table 2.1: Age of street children in years in Juba city March to June 2014.
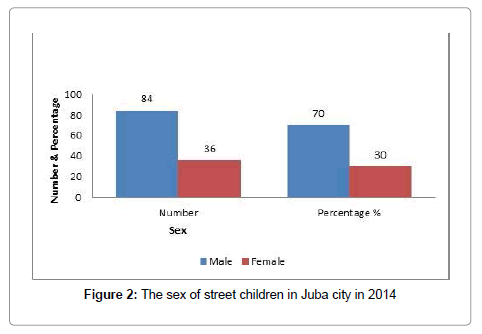
Figure 2 and Table 2.2 shows that, out of 120 children interviewed, the majority, 84 (70%) were male and 36 (30%) were female.
| Sex | Number | Percentage % |
|---|---|---|
| Male | 84 | 70 |
| Female | 36 | 30 |
Table 2.2: The sex of street children in Juba city in 2014.
This low percentage of the street girls is due to their preference to endure difficulties of life at home than on the street, because they are much more vulnerable to rape, and other forms of assault and exploitation compared to the boys. Secondly, as they grow up most of them leave the street and get involved in prostitution or early marriage and profitable work.
Family background
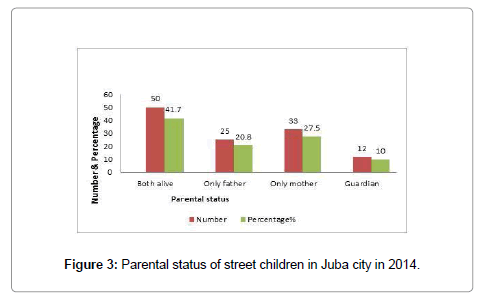
The below Figure 3 and Table 2.3 indicates that only 50 (41.7%) of street children have both parents alive, 25 (20.8%) have only father, 33(27.5%) have only mother and 12(10%) have guardian. The majority have lost a parent or both. This is attributed to long civil war in the Sudan, diseases, famine and internal conflicts in South Sudan.
| Parents | Number | Percentage% |
|---|---|---|
| Both alive | 50 | 41.7 |
| Only father | 25 | 20.8 |
| Only mother | 33 | 27.5 |
| Guardian | 12 | 10 |
| Total | 120 | 100 |
Table 2.3: Parental status of street children in Juba city in 2014.
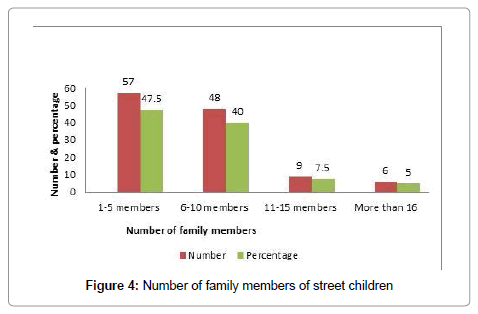
57(47.5%) of the street children have 1-5 members in the family, 48 (40%) have 6-10 members, 9(7.5%) have 11-15 members and 6(5%) have more than 16 members. In the above Figure 4, most street children come from large families (5-10 members) due to insufficient fulfilment of basic needs as illustrated in Table 2.4.
| Number | Number | Percentage |
|---|---|---|
| 1-5 members | 57 | 47.5 |
| 6-10 members | 48 | 40 |
| 11-15 members | 9 | 7.5 |
| More than 16 | 6 | 5 |
| Total | 120 | 100 |
Table 2.4: Number of family members of street children.
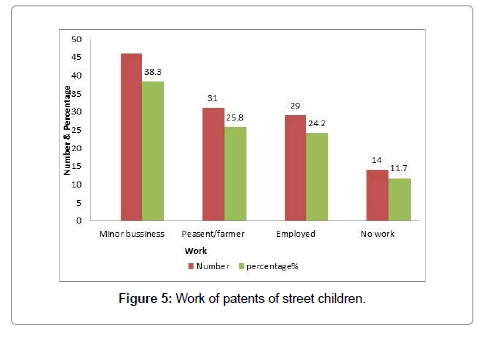
From the Figure 5 data, 46(38.3%) of street children’s parents do minor business, 31(25.8%) are peasant farmers, 29(24.2%) are employed and 14(11.7%) have no work. The data in Table 2.5 indicates that most of the street children come from low income earning parents such as farmers who cannot cater for the family needs.
| Work | Number | percentage% |
|---|---|---|
| Minor bussiness | 46 | 38.3 |
| Peasent/farmer | 31 | 25.8 |
| Employed | 29 | 24.2 |
| No work | 14 | 11.7 |
| Total | 120 | 100 |
Table 2.5: Work done by parents of the street children.
The above Figure 6 and Table 2.6 indicates that 42(35%) of the street children come from rural areas, 67(55.8) come from urban areas and 11(9.2%) come from refugee camps.
| Area | Number | Percentage% |
|---|---|---|
| Rural | 42 | 35 |
| Urban | 67 | 55.8 |
| Refugee camp | 11 | 9.2 |
| total | 120 | 100 |
Table 2.6: The areas where the street children come from.
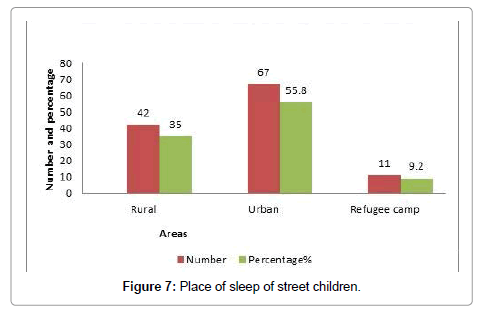
From the Figure 7, 65(54.2%) of the street children sleep at home, 41(34.2%) sleep on the streets while 14(11.6%) sleep both at home and on the streets as depicted in Table 2.7. Most street children are street working children who go back home at the end of the day while a big number are also homeless.
| Place | Number | Percentage% |
|---|---|---|
| Home | 65 | 54.2 |
| Street | 41 | 34.2 |
| Home& street | 14 | 11.6 |
| Total | 120 | 100 |
Table 2.7: Place of sleep of street children.
The economic activities of the street children
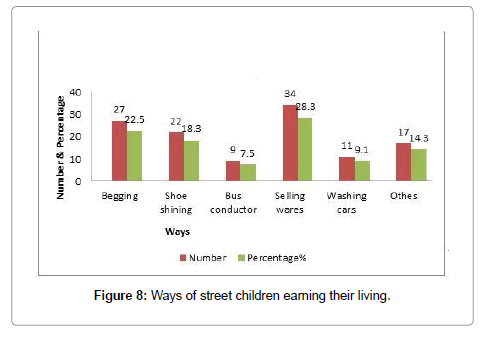
From the above Figure 8 and data of Table 2.8, 27(22.5%) beg, 22(18.3%) are shoe shiners, 9(7.5%) are bus conductors, 34(28.3%) sell wares, 11(9.1%) wash cars and 17(14.3%) do other work as begging and stealing.
| Way | Number | Percentage% |
|---|---|---|
| Begging | 27 | 22.5 |
| Shoe shining | 22 | 18.3 |
| Bus conductor | 9 | 7.5 |
| Selling wares | 34 | 28.3 |
| Washing cars | 11 | 9.1 |
| Others | 17 | 14.3 |
| Total | 120 | 100 |
Table 2.8: Ways of the street children earning their living.
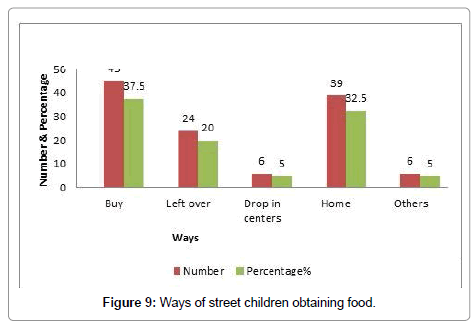
The above Figure 9 shows 45(37.5%) buy food, 24(20%) eat leftover from restaurants, 6(5%) eat from drop in centers, 39(32.5%) eat from homes, and 6(5%) eat from other ways like stealing food. Almost all the street children feed themselves and hardly get support from government or NGOs as noted in Table 2.9.
| Ways | Number | Percentage% |
|---|---|---|
| Buy | 45 | 37.5 |
| Left over | 24 | 20 |
| Drop in centers | 6 | 5 |
| Home | 39 | 32.5 |
| Others | 6 | 5 |
| Total | 120 | 100 |
Table 2.9: Ways of obtaining Food.
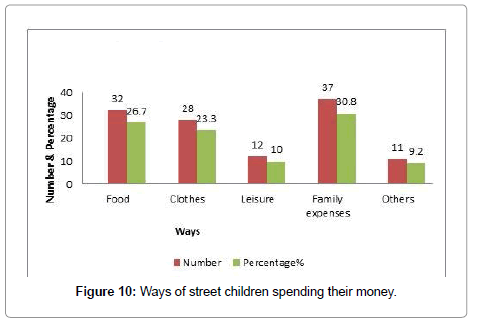
From the Figure 10 above and Table 2.10, 32(26 .7%) of the street children spend their money on food, 28(23.3%) on clothes, 12(10%) for leisure, 37(30.8%) on family expenses and 11(9.2%) on other things. Most of the children work to support their families.
| Ways | Number | Percentage% |
|---|---|---|
| Food | 32 | 26.7 |
| Clothes | 28 | 23.3 |
| Leisure | 12 | 10 |
| Family expenses | 37 | 30.8 |
| Others | 11 | 9.2 |
| Total | 120 | 100 |
Table 2.10: Ways of spending money.
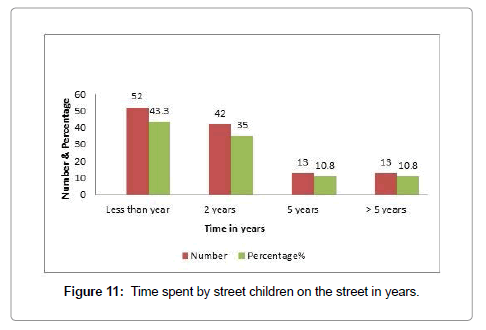
The above Figure 11 and Table 2.11 shows, 52(43.3%) of the street children have spent less than a year on the street life, 42(35%) spent two years, 13(10.8%) spent five years while 13(10.8%) spent over five years. Most children spend less than a year on the street due to the fact that as they grow up and start their own homes. Secondly, the few lucky street children will be taken by the government limited centers and NGOs.
| Time | Number | Percentage% |
|---|---|---|
| Less than year | 52 | 43.3 |
| 2 years | 42 | 35 |
| 5 years | 13 | 10.8 |
| > 5 years | 13 | 10.8 |
| total | 120 | 100 |
Table 2.11: Time spent on the street in years.
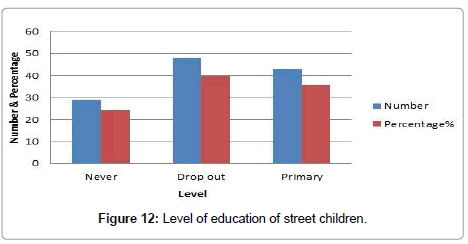
The Figure 12 and Table 2.12 above shows that 29(24.2%) of the street children never went to school, 48(40%) are school drop outs and 43(35.8%) are in primary. Most of the strret children are school drop outs and primary pupils. This is attributed to the fact that the children can’t proceed with their education beccause of the ecinomic crisis at home.
| Level | Number | Percentage% |
|---|---|---|
| Never | 29 | 24.2 |
| Drop out | 48 | 40 |
| Primary | 43 | 35.8 |
| total | 120 | 100 |
Table 2.12: Level of education of street children
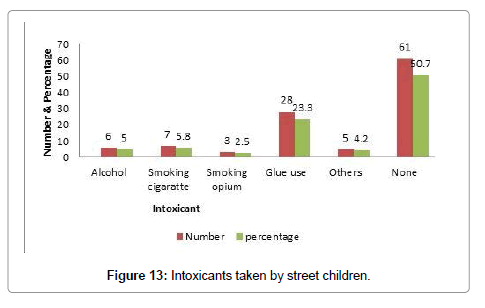
The above Figure 13 shows that 6(5%) of the street children take alcohol, 7(5.8%) smoke cigarattes, 28(23.3%) sniff glue, 5(4.2%) abuse other drugs while 61(50.7%) do not abuse drugs. a good percentage (49.3%) do abuse substances, as a way of forgetting their miseries, easing their pain, finding pleasure on the street and giving them braveness to engage in risky economic activities like stealing clearly mentioned in Table 2.13. Glue sniffing is most common because it is affordable for them.
| Intoxicant | Number | Percentage |
|---|---|---|
| Alcohol | 6 | 5 |
| Smoking cigaratte | 7 | 5.8 |
| Smoking opium | 3 | 2.5 |
| Glue use | 28 | 23.3 |
| Others | 5 | 4.2 |
| None | 61 | 50.7 |
| Total | 120 | 100 |
Table 2.13: Intoxicant taken by street children
Health status
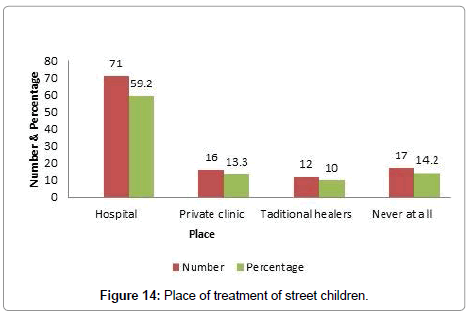
The Figure 14 and Table 2.14 indicates, 71(59.2%) of the street children go to public hospital for treatment, 16(13.3%) go to drug shops, 12(10%) go to traditional healers, while 17(14.2%) never go for treatment. Most of the street children go to public hospital for treatment. There are those who go to drug shops and get drugs without medical checkup as they lack parents to guide them. There are those who don’t care about their health at all and don’t seek medical treatment. Few also seek medical help from traditional herbalists
| Place | Number | Percentage |
|---|---|---|
| Hospital | 71 | 59.2 |
| Private clinic | 16 | 13.3 |
| Taditional healers | 12 | 10 |
| Never at all | 17 | 14.2 |
| Total | 120 | 100 |
Table 2.14: Place of treatment.
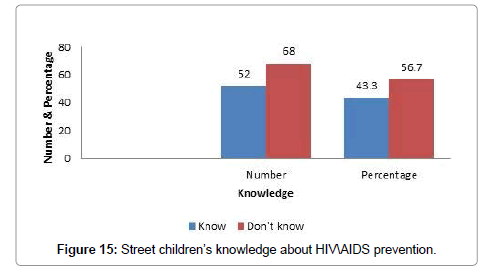
The Figure 15 and Table 2.15 indicates that 52(43.3%) of the street children have knowledge about HIV/AIDS prevention while 68(56.7%) do not have. Most street children are ignorant about health issues. They don’t know how to prevent HIV/AIDS. This can be explained by the fact that most of them are uneducated and nobody reaches them with such information as they are generally neglected. Therefore street children are prone to all sorts of diseases.
| About HIV/AIDS prevention | ||
|---|---|---|
| Knowledge | Number | Percentage |
| Know | 52 | 43.3 |
| Don’t know | 68 | 56.7 |
Table 2.15: Street children’s knowledge.
Day to day life on the street
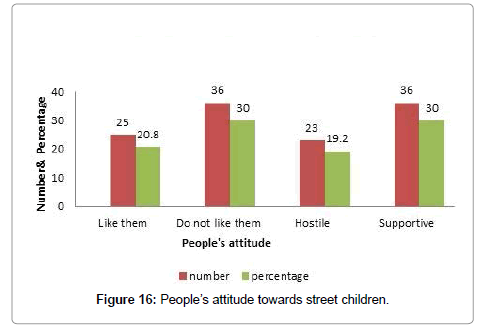
From the above Figure 16 data, 25(20.8%) of the street children said the public like them, 36(30%) said that the public does not like them, 23(19.2%) said that the public is hostile to them and 36(30%) said the public is supportive. Street children face rejection from the public as shown in Table 2.16. They are seen as bad, dangerous and criminals. Many people treat them cruelly and inhumanly. Yet there are those who see their human value and help them.
| Attitude | Number | Percentage |
|---|---|---|
| Like them | 25 | 20.8 |
| Do not like them | 36 | 30 |
| Hostile | 23 | 19.2 |
| Supportive | 36 | 30 |
| total | 120 | 100 |
Table 2.16: people’s attitude towards street children.
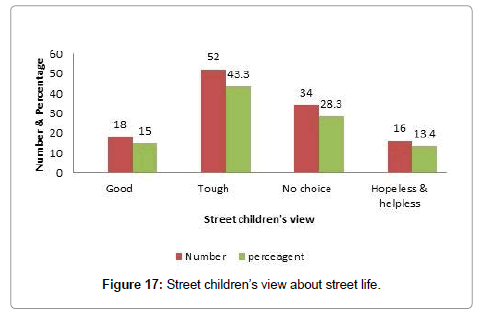
From the above Figure 17 and Table 2.18 data, 18(15%) of the street children said that life is good for them, 52(43.3%) said that life is tough, 34(28.3%) said they have no choice, and 16(13.4%) said life is hopeless and helpless.so street life is hard and the children stay there because they don’t have any other option. Only few are contented in Table 2.17.
| View | Number | Percentage |
|---|---|---|
| Good | 18 | 15 |
| Tough | 52 | 43.3 |
| No choice | 34 | 28.3 |
| Hopeless & helpless | 16 | 13.4 |
Table 2.17:Children view about street life.
| People | Number | Percentage |
|---|---|---|
| Parent/guardian | 50 | 41.7 |
| Self | 53 | 44.2 |
| Government | 7 | 5.8 |
| NGO | 10 | 8.3 |
| total | 120 | 100 |
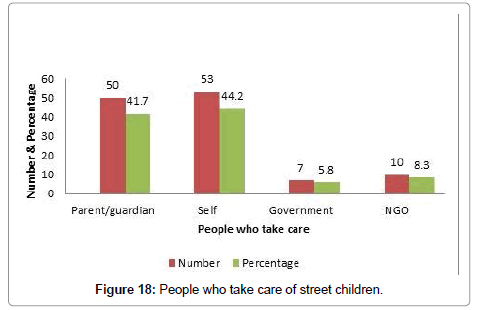
Table 2.18: People who take care of street children.
The above Figure 18 data indicates that 50(41.7%) are help by parents/guardian, 53(44.2%) are on their own, 7(5.8%) are helped by the government most, 10(8.3%) are helped by NGOs. The majority of the street children depend upon themselves and their parents/guardians, only little support is got from government and NGOs.
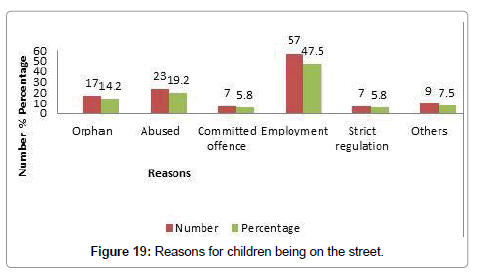
From the above Figure 19 and Table 2.19 data, 17(14.2%) of the street children are orphans, 23(19.2%) were abused at home, 7(5.8%) had committed offence, 57(47.5%) came for employment, 7(5.8%) left home because of strict regulations while 9(7.5%) other reasons.
| Reasons | Number | Percentage |
|---|---|---|
| Orphan | 17 | 14.2 |
| Abused | 23 | 19.2 |
| Committed offence | 7 | 5.8 |
| Employment | 57 | 47.5 |
| Strict regulation | 7 | 5.8 |
| Others | 9 | 7.5 |
| total | 120 | 100 |
Table 2.19: Reasons for children being on the street.
Conclusion and recommendation
Majority of the street children are male within the age of 10-14 years and originally from urban areas, with extended families of low socio-economic status.
The highest percentages of the children go to the street for employment purpose, followed by parental loss, child abuse, strict regulations at home and commitment of offence. They survive by engaging in works such as selling wares, shoe shining, collecting rubbish, collecting empty battles for re-use by local beverage makers, washing cars, and others beg or steal, They face a lot of problems such as drop out from school, drugs abuse, feeding themselves by left over from restaurants and some sleep hungry, they experience inhuman treatment such as torture, rape and arrest by police.
References
- Patel NB, Desai toral, Bansal RK, Girish Thakar (2011) Occupation Profile and Perception of street children in Surat City.
- Jeff Anderson (1985) Action international the challenge of street children and their family.
- van Beer H, SagepubCHD (1996) A Plea for a Child–Centred Approach in Research with Street Children, 3:195-201.
- Lewis Aptekar (1994) Street children in developing world.
- Enfants du monde (2009) Droits de l’Homme: survey on children in street situation in Juba City.
- (2007) Confident children out of conflict
- (2007) Integrated regional information network/Africa.
- (2001) A study on street children in Zimbabwe. Orphans and Other Vulnerable Children and Adolescents In Zimbabwe 89-104.
- Jiahangir Khan Achakzai (2011) Pakistan Economic and Social Review: Causes and effects of runaway children crisis Volume 49:211-230.
- Peter Anthony Kopoka Tanzania (2000) The problem of street children in Africa.
- (1999)Valentina Teclisi Czech Republic: The resocialization of the street children www.virtus.cz
- Anne Huser Ghana (2005) Identification of Street children Fafo-report 474.
- www.virtus.cz
- WHO Geneva, SwitzerlanddModule 1,2,3,4,5,6,7,8,9 and 10 - A Profile of Street Children
- Brandy Blackman (2001)Intervening in the Lives of Street Children.
- Panter-Brick C (2001)Street Children: Psychological Perspectives
- Sharma N, Joshi S (2013) Preventing -substance abuse among street children in India,7:137-148
- http://www.unesco.org/education/educprog
- Hafeez-ur-Rehman Chaudhry (2011) Street Children, A Great Loss to Human Resource Development in Pakistan Journal of Social Sciences, 31:15-27
- BT Costantinos (1996)Impact of urbanization on children and women. United Nations Children’s Fund.
- Lugalla JLP, Mbwambo JK (1999) Street children and street life in urban Tanzania: The culture of surviving and implications for children’s health, 23:329-344.
- Rachel Bray (2003) Predicting the social consequences of orphanhood in SouthAfrica.CSSR working paper, 29, Published by CSSR, Univeristy of Capetown.
- Peter Fonkwo Ndeboc.Study on Street Children in Mauritius, Mauritius Family Planning & Welfare Association.
- Ellen Hart-Shegos (1999) Homelessness and its effects on children.
- Joel Leo Boutin (2006) An Ounce of Prevention: Restructuring NGO Street and Vulnerable Children, Programs in Tanzania.
- (2005) Jamaica:Street children victims of urbanization.
Relevant Topics
- Addiction
- Adolescence
- Children Care
- Communicable Diseases
- Community Occupational Medicine
- Disorders and Treatments
- Education
- Infections
- Mental Health Education
- Mortality Rate
- Nutrition Education
- Occupational Therapy Education
- Population Health
- Prevalence
- Sexual Violence
- Social & Preventive Medicine
- Women's Healthcare
Recommended Journals
Article Tools
Article Usage
- Total views: 19818
- [From(publication date):
August-2015 - Apr 10, 2025] - Breakdown by view type
- HTML page views : 14932
- PDF downloads : 4886

