Performance of Logistic Regression in Artificial Intelligence for Public Health Issues: Meta-Analysis
Received: 11-Jul-2022 / Manuscript No. ECR-22-69056 / Editor assigned: 13-Aug-2022 / PreQC No. ECR-22-69056 / Reviewed: 27-Jul-2022 / QC No. ECR-22-69056 / Revised: 01-Aug-2022 / Manuscript No. ECR-22-69056 / Published Date: 08-Aug-2022 DOI: 10.4172/2161-1165.1000448
Summary
Logistic regression and other artificial intelligence (AIs) models have great potential to accurately predict the outcome in the field of public health. Also, logistic regression is the most popular choice as an analytic method if our outcome variable is categorical. The performance of any model matters if we have to chose as the best model. This is a meta-analysis study with the primary aim is to systematically review the performance of logistic regression used in public health and quantify those performances using meta-analysis, and secondary aim to compare the performance of logistic regression to other AIs or machine learning algorithms used in Public Health. A systematic literature search was performed to identify studies utilizing logistic regression in public health. The search strategy using the term “logistic regression [tiab] AND (machine learning [tiab] OR artificial intelligence [tiab]) AND public health [tiab]” was performed with additional filters in PubMed. The performance of the models was quantified using area under curve with its 95% confidence interval (AUC (95% CI)). A total of six studies were included after inclusion and exclusion criterion. The pooled AUC for logistic regression was 0.814 (95% CI 0.812 - 0.817) with high heterogeneity. Logistic regression,random forest, ANN, and gradient boosting model have similar performances with high discrimination ability (AUC >0.80). It was concluded that logistic regression can be used as one of the ML algorithms, but random forest, ANN, and gradient bosting are also good performing models. However further research with more appropriate design is needed to conclude the same.
Keywords
Area under curve (AUC); Artificial intelligence; Logistic regression; Machine learning; Public health
Introduction
Despite to be a newer area, artificial intelligence (AI) / Machine Learning (ML) tools and techniques are advantageous in providing in depth knowledge on individuals’ health and predicting population health risks, and their use for medicine as well as public health is expected to increase substantially in coming days. This field is growing at an unprecedented pace in health care, including disease diagnosis, risk analysis, triage or screening, surgical operations, and so forth.
Logistic regression is one of the most popular supervised ML algorithms if our aim is to predict disease presence (diagnosis) or disease outcomes (prognosis) [1]. It is used for predicting the categorical response variable using a given set of independent/input/ predictor variables. It examines the relationship between a binary outcome (dependent) variable such as presence or absence of disease and predictor (explanatory or independent) variables such as patient demographics or clinical findings. For example, In-hospital mortality for head injury patients might be predicted from knowledge of the patient’s age, Pupil reactivity, CT findings and hypotension and other clinical parameters in Emergency department. The outcome variables can be both continuous and categorical. If X1, X2… X n denotes n predictor variables, Y denotes the hospital mortality (Y = 1), and p denotes the probability of hospital mortality (i.e., the probability that Y = 1), the following equation describes the relationship between the predictor variables and p:
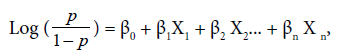
Where, β0 is a constant and β2, β2… β n are the regression coefficients of the predictor variables X1, X2… Xn. The regression coefficients are estimated from the available data and it represent the strength of the association between a patient characteristics and the outcome [2]. The probability of In-hospital mortality ‘p’ can be estimated with above equation. A logistic regression model is estimated using maximum likelihood methods, assuming that the outcome Y follows a binomial distribution [3].
ML models are typically evaluated in terms of discrimination performance (i.e., accuracy, area under the receiver operating characteristic [ROC] curve [AUC]). It is a measure of the ability of the model to “separate subjects with different responses”. Several ML techniques were used to develop prediction/prognostic/diagnostic models such as discriminant analysis, logistic regression analysis, neural networks, and recursive partitioning. Logistic regression method is applied most often but recursive portioning with construction of prediction tree may be attractive to clinicians because of simple presentation, but predictive performance may be sub-optional because of categorization of continuous predictors and overfitting of specific patterns in the data. Neural networks are becoming more popular due to their flexibility to predict the outcome when the relationship between the variables is complex, multidimensional, and nonlinear. However, the method is rather complex, the result difficult to interpret, and the model usually overfitted. Many found similar performance of neural network and logistic regression model but in a recent study. A systematic review showed that no performance benefit of other machine learning over logistic regression for clinical prediction models [4]. It would be great beneficial for acceptance of logistic regression from modeling utility point of view if we can conclude the performance of logistic regression used in public health is high and can be used in alternative of other ML methods.
The aim of this study was to systematically review the performance of logistic regression in terms of AUC used in public health and quantify those performances using meta-analysis. Secondary aim was to compare the performance of logistic regression to other ML algorithms used in Public Health.
Materials and Methods
Literature Search Strategy
A systematic literature search was performed to identify studies utilizing logistic regression in public health. The search strategy using the term “logistic regression [tiab] AND (machine learning [tiab] OR artificial intelligence [tiab]) AND public health [tiab]” was performed in PubMed by author VKK. Then again search strategy was filtered using full text availability, publication in last one year, only English language, journal article and observational studies, limited to human.
Inclusion and exclusion criteria
Studies were eligible if
• The article used logistic regression as one of the ML models
• One of the performance measures was evaluated in terms of AUC with 95% CI
Studies were excluded
• The models made predictions for individual images or signals rather than participants
• Model based on tweet or social media
Prisma guideline
I followed the Preferred Reporting Items for Systematic reviews and Meta-Analysis (PRISMA) statement, though the study was registered with PROSPERO due to time constrain.
Statistical analysis
Data analysis was conducted as per guideline provided in the Handbook of Cochrane Systematic Review [5]. For the primary and secondary objectives, the effect measures (AUCs) were pooled along with their 95% confidence interval (CI) using the random-effects model with the Hedge’s method considering substantial heterogeneity was present. Results were expressed through forest plot analysis and heterogeneity through Cochran's Q and I2 statistic. All the analysis was performed using STATA 15.1.
Result
Description of Studies
The electronic search retrieved 78 articles. After applying filter, as given in method section, I ended with 27 articles. After putting inclusion and exclusion criterion, I found six articles. The description of author, sample size, methods, AUC with 95% CI, and outcome is described in [Table 1] [6-11]. The median sample size was 64164 ranged from 95 to 207573 participants. Random forest, gradient boosting and ANN are other commonly used ML algorithms applied in public health. The 95% CI for logistic regression ranged from 0.594 to 0.957 in all these six studies.
| Study | Type (population or clinical data) | Total sample | Event rate | Methods used | Performance measure AUC (95% CI) |
Test sample available | Primary outcome measure |
|---|---|---|---|---|---|---|---|
| Raj et al. 2020 | Population | 78,542 | 1,066 | Logistic Regression | 0.79 (0.774, 0.806) | No | Child Marriage |
| Ridge Logistic Regression | 0.91 (0.898, 0.922) | ||||||
| Artificial Neural Network | 0.90 (0.888, 0.912) | ||||||
| Fernandes et al. 2021 | Population | 70,937 | 30,261 | Logistic Regression | 0.779 (0.776–0.783) | Yes | Absenteeism in Public Schools Teachers |
| Decision Tree | 0.776 (0.772–0.779) | ||||||
| Random Forest | 0.767 (0.763–0.770) | ||||||
| XGBoost | 0.784 (0.781–0.788) | ||||||
| Artificial Neural Network | 0.790 (0.787–0.793) | ||||||
| Lgarashi et al 2021 | Clinical | 210 | 43 | Logistic Regression | 0.875 (0.805, 0.945) | No | Supplemental Oxygen Requirement in Patients with COVID-19 |
| Decision Tree | 0.732 (0.64, 0.824) | ||||||
| K-Nearest Neighbor | 0.827 (0.748, 0.906) | ||||||
| Naive Bayes | 0.857 (0.783, 0.931) | ||||||
| Random Forest | 0.866 (0.794, 0.938) | ||||||
| Support Vector Machine | 0.892 (0.826, 0.958) | ||||||
| XGBoost | 0.856 (0.782, 0.93) | ||||||
| Wang et al 2020 | Population | 207573 | 184000 | Logistic Regression | 0.767 (0.762- 0.773) | Yes | Cataract Surgery |
| Random Forest | 0.785 (0.780- 0.790) | ||||||
| Gradient Boosting | 0.790 (0.785-0.795) | ||||||
| Artificial Neural Network | 0.781 (0.775- 0.786) | ||||||
| Ryu et al 2021 | Clinical | 95 | 44 | Logistic Regression |
0.70 (0.594, 0.806) | Yes | Clinical Anxiety |
| Snider et al 2021 | Clinical | 57390 | 2822 | Logistic Regression |
0.952 (0.946, 0.957) | No | Mortality with COVID-19 |
| XGboost | 0.956 (0.951, 0.961) | ||||||
| Random Forest | 0.948 (0.942, 0.954) | ||||||
| Artificial Neural Network | 0.9475 (0.942, 0.953) |
Table 1: Description of included study
Results of Pooling
Logistic regression model
The pooled AUC for logistic regression was 0.814 (95% CI 0.812 - 0.817, I2=99.8%) with high heterogeneity [Figure 1]. The test of θ, with z = 622.17, p = 0.000, indicates that the pooled results are statistically significant.

Figure 1: Forest plot for logistic regression model.
Random forest, ANN, and gradient boosting model
The pooled AUC for random forest model was 0.803 (95% CI 0.806 - 0.808, I2=99.9%) with high heterogeneity [Figure 2].

Figure 2: Forest plot for random forest model.

Figure 3: Forest plot for ANN model.

Figure 4: Forest plot for gradient booting model.
From [Table 2], it is clearly depicted that logistic regression, random forest, ANN, and gradient boosting model have high discrimination ability as AUC > 0.80, but all are performing more or less on same line, and I did not find any statistically significant difference among AUCs.
| Model | Pooled AUC (n=6) | Pooled 95% CI |
|---|---|---|
| Logistic regression | 0.814 | 0.812 - 0.817 |
| Random Forest | 0.803 | 0.806 - 0.808 |
| ANN | 0.824 | 0.822 - 0.827 |
| Gradient Boosting | 0.828 | 0.826 - 0.831 |
Table 2: Comparison of logistic regression, random forest, ANN, and gradient boosting models
Discussion
We systematically reviewed performance of six artificial intelligence-based or machine leering models used in public health for prediction. We found that logistic regression had high performance in terms of AUC. We also found that random forest, ANN, and gradient boosting are other commonly used ML models. These models were also highly performed and there was no any significance difference was observed.
Literatures suggest that all these models had high performance and but we cannot conclude that logistic regression was the best performing model [12] (4). In this case, logistic regression models might be more advantageous than ML methods due to interpretability and transparency. AUC was the most often reported performance variable across models, however most of study did not report 95% CI, which is essential for model comparison. Also, the wide variety of performance measure other than AUC is accuracy, specificity, sensitivity, recall etc. Future studies should include this performance measure to make fair comparison. Surprisingly none of the studies reported calibration ability (observed vs expected) of the models, which are essential for comparison.
The limitations of the study stem from the heterogeneity of the included studies as these are applicable in variety of field in public health and we have included only six studies which is a very less number to concluding any concrete decision. Also, half of the included studied are based on clinical data and half on population data. Half of the study did not use external validation or test data. So, further investigation is needed for high heterogeneity among studies. In this case, Meta regression would have been performed. One of the limitations of this study is that it does not investigate which factors influence the difference in performance (e.g., sample size, number of predictors, hyperparameter tuning, field of application etc.). I realize that such a study would be relevant, but it should be performed by comparing different scenarios on the same data sets to avoid confounding [13].
Future research should focus more on describing the type of predictive problems in which various algorithms have maximal value and it may differ from setting to setting. Also, future research should be done on adherence on the basis of TRIPOD guidelines.
Conclusion
The performance of logistic regression model seems very good as AUC>0.80. On the other hand, other machine learning models, namely random forest, ANN, and gradient bosting have similar performance, however further study with more appropriate design is needed to conclude the same.
References
- Steyerberg EW (2019) Clinical Prediction Models: A Practical Approach to Development, Validation, and Updating. Springer 574.
- Mushkudiani NA, Hernández AV, Murray GD, Choi SC, Maas AIR, et al (2008) A systematic review finds methodological improvements necessary for prognostic models in determining traumatic brain injury outcomes. J Clin Epidemiol 61(4):331-43.
- Frank E. Harrell Jr (2001) Regression Modeling Strategies: With Applications to Linear Models, Logistic Regression, and Survival Analysis. Springer
- Christodoulou E, Ma J, Collins GS, Steyerberg EW, Verbakel JY, et al (2019) A systematic review shows no performance benefit of machine learning over logistic regression for clinical prediction models. Journal of Clinical Epidemiology 110:12-22.
- Raj A, Dehingia N, Singh A, McDougal L, McAuley J (2020) Application of machine learning to understand child marriage in India. SSM Popul Health 12:100-687.
- Fernandes FT, Chiavegatto ADP (2021) Prediction of absenteeism in public schools teachers with machine learning. Rev Saude Publica 14; 55-23.
- Igarashi Y, Nishimura K, Ogawa K, Miyake N, Mizobuchi T, et al (2021) Machine Learning Prediction for Supplemental Oxygen Requirement in Patients with COVID-19. J Nippon Med Sch 89(2):161-168.
- Wang W, Han X, Zhang J, Shang X, Ha J, et al (2021) Predicting the 10-year risk of cataract surgery using machine learning techniques on questionnaire data: findings from the 45 and Up Study. Br J Ophthalmol Bjophthalmol-2020-318609.
- Ryu J, Sukei E, Norbury A, Liu SH, Baca-Garcia E, et al (2021) Shift in Social Media App Usage During COVID-19 Lockdown and Clinical Anxiety Symptoms: Machine Learning–Based Ecological Momentary Assessment Study .JMIR Ment Health 8(9):e30833.
- Snider B, McBean EA, Yawney J, Gadsden SA, Patel B. Identification of Variable Importance for Predictions of Mortality from COVID-19 Using AI Models for Ontario, Canada. Front Public Health 9:675-766.
- Song X, Liu X, Liu F, Wang C (2021) Comparison of machine learning and logistic regression models in predicting acute kidney injury: A systematic review and meta-analysis. Int J Med Inform151:104-484.
- Couronné R, Probst P, Boulesteix AL (2018) Random forest versus logistic regression: a large-scale benchmark experiment. BMC Bioinformatics 19(1):270-279.
- Collins GS, Reitsma JB, Altman DG, Moons KGM (2015) Transparent reporting of a multivariable prediction model for Individual Prognosis or Diagnosis (TRIPOD): the TRIPOD statement. J Clin Epidemiol 68(2):134-143.
Indexed at, Google Scholar, Crossref
Indexed at, Google Scholar, Crossref
Indexed at, Google Scholar, Crossref
Indexed at, Google Scholar, Crossref
Indexed at, Google Scholar, Crossref
Indexed at, Google Scholar, Crossref
Indexed at, Google Scholar, Crossref
Indexed at, Google Scholar, Crossref
Indexed at, Google Scholar, Crossref
Indexed at, Google Scholar, Crossref
Indexed at, Google Scholar, Crossref
Indexed at, Google Scholar, Crossref
Citation: Kamal VK, Kumari D (2022) Performance of Logistic Regression in Artificial Intelligence for Public Health Issues: Meta-Analysis. Epidemiol Sci, 12: 448. DOI: 10.4172/2161-1165.1000448
Copyright: © 2022 Kamal VK. This is an open-access article distributed under the terms of the Creative Commons Attribution License, which permits unrestricted use, distribution, and reproduction in any medium, provided the original author and source are credited.
Share This Article
Recommended Journals
Open Access Journals
Article Tools
Article Usage
- Total views: 1418
- [From(publication date): 0-2022 - Apr 03, 2025]
- Breakdown by view type
- HTML page views: 1094
- PDF downloads: 324